1677
Repeatability of the BOLD-CVR experiment at 3 T with fixed inspired CO2 concentration gas stimulus1Centre for Clinical Brain Sciences, University of Edinburgh, Edinburgh, United Kingdom, 2UK Dementia Research Institute, University of Edinburgh, Edinburgh, United Kingdom, 3Edinburgh Imaging Facility Royal Infirmary of Edinburgh, University of Edinburgh, Edinburgh, United Kingdom
Synopsis
The BOLD response to a gas with fixed inspired CO2 concentration is commonly used to assess the health of the cerebral vasculature. Cerebrovascular reactivity (CVR) magnitude repeatability has been assessed in previous studies, but without reporting potential physiological confounders such as heart and respiration rates. Furthermore, less is known about CVR delay repeatability. In this work, we assessed the within-day test-retest repeatability of both quantities in healthy volunteers at 3 T while measuring the heart and respiration rates. We found that both show good repeatability, though CVR delay estimates are unreliable in tissues with low contrast to noise ratio.
Introduction
Cerebrovascular reactivity (CVR) assesses the ability of cerebral blood vessels to dilate in response to brain demand for blood supply, which is altered in cerebrovascular diseases1 including small vessel disease (SVD).2 It is commonly measured using blood oxygen-level dependent (BOLD) magnetic resonance imaging (MRI) during a hypercapnic challenge.1 A gas with fixed inspired (FI) CO2 concentration is often used as a vasodilatory stimulus due to its ease of access and implementation.1 Though the repeatability of CVR magnitude has been assessed in different studies,3–9 processing methods, vasodilatory stimulus and magnetic field strength differed. Moreover, heart and respiration rates have not been reported and the repeatability of CVR delay has not been extensively investigated. Therefore, this analysis aimed at confirming the within-day repeatability of the 3 T CVR magnitude obtained with an FI stimulus while monitoring physiological variables, as well as investigating the CVR delay repeatability.Methods
Two CVR scans were acquired in healthy volunteers on a 3 T Siemens Prisma scanner using BOLD MRI (TR=1550ms, TE=30ms, FOV=235x235x125mm3) and FI stimulus (2-3-2-3-2 minutes alternating between medical air and 6% CO2-enriched air).3 Calibration of the gas apparatus was undertaken prior to each scan. End-tidal CO2 (EtCO2) and O2 (EtO2), heart rate and respiration rate were measured continuously during the scans. Participants were removed from the scanner for approximately 10 minutes between scanning sessions. Subcortical grey matter (GM) and normal-appearing white matter (NAWM) were segmented using FSL software.10 A general linear model was applied to fit the mean BOLD time-course of the regions of interest (ROIs) for multiple time-shifted versions of the EtCO2 vector:3$$BOLD_{signal}=B_0+B_t\cdot t+B_{CVR}\cdot EtCO2_{shifted}+\epsilon \tag{1}$$
The EtCO2 shift resulting in the lowest sum of squared residuals plus a four seconds sampling line delay was defined as the CVR delay, and the associated CVR magnitude (%/mmHg) was computed as:3
$$CVR=\frac{B_{CVR}}{BOLD_0}\times 100 \tag{2}$$
where BOLD0 is the BOLD baseline signal.
Repeatability was assessed using Bland-Altman statistics. Inter-scan and inter-block differences were reported as the mean differences with 95% confidence intervals (CIs). Coefficients of variation (CVs) were defined as the standard deviation (SD) of the differences between paired measurements divided by the mean (averaged first across visits and then across subjects).
Results
We acquired CVR, CVR delay and physiological data from 15 healthy volunteers (mean age: 28y, females: 53%; Table 1). The second CVR scan was acquired after a median interval time of 31.5 min. One subject was not included in the analysis due to severe motion artefacts.Repeatability was measured in both tissues for CVR magnitude (mean CVR over all scans: 0.26±0.04 %/mmHg, CVR difference and 95% CI: -0.02±0.02 [-0.03,-0.01] %/mmHg in GM; mean CVR: 0.06±0.01 %/mmHg, CVR difference: -0.008±0.007 [-0.011,-0.004] %/mmHg in NAWM; Figure 1) and CVR delay (mean delay: -0.2±2.3 s, delay difference: -0.5±1.9 [-1.5,0.5] s in GM; mean delay: 30±10 s, delay difference: 2.3±8.2 [-2.0,6.6] s in NAWM; Figure 1). CVs for repeatability of CVR magnitude were 8.0% in GM and 11.4% in NAWM. CV for repeatability of CVR delay in NAWM was 27.4%. CVR magnitude at scan 2 was on average lower than at scan 1, whereas no systematic change was found for CVR delay (Figure 2). The EtCO2 baseline was the same for both scans; however, the EtCO2 change during the CO2 blocks was greater for scan 2 (difference: 1.0±0.1 [0.5,1.5] mmHg; Figure 3). There was also an inter-scan difference in EtO2 change (difference: 1.5±2.1 [0.4,2.6] mmHg; Table 1). The BOLD baseline signals did not differ between scans. The heart rate was on average higher during scan 1 (difference: -6.2±5.8 [-9.3,-3.2] bpm), but remained constant throughout the blocks (Figure 4). There was no significant change in respiration rate in-between blocks and scans (inter-scan difference: 0.1±1.0 [-0.5,0.6] breaths per minute; Figure 4).
Discussion
The computation of CVR magnitude and delay in deep GM structures showed good repeatability; however, CVR delay was less repeatable in NAWM. On average, CVR magnitude was lower in scan 2 than in scan 1, while the EtCO2 change was greater in scan 2. It is possible that the sampled EtCO2 range exceeded the linear domain of the BOLD response, thereby reducing CVR estimates based on the standard linear model.11 It is not clear what caused the difference in EtCO2 change between the two scans. Such a bias has not been reported in other studies; however, most of them used EtCO2 targeting as stimulus.4,5 Habituation effects may lead to participants more comfortable with the gas challenge after the first scan, potentially affecting EtCO2.Conclusion
In this work, we assessed the repeatability of CVR magnitude and delay in deep tissue computed from the BOLD response to an FI CO2 stimulus. We found good repeatability of both metrics justifying their use in future clinical studies.Acknowledgements
This work was funded by the Medical Research Council (MRC) and UK Dementia Research Institute (UK DRI) which receives its funding from DRI Ltd, funded by the UK Medical Research Council, Alzheimer’s Society and Alzheimer’s Research UK, the European Union Horizon 2020, PHC-03-15, project No666881 ‘SVDs@Target’, the Fondation Leducq Transatlantic Network of Excellence for the Study of Perivascular Spaces in Small Vessel Disease, ref no. 16CVD 05, and Scottish Chief Scientist Office through NHS Lothian Research and Development Office. M.J.T. acknowledges financial support from the NHS Lothian Research and Development Office.
We thank the participants, radiographers and professional support staff for their contribution to this work.
References
1. Sleight E, Stringer MS, Marshall I, Wardlaw JM, Thrippleton MJ. Cerebrovascular Reactivity Measurement Using Magnetic Resonance Imaging: A Systematic Review. Front Physiol. 2021;12. doi:10.3389/fphys.2021.643468
2. Wardlaw JM, Smith C, Dichgans M. Small vessel disease: mechanisms and clinical implications. Lancet Neurol. 2019;18(7):684-696. doi:10.1016/S1474-4422(19)30079-1
3. Thrippleton MJ, Shi Y, Blair G, et al. Cerebrovascular reactivity measurement in cerebral small vessel disease: Rationale and reproducibility of a protocol for MRI acquisition and image processing. Int J Stroke. 2018;13(2):195-206. doi:10.1177/1747493017730740
4. Dengel DR, Evanoff NG, Marlatt KL, Geijer JR, Mueller BA, Lim KO. Reproducibility of blood oxygen level-dependent signal changes with end-tidal carbon dioxide alterations. Clin Physiol Funct Imaging. 2017;37(6):794-798. doi:10.1111/cpf.12358
5. Leung J., Kim J.A., Kassner A. Reproducibility of cerebrovascular reactivity measures in children using BOLD MRI. J Magn Reson Imaging. 2016;43(5):1191-1195. doi:10.1002/jmri.25063
6. Merola A, Germuska MA, Murphy K, Wise RG. Assessing the repeatability of absolute CMRO2, OEF and haemodynamic measurements from calibrated fMRI. NeuroImage. 2018;173(cpp, 9215515):113-126. doi:10.1016/j.neuroimage.2018.02.020
7. Dlamini N, DeVeber G, Logan W, et al. Breath-hold cerebrovascular teactivity - A reliable and reproducible tool for the assessment of cerebrovascular reserve in children with moyamoya. Cerebrovasc Dis. 2018;45(Supplement 1):411. doi:10.1159/000490132
8. Peng S.-L., Yang H.-C., Chen C.-M., Shih C.-T. Short- and long-term reproducibility of BOLD signal change induced by breath-holding at 1.5 and 3 T. NMR Biomed. 2020;33(3):e4195. doi:10.1002/nbm.4195
9. Kassner A., Winter J.D., Poublanc J., Mikulis D.J., Crawley A.P. Blood-oxygen level dependent MRI measures of cerebrovascular reactivity using a controlled respiratory challenge: Reproducibility and gender differences. J Magn Reson Imaging. 2010;31(2):298-304. doi:10.1002/jmri.22044
10. Woolrich MW, Jbabdi S, Patenaude B, et al. Bayesian analysis of neuroimaging data in FSL. NeuroImage. 2009;45(1, Supplement 1):S173-S186. doi:10.1016/j.neuroimage.2008.10.055
11. Halani S., Kwinta J.B., Golestani A.M., Khatamian Y.B., Chen J.J. Comparing cerebrovascular reactivity measured using BOLD and cerebral blood flow MRI: The effect of basal vascular tension on vasodilatory and vasoconstrictive reactivity. NeuroImage. 2015;110((Halani, Kwinta, Golestani, Khatamian, Chen) Rotman Research Institute, Baycrest Centre, Canada):110-123. doi:10.1016/j.neuroimage.2015.01.050
Figures
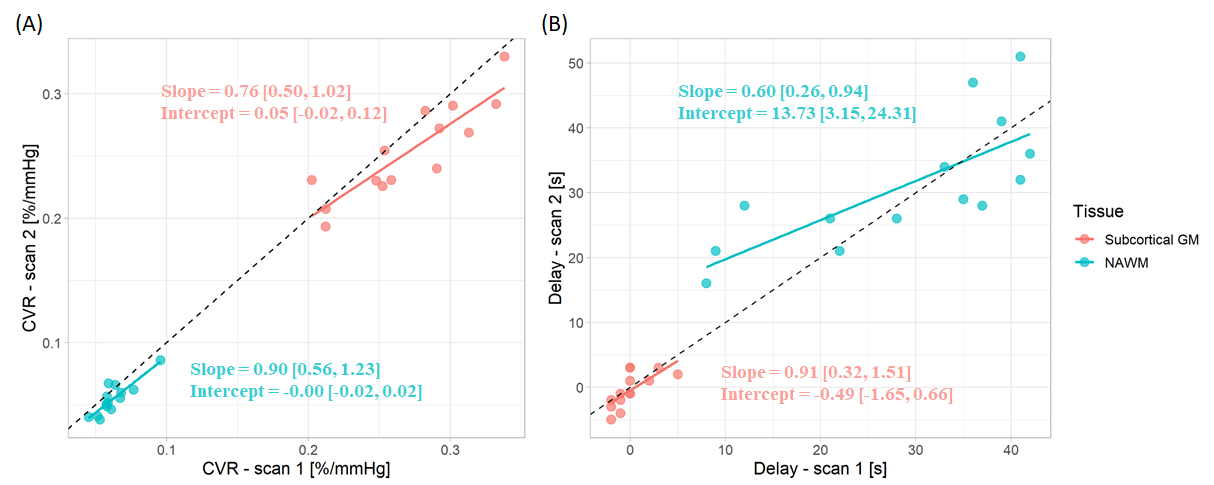
Figure 1: Comparison of CVR magnitude (A) and delay (B) in GM and NAWM. The dashed line is the line of equality. The slope and intercept resulting from linear modelling are given with the 95% CIs.
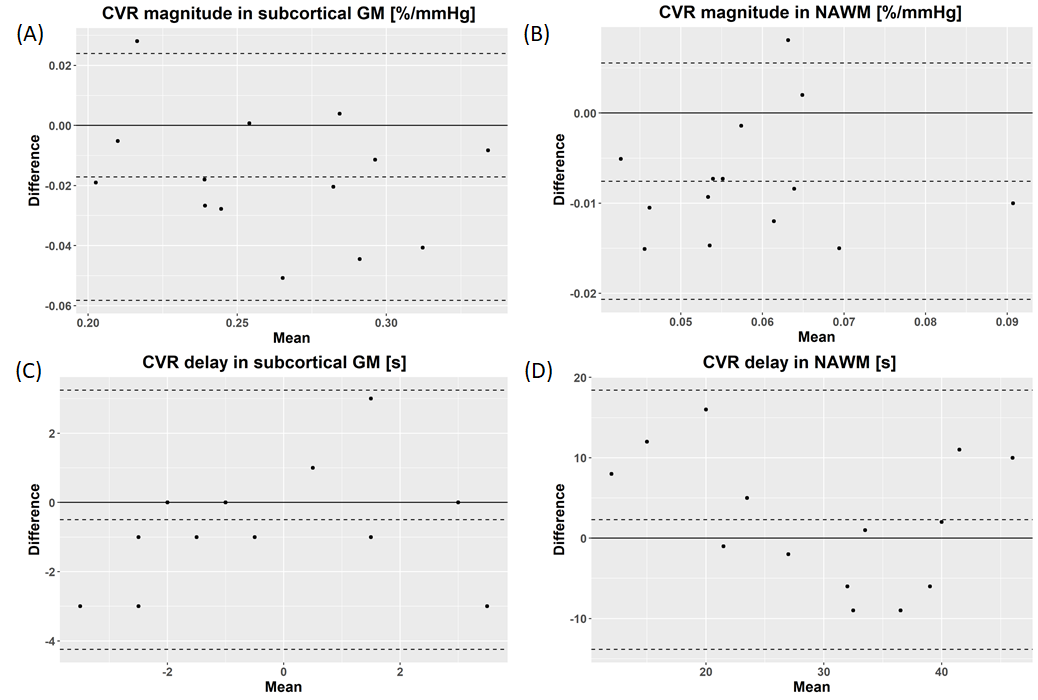
Figure 2: Bland-Altman plots showing repeatability of CVR magnitude (A, B) and delay (C, D) in GM (A, C) and in NAWM (B, D).. The dashed lines correspond to the mean difference between paired measurements and the associated 95% CI.
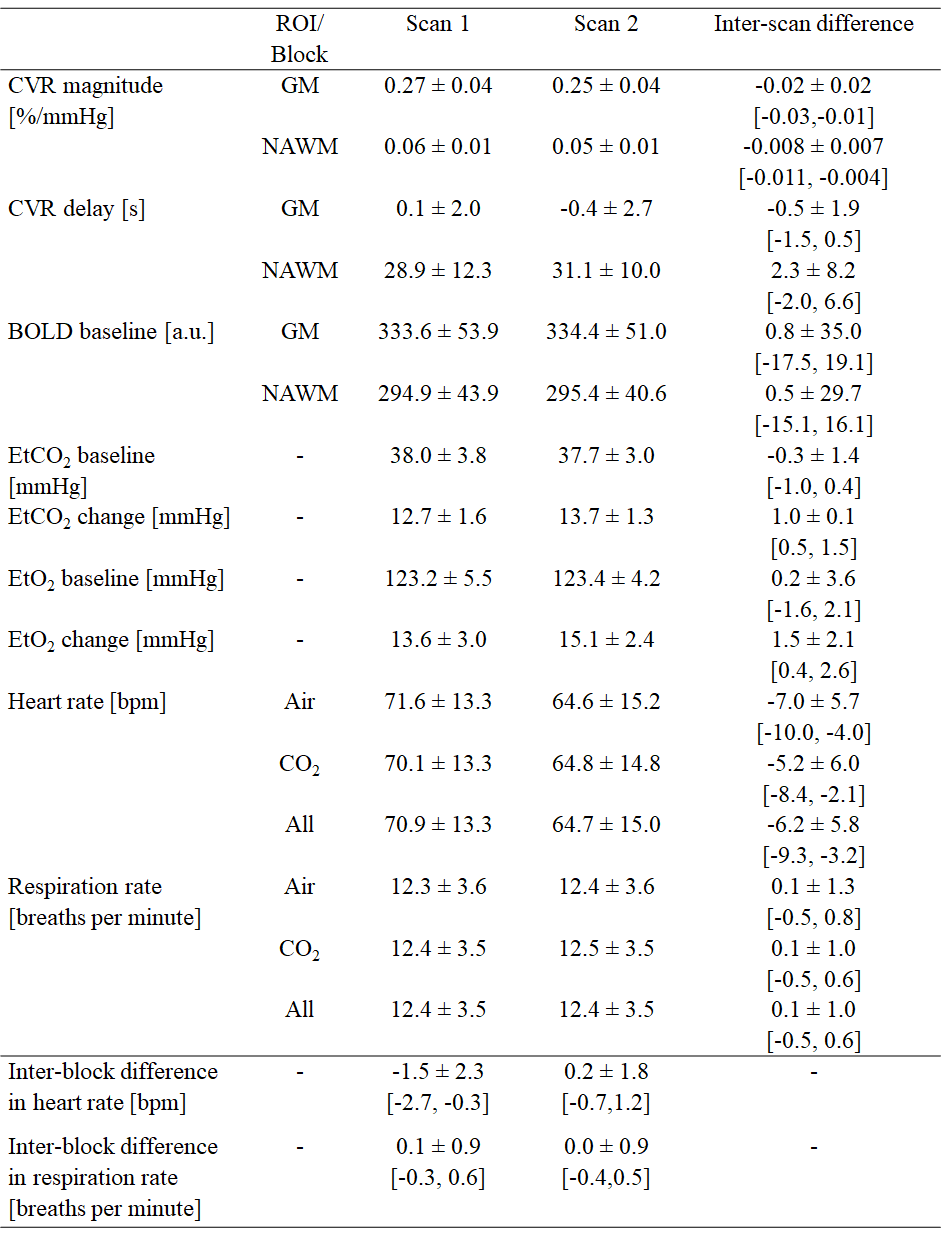
Table 1: Summary of data from scan 1 and 2 (mean ± SD) and inter-scan and inter-block differences (mean ± SD and 95% CI). The inter-scan difference was defined as the value measured during scan 2 minus the value measured during scan 1, whereas the inter-block difference was defined as the value during CO2 blocks minus the value during the air blocks.
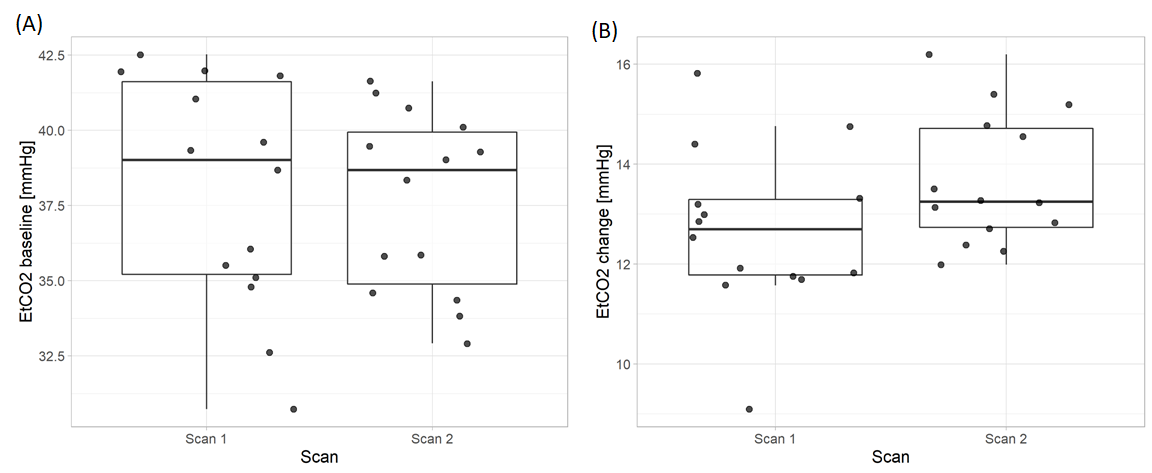
Figure 3: Inter-scan comparison of EtCO2 baseline (A) and EtCO2 change between air and CO2 blocks (B).
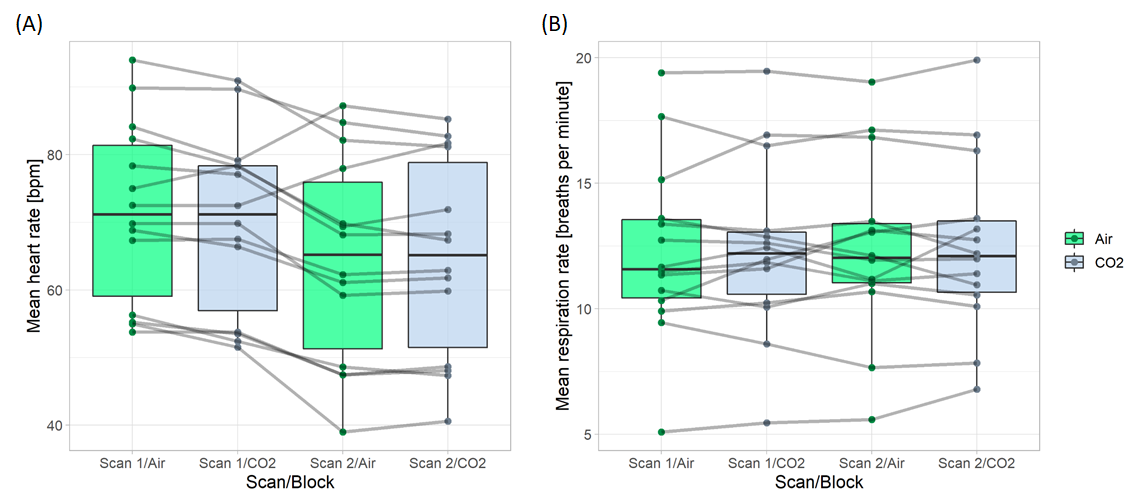
Figure 4: Comparison of mean heart (A) and respiration (B) rates between air and CO2 blocks and between scans.