1676
Self organization of breath-hold induced cerebrovascular BOLD fMRI responses reveals physiologically-driven brain parcellation and networks1Basque Center on Cognition, Brain and Language, Donostia, Spain, 2Physical Therapy and Human Movement Sciences, Feinberg School of Medicine, Northwestern University, Chicago, IL, United States, 3Biomedical Engineering, McCormick School of Engineering, Northwestern University, Evanston, IL, United States
Synopsis
Recent literature brought up the existence of physiological and vascular brain networks, i.e. areas showing synchronous responses to cardiac and respiratory fluctuations or hypercapnia. In this work, we show how breath-hold-induced BOLD fMRI time series from a dense mapping dataset can be parcellated into physiologically-driven networks, showing evidence of vascular contributions to the default mode network, in individuals and at the group level.
Introduction
A widespread application of BOLD-based fMRI is the identification of functional brain networks that co-activate at the same time. More recently, the existence of “physiological” or “vascular” networks, i.e. areas showing synchronous physiological responses such as cardiac and respiratory fluctuations1 or hypercapnia2, has been demonstrated. In this work, we hypothesize that a brain’s parcellation obtained from the BOLD response to a breath-hold task,as used for cerebrovascular reactivity evaluations, would provide meaningful information about vascular and physiologically-driven networks in individuals and at the population. We apply a Self-Organising Maps3 (SOM) algorithm to decompose fMRI timeseries of Breath-Hold (BH) induced physiological responses from a dense mapping dataset4.Methods
Seven subjects underwent a weekly BOLD-based fMRI scan consisting in a BH task (8 minutes) over the course of 10 weeks. A ME EPI sequence5 was adopted for BOLD-based imaging (3T Siemens PrismaFit, TR=1.5s, TEs=10.6/28.69/46.78/64.87/82.96 ms, 2.4x2.4x3mm3). A MP2RAGE and a T2w anatomical image were also acquired. Each session was preprocessed and denoised independently adopting an ICA-based conservative approach (see ME-CON in 4). The denoised BH data were expressed in signal percentage change, normalised to the MNI152 template (2.5mm), all subjects and sessions were concatenated. Next, a SOM clustering algorithm with 10, 15, and 20 clusters, initialised with a PCA decomposition, was run until convergence, based on the difference of the clusters’ timeseries between two successive iterations, reached zero. Furthermore, the data of the ten sessions of each subject were concatenated in native space, and the same SOM algorithm was run with 10, 15, and 20 clusters to obtain subject-level parcellations, in addition to the corresponding average response per cluster.Results
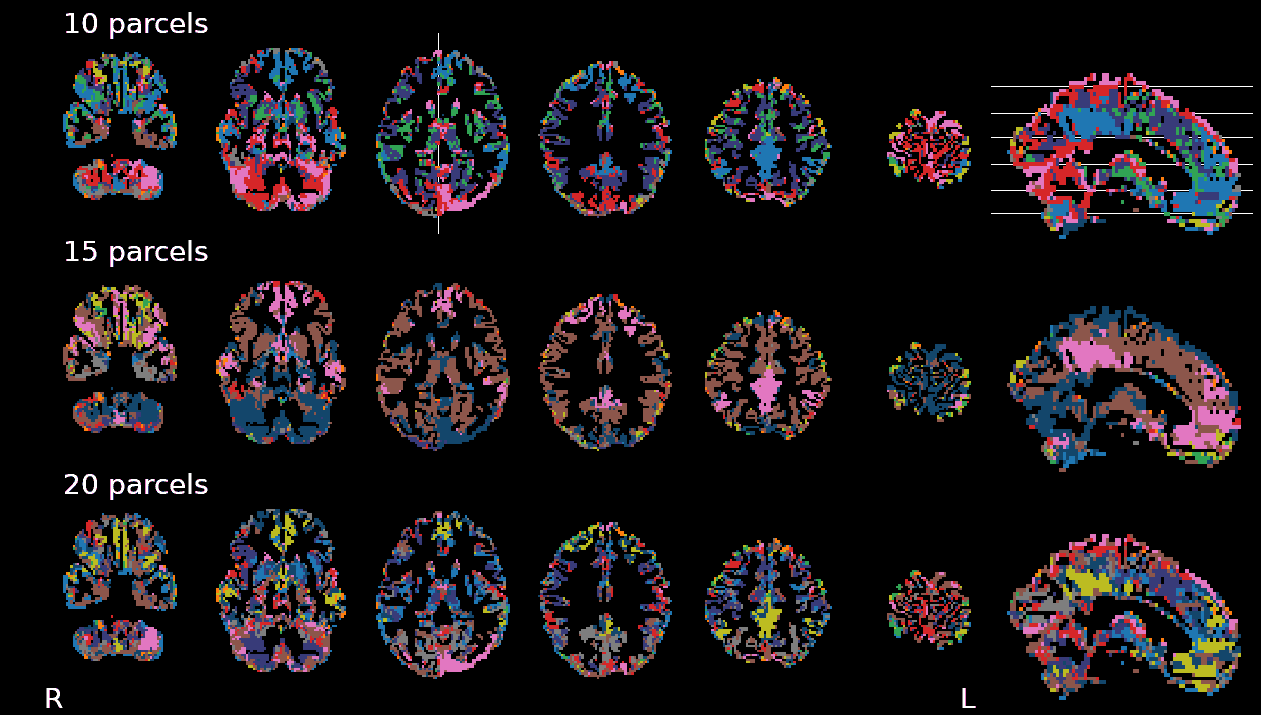
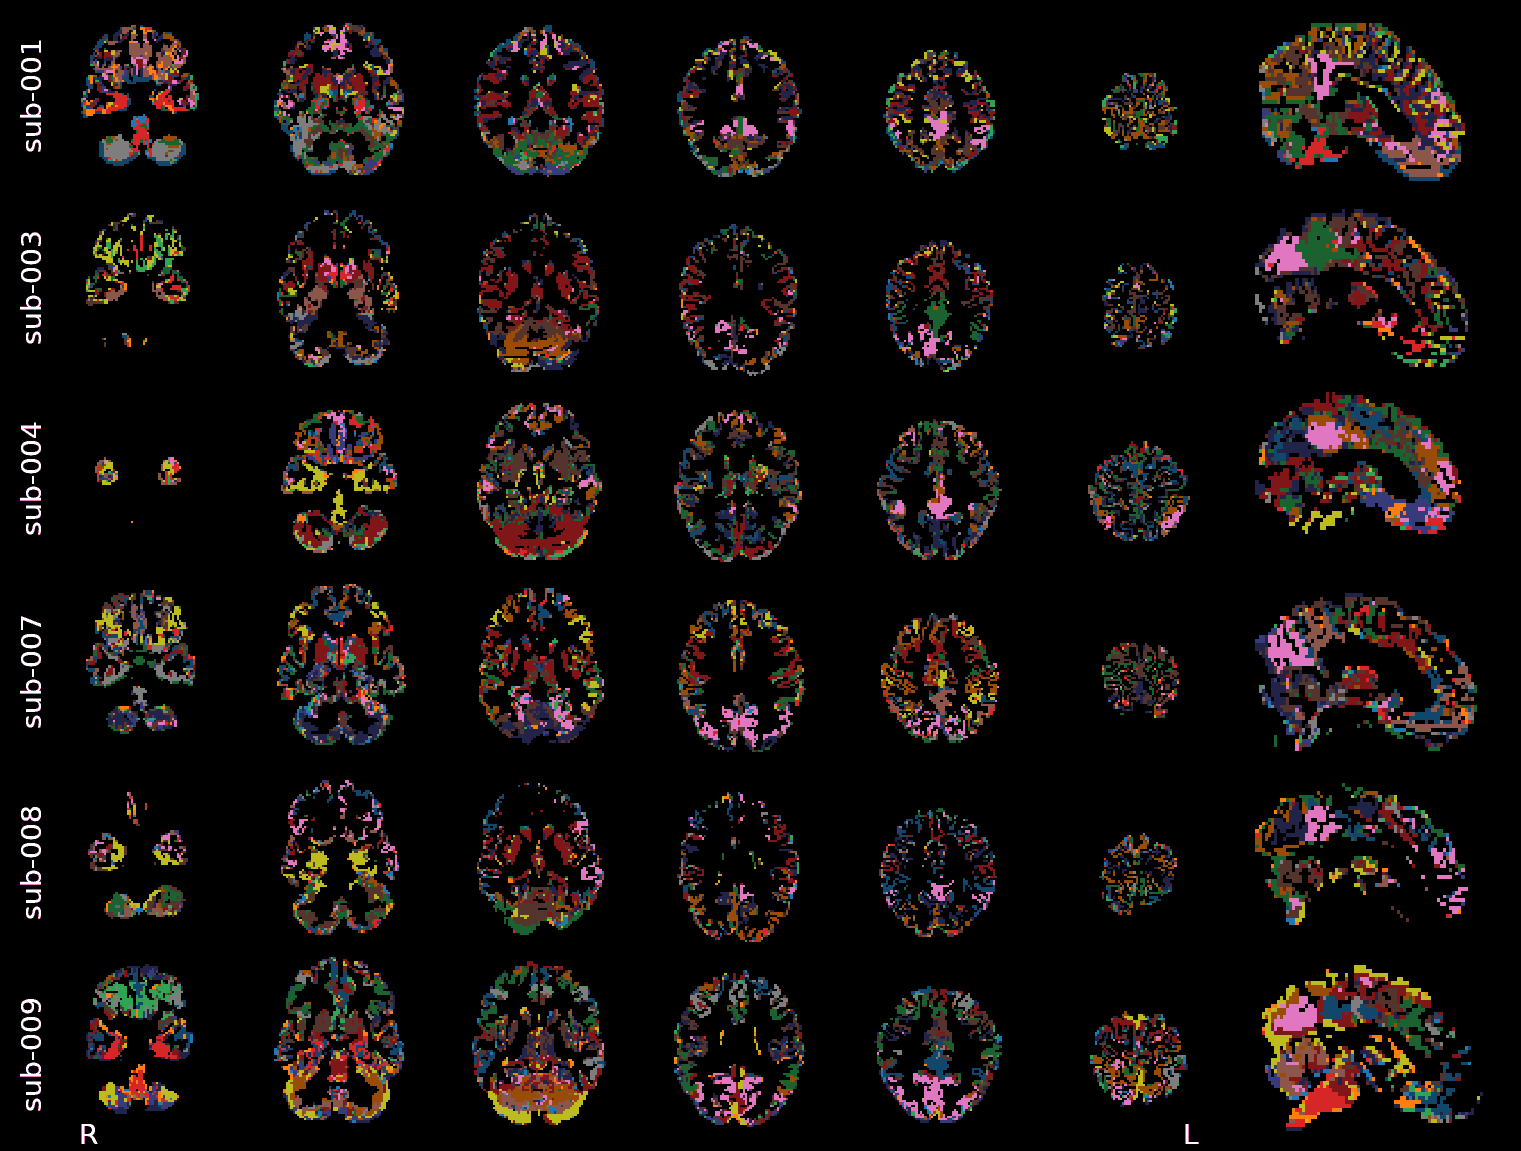
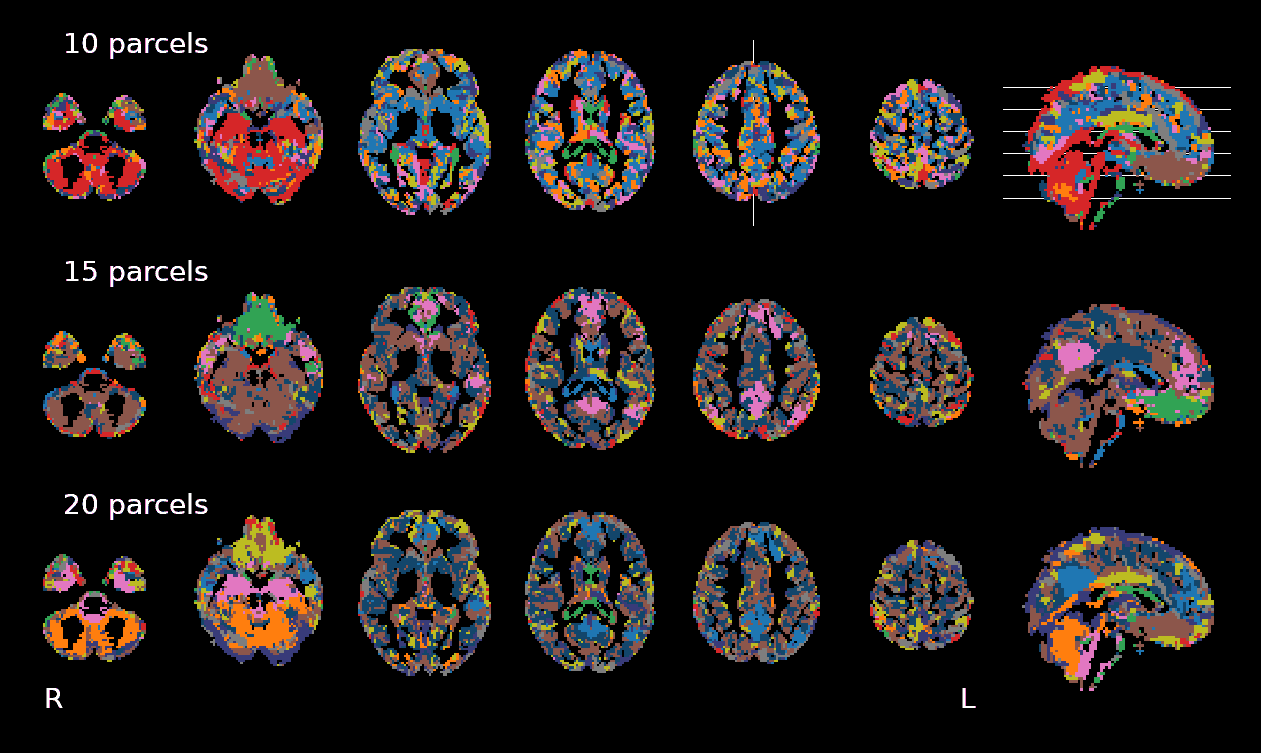
The SOM brain’s parcellations based on BH-induced BOLD signal changes revealed a structured organisation of grey matter voxels into clusters showing finer details with increasing number of clusters (Fig1). We observed a clear delineation of a cluster similar to the default mode network (DMN), showing the stereotypical response to a breath-hold trial (Fig2, pink cluster), corroborating previous observations on the existence of an important vascular contribution to this network2. This cluster was observed regardless of the number of clusters (providing more than 10 clusters), with a relatively stable spatial distribution across different numbers of clusters in the same subject. In addition, the DMN-like cluster was clearly identifiable in all subjects (Fig3). In addition, with 15 clusters we observed clusters that clearly resemble other common functional networks in certain subjects (Fig3). For example, a cluster covering occipital areas, and thus resembling the visual network, was observed in sub-003, sub-004, sub-007 and sub-009. Regions of the basal ganglia were generally clustered together at the level of individuals. It is clear that not all clusters show a “typical” response to a BH (cfr 4) (see nearly flat timeseries in Fig2), although those that do not are more scattered and group less voxels than those that do. Between the clusters that have a typical response to a BH, differences in onsets, as well as in the shape of the response itself, particularly regarding its plateau, can be observed. These observations call for a refinement of a subject-specific selection of the number of clusters. Finally, the group-level parcellation appeared to be less functionally structured than the subject-level parcellations, even though the DMN-like cluster was still clearly observed (Fig4). Importantly, inter-subject anatomical variations, as well as partial volume effects and the mixing of different BH-induced BOLD responses across neighbouring tissues introduced by spatial transformations and interpolations might have altered the group-level parcellations.Discussion & Conclusions
SOM can successfully parcellate the brain’s responses to a BH task that trigger a substantial increase in cerebral blood flow in physiologically relevant clusters. Clusters resembling functional networks, but whose average response corresponds to an increased BOLD signal during periods of BH, can be noticed. Similar networks have been previously reported associated with periods of induced hypercapnia and dissociated from task induced activity2 (tIA), as well as with a substantial contribution of physiological signal sources1. Moreover, clusters that comprehend areas of important vascular traits, such as the sagittal sinus, appear. As a limitation, the use of BH data does not exclude the influence of tIA associated with the compliance to the task instructions. While a computerised CO2 challenge might remove tIA collinear to the BH response, fluctuations associated to functional networks might still be present in such data.Acknowledgements
The authors would like to thank Luis Hernandez-Garcia for insights about the SOM algorithm.
This research was supported by the European Union’s Horizon 2020 research and innovation program (Marie Skłodowska-Curie grant agreement No. 713673), a fellowship from La Caixa Foundation (ID 100010434, fellowship code LCF/BQ/IN17/11620063), the Spanish Ministry ofEconomy and Competitiveness (Ramon y Cajal Fellowship, RYC-2017- 21845), the Spanish State Research Agency (BCBL “Severo Ochoa ”excellence accreditation, SEV- 2015-490), the Basque Government (BERC 2018-2021 and PIBA_2019_104), the Spanish Ministry of Science, Innovation and Universities (MICINN; PID2019-105520GB-100 and FJCI-2017-31814), and the Eunice Kennedy Shriver National Institute of Child Health and Human Development of the National Institutes of Health under award number K12HD073945 .
References
1. Chen JE, Lewis LD, Chang C, et al. Resting-state “physiological networks.” Neuroimage. 2020;213(March):116707. doi:10.1016/j.neuroimage.2020.116707
2. Bright MG, Whittaker JR, Driver ID, Murphy K. Vascular physiology drives functional brain networks. Neuroimage. 2020;217. doi:10.1101/475491
3. Kohonen T. Self-organized formation of topologically correct feature maps. Biol Cybern. 1982;43(1):59-69. doi:10.1007/BF00337288
4. Moia S, Termenon M, Uruñuela E, et al. ICA-based denoising strategies in breath-hold induced cerebrovascular reactivity mapping with multi echo BOLD fMRI. Neuroimage. 2021;233:117914. doi:10.1016/j.neuroimage.2021.117914
5. Moeller S, Yacoub E, Olman CA, et al. Multiband multislice GE-EPI at 7 tesla, with 16-fold acceleration using partial parallel imaging with application to high spatial and temporal whole-brain FMRI. Magn Reson Med. 2010;63(5):1144-1153. doi:10.1002/mrm.22361
Figures