1675
Impact of Acute Intermittent Hypoxia on BOLD fMRI measures of cerebrovascular reactivity1Physical Therapy and Human Movement Sciences, Northwestern University, Chicago, IL, United States, 2Biomedical Engineering, Northwestern University, Chicago, IL, United States, 3Physical Medicine and Rehabilitation, Northwestern University, Chicago, IL, United States, 4Shirley Ryan AbilityLab, Chicago, IL, United States
Synopsis
We assess the effects of an emerging intervention for rehabilitation, termed acute intermittent hypoxia (AIH), on cerebrovascular reactivity (CVR) as measured with BOLD fMRI. Lag-optimized CVR was measured pre- and post-AIH using a breath-hold task paradigm in 8 healthy participants. Five participants achieved the target drop in oxygen saturation (SpO2) to 85%; 3 did not. Overall changes in group mean CVR were varied following AIH, slightly increasing for those who achieved the targeted SpO2, and decreasing in those who did not. This work motivates continued study of the effects of AIH interventions on CVR.
Introduction
This work examines the neurovascular effects of exposure to acute intermittent hypoxia (AIH), an emerging intervention in rehabilitation that has been shown to temporarily improve arterial O2 delivery throughout the body and central nervous system[1], increase baroreceptor sensitivity[2], decrease blood pressure in those with hypertension[3], and enhance muscular strength and function in those with spinal cord injury.[4-6] These physiological changes potentiate approximately 1hr after the intervention.[7] AIH has also been shown to increase the expression of serotonin, a known modulator of cerebrovascular reactivity (CVR).[7,8] However, the cerebrovascular response in gray matter (GM) to AIH is not well described.[7] Measuring cerebrovascular reactivity (CVR) with a breath-hold task during a BOLD fMRI acquisition is a feasible and robust indicator of the brain’s ability to respond to vasodilatory stimuli.[9,10] In this work we make observations of CVR pre- and post-AIH in healthy participants, as motivation for expanded work into clinical populations.Methods
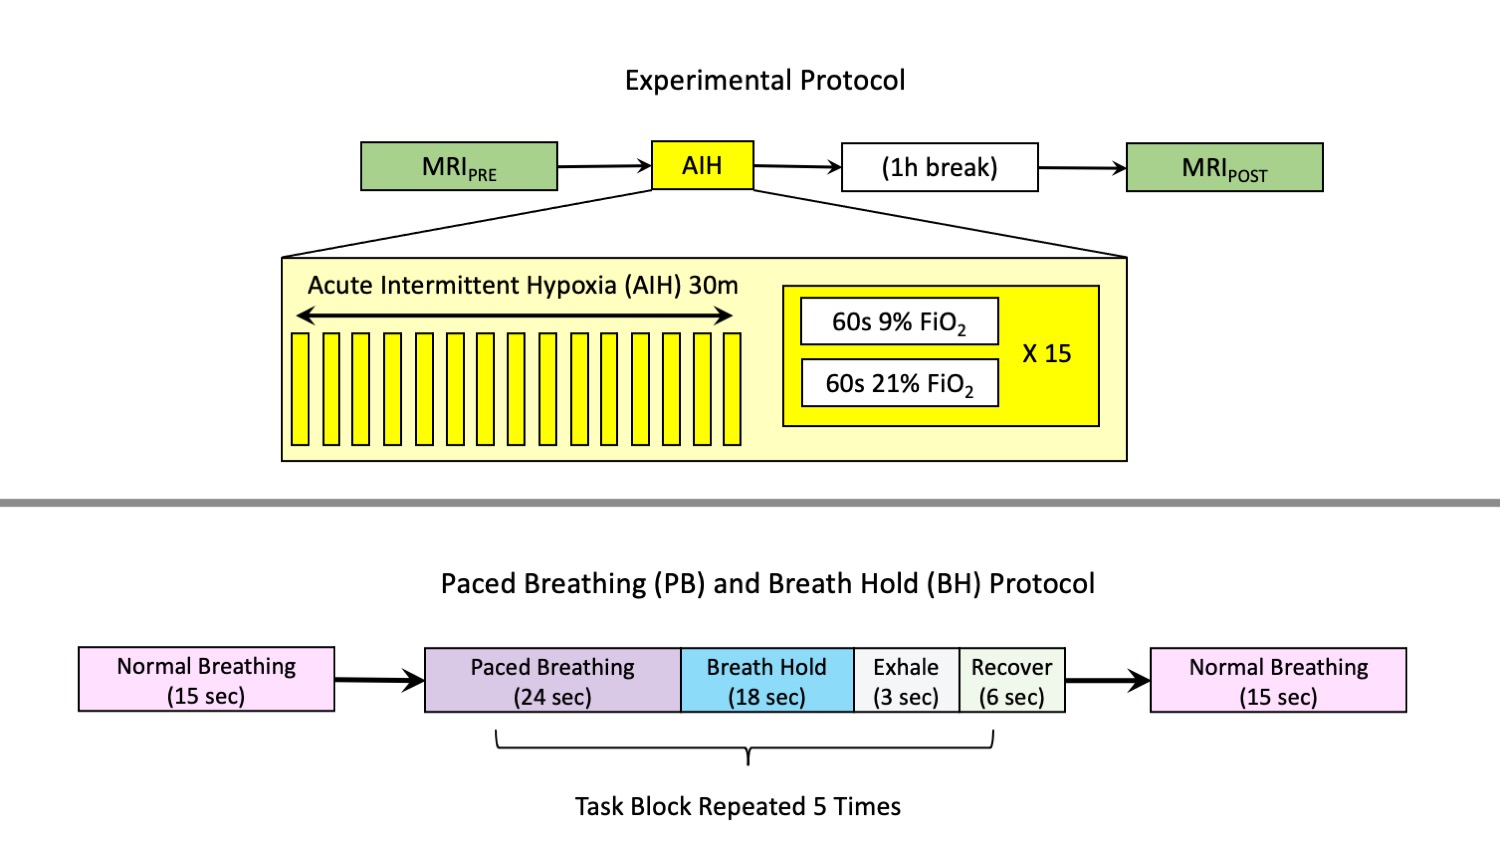
Eight healthy participants (24.1±4.5 yrs, 6F) were recruited for this study. As shown in Figure 1, the experiment entailed 2 sets of MRI examinations, before and after AIH, with the second set acquired 1-hour following the intervention. The AIH protocol consisted of 15 cycles of 2 minutes of variable hypoxia (9% FiO2) and normoxia (21% FiO2), for a total of 30min. Within each cycle, the duration of hypoxia was between 30 and 60sec to best achieve the targeted SpO2 drop, with normoxia being delivered for the remainder of the cycle. Hypoxia was delivered with an oxygen generator (HYP-123, Hypoxico Inc, New York, New York, USA), and SpO2 was monitored at the finger to determine the effect of hypoxia exposure, with a target SpO2 of 82-85%.[4]All images were acquired on a Siemens 3T Prisma scanner with a 64-channel head coil. During the scanning sessions, anatomical T1-weighted images were acquired using an MPRAGE protocol. Functional T2* images were acquired during breathing tasks with parameters: TR/TE=1200/34.4ms, FA=62°, Multi-Band (MB) acceleration factor=4, 60 axial slices in ascending, interleaved order, 2mm isotropic voxels, FOV=208×208mm2, Phase Encoding=AP, phase partial Fourier=87.5%, and bandwidth=2290 Hz/Px. 259 volumes were acquired, for a total acquisition time of 5min 10sec. A single-band reference volume (SBRef) was acquired before each functional acquisition for volume registration.
Anatomical images were coregistered to MNI space using fsl_anat, FSL; then tissue masks were also created and registered to the anatomical scans. [11-13] Functional images were motion corrected by volume registration to the SBRef image. Then, functional images were skull-stripped and co-registered with the anatomical image.[14] Gray matter (GM) tissue masks were then transformed using the anatomical to functional warps, and mean GM time series were created.
Exhaled CO2 was collected during the scan via nasal cannula and gas analyzer (ADInstruments, Colorado Springs, CO, USA). A PETCO2 regressor was created and bulk shifted to maximize the cross correlation with the GM mean time series for each functional scan.[10] Multiple PETCO2 regressors were then created from the bulk shifted regressor by making small shifts of the trace 9 seconds forwards and backwards in time by 0.3sec intervals, for a total of 60 shifted regressors.[10] A voxelwise GLM was calculated (3dREMLfit, AFNI) for each shifted CO2 regressor.[10,14] The shifted regressor with a maximum R-squared value was chosen for each voxel to create an optimally shifted CVR map. Lastly, lag optimized CVR maps were transformed to MNI space for group comparisons.
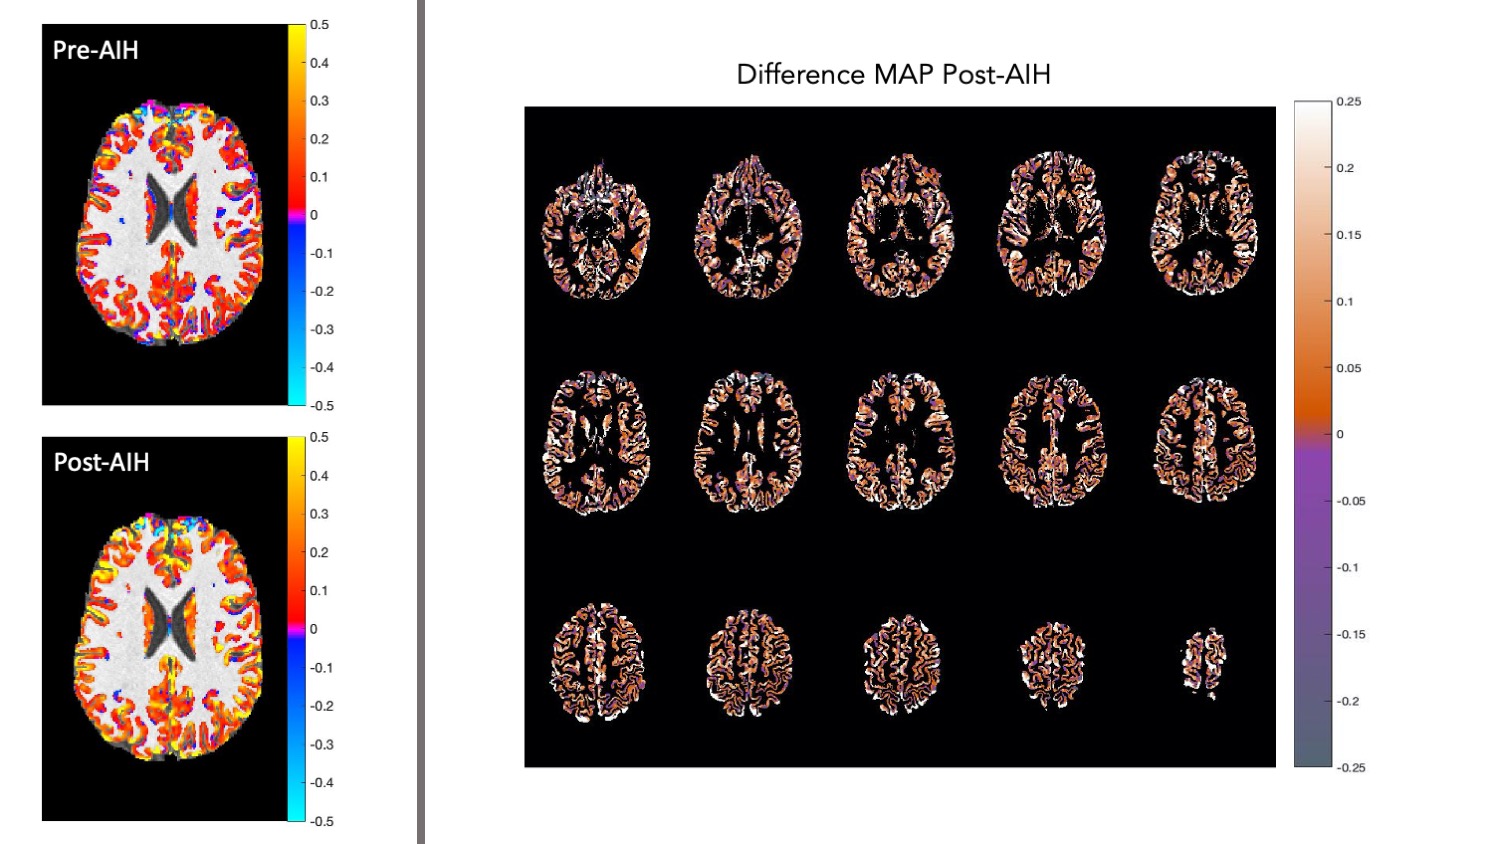
CVR differences after AIH were measured on a participant and group basis. CVR difference maps (ΔCVR) for each participant were created by subtracting the first scan (S1) CVR from the second scan (S2) CVR. Example CVR and ΔCVR maps are shown in Figure 2. Median GM CVR values were calculated for each participant; then S1 and S2 group average GM CVR and ΔCVR maps were calculated using MNI-registered data (fsl_anat, FSL) and masked using MNI GM masks.[11]
Results
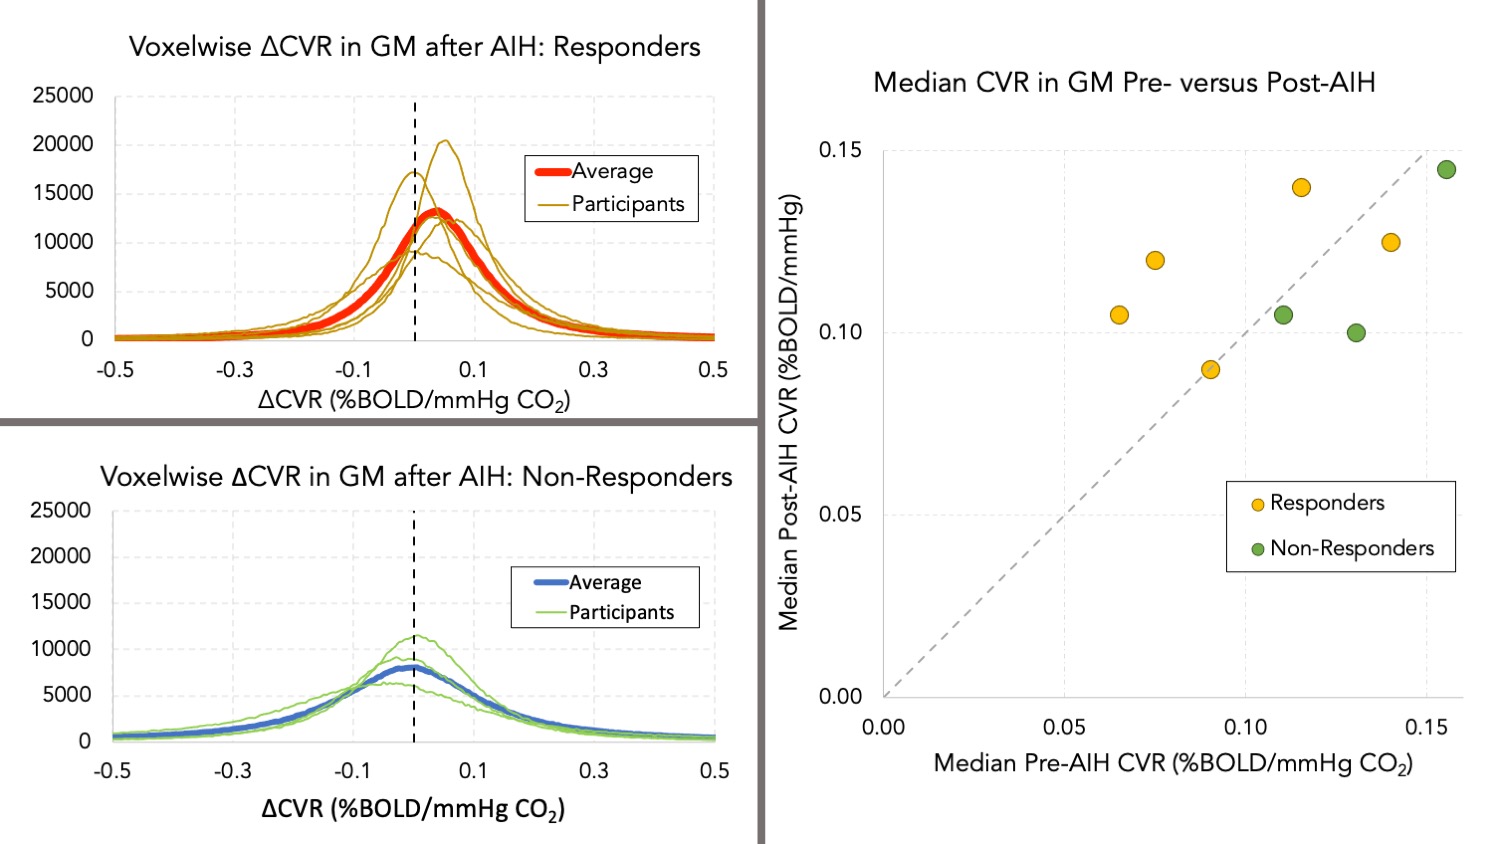
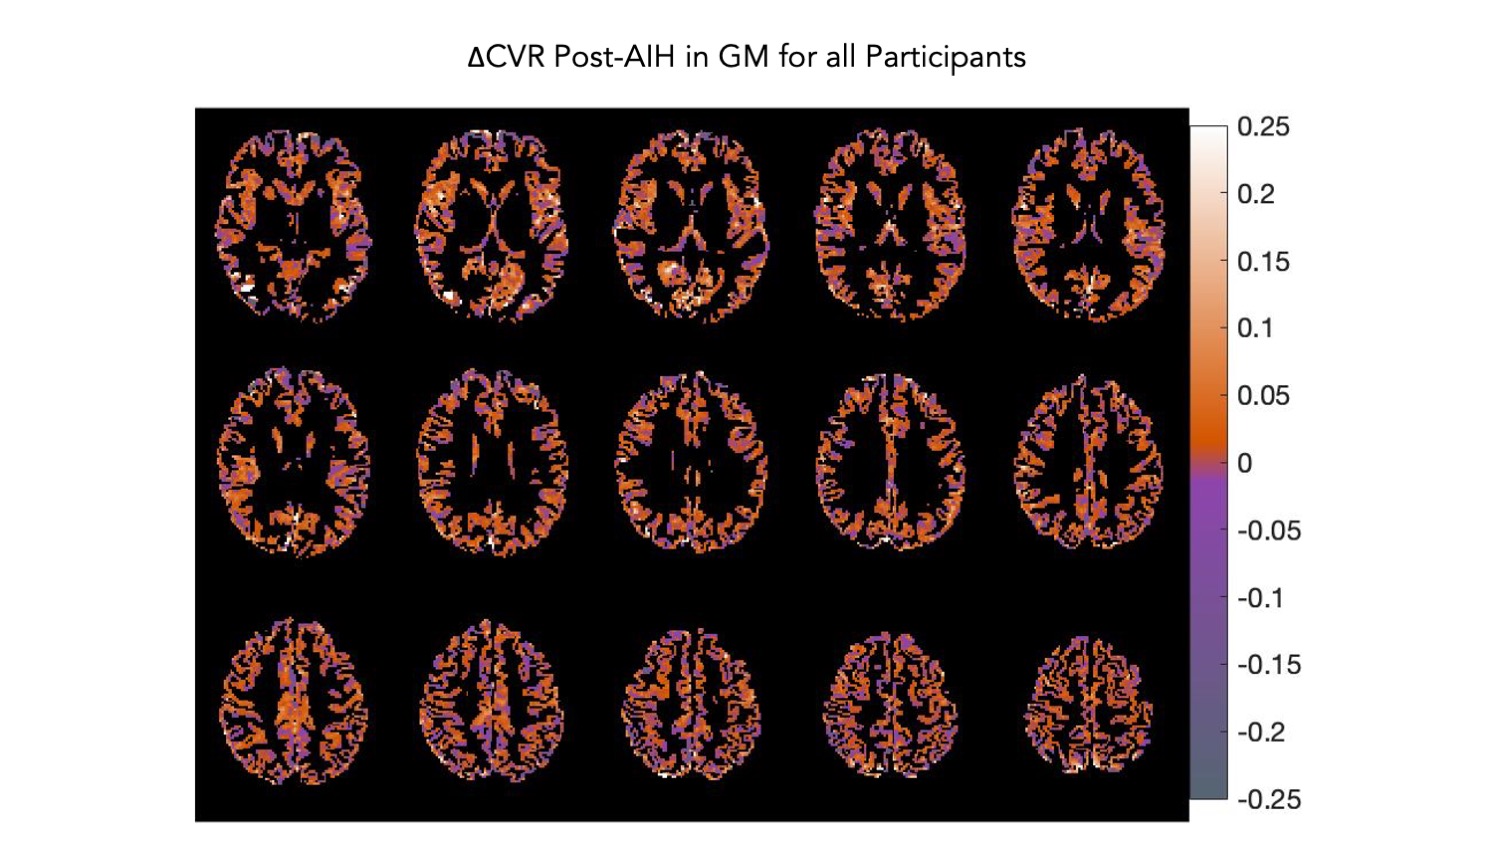
Of the 8 participants, 3 did not reach the targeted SpO2 change associated with the hypoxic gas inhalation during AIH, and were labeled “non-responders”. Mode voxelwise CVR was increased by +0.048±0.046 %BOLD/mmHg CO2 in those who achieved the targeted SpO2 drop (“responders”) and decreased by -0.034±0.048 %BOLD/mmHg CO2 in the non-responder group. Median GM CVR increased in 3 of 5 responders but did not increase in the remaining participants. Individual voxelwise and median CVR changes are shown in Figure 3. There was a small positive change in group-averaged ΔCVR (median increase of 0.01±0.066 %BOLD/mmHg CO2). Figure 4 illustrates a selection of slices from the ΔCVR map.Conclusions
Increased GM CVR was noted in some participants who achieved the targeted decreases in SpO2 during the AIH intervention, however, the small sample size precludes knowing if such CVR changes are significant and meaningful. It should be noted that changes in CVR could be due to participant fatigue or training effects from multiple scanning sessions on the same day. Continued study and expanded sample sizes are warranted, to better characterize and interpret how AIH impacts vascular physiology and the role these effects play in the clinical benefits that have been observed with therapeutic AIH in a range of rehabilitation settings.Acknowledgements
This work was supported by the Craig H. Neilsen Foundation (595499)References
1. Mallet RT, Manukhina EB, Ruelas SS, Caffrey JL, Downey HF. Cardioprotection by intermittent hypoxia conditioning: evidence, mechanisms, and therapeutic potential. American Journal of Physiology-Heart and Circulatory Physiology. 2018 Aug 1;315(2):H216-32.
2. Zhang P, Downey HF, Chen S, Shi X. Two-week normobaric intermittent hypoxia exposures enhance oxyhemoglobin equilibrium and cardiac responses during hypoxemia. American Journal of Physiology-Regulatory, Integrative and Comparative Physiology. 2014 Sep 15;307(6):R721-30.
3. Haider T, Casucci G, Linser T, Faulhaber M, Gatterer H, Ott G, Linser A, Ehrenbourg I, Tkatchouk E, Burtscher M, Bernardi L. Interval hypoxic training improves autonomic cardiovascular and respiratory control in patients with mild chronic obstructive pulmonary disease. Journal of hypertension. 2009 Aug 1;27(8):1648-54.
4. Sandhu MS, Perez MA, Oudega M, Mitchell GS, Rymer WZ. Efficacy and time course of acute intermittent hypoxia effects in the upper extremities of people with cervical spinal cord injury. Experimental Neurology. 2021 Apr 28:113722.
5. Lovett-Barr MR, Satriotomo I, Muir GD, Wilkerson JE, Hoffman MS, Vinit S, Mitchell GS. Repetitive intermittent hypoxia induces respiratory and somatic motor recovery after chronic cervical spinal injury. Journal of Neuroscience. 2012 Mar 14;32(11):3591-600.
6. Hayes HB, Jayaraman A, Herrmann M, Mitchell GS, Rymer WZ, Trumbower RD. Daily intermittent hypoxia enhances walking after chronic spinal cord injury: a randomized trial. Neurology. 2014 Jan 14;82(2):104-13.
7. Puri S, Panza G, Mateika JH. A comprehensive review of respiratory, autonomic and cardiovascular responses to intermittent hypoxia in humans. Experimental Neurology. 2021 Mar 27:113709.
8. Cohen ZV, Bonvento G, Lacombe P, Hamel E. Serotonin in the regulation of brain microcirculation. Progress in neurobiology. 1996 Nov 1;50(4):335-62.
9. Pinto J, Bright MG, Bulte DP, Figueiredo P. Cerebrovascular reactivity mapping without gas challenges: a methodological guide. Frontiers in Physiology. 2021 Jan 18;11:1711.
10. Stickland RC, Zvolanek KM, Moia SC, Ayyagari A, Caballero-Gaudes C, Bright MG. A practical modification to a resting state fMRI protocol for improved characterization of cerebrovascular function. bioRxiv. 2021 Jan 1.
11. Jenkinson M, Beckmann CF, Behrens TE, Woolrich MW, Smith SM. Fsl. Neuroimage. 2012 Aug 15;62(2):782-90.
12. Smith SM. Fast robust automated brain extraction. Human brain mapping. 2002 Nov;17(3):143-55.
13. Zhang, Y. and Brady, M. and Smith, S. Segmentation of brain MR images through a hidden Markov random field model and the expectation-maximization algorithm. IEEE Trans Med Imag, 20(1):45-57, 2001.
14. Cox RW. AFNI: software for analysis and visualization of functional magnetic resonance neuroimages. Computers and Biomedical research. 1996 Jun 1;29(3):162-73.
Figures