1674
Neuronal modulation in cerebrovascular reactivity measurements using a breath-hold task: a simultaneous EEG-fMRI study1ISR-Lisboa and Department of Bioengineering, Instituto Superior Técnico – Universidade de Lisboa, Lisboa, Portugal, 2Learning Health, Hospital da Luz, Lisboa, Portugal, 3Neurology Department, Hospital da Luz, Lisboa, Portugal, 4ISR-Lisboa and Department of Bioengineering, Instituto Superior Técnico – Universidade de Lisboa, Lisbon, Portugal
Synopsis
fMRI can be used to assess cerebrovascular reactivity by measuring BOLD changes during a breath hold task. This is assumed to be isometabolic so that BOLD changes cannot be attributed to neuronal activity. We performed simultaneous EEG-fMRI recordings during a breath-hold task to assess to what extent neuronal activity retrieved from the EEG may contribute to explain the BOLD signal variance that is usually interpreted as reactivity. We found that neuronal modulation measured by EEG band power did not explain significantly more BOLD variance across GM than PetCO2 changes, indicating that the associated fMRI measurements truly reflect cerebrovascular reactivity.
Introduction
Cerebrovascular reactivity (CVR) may be studied using blood oxygenation level dependent (BOLD) functional MRI (fMRI) performed during a vasoactive challenge, such as a breath-hold task, which induces hypercapnia1. By leading to an increase in the arterial blood partial pressure of carbon dioxide (pCO2), it causes vasodilation and an increase of cerebral blood flow that is captured by the BOLD signal. In this context, vasoactive challenges are assumed to be isometabolic, so that BOLD changes cannot be attributed to neuronal activity. However, this assumption may be questioned, especially in the case of the execution of voluntary tasks such as breath holding. If neuronal modulation is associated with the task, then reactivity may be misinterpreted. Two previous studies have found a link between the levels of end-tidal pCO2 (PETCO2) and neuronal activity, as measured with magnetoencephalography (MEG)2 and electroencephalography (EEG)3 in terms of the power in several frequency bands. However, a direct comparison with simultaneous BOLD-fMRI signals has not been reported. Here, we perform simultaneous EEG-fMRI recordings during a breath-hold task to assess to what extent neuronal activity retrieved from the EEG may contribute to explain the BOLD signal variance that is usually interpreted as reactivity.Methods
EEG-fMRI data was acquired from 7 healthy female subjects during a breath-hold task, comprising 4 cycles of 15s breath-hold (BH) after exhalation, followed by exhalation and a free breathing recovery period, alternated with 30s periods of paced natural breathing (PNB), with 3-4 cycles/min (total~4.5min). The PNB breathing period was defined based on a recording of spontaneous breathing for each subject, prior to the experiment.BOLD-fMRI was acquired on a 3T Siemens Vida system with a 64-channel head RF coil using 2D-EPI (TR/TE=1260/30ms, in-plane GRAPPA-2, SMS-3, 60 slices, 2.2mm isotropic resolution). Expired CO2, used to retrieve the partial pressure of end-tidal CO2 (PETCO2), was measured using the Medlab CAP10 capnograph and a nasal cannula. Respiratory signal was acquired at 400Hz using the integrated BioMatrix Sensors. EEG was acquired using the 32-channels MR-compatible EEG system (Brain Products) at 5000Hz.
fMRI images were analysed using FSL4 including: distortion and motion correction, and high-pass temporal filtering. Rigid body motion parameters and motion outliers were extracted. A grey matter (GM) mask was obtained by segmentation of an MPRAGE structural image, and the average percent BOLD signal change in GM was computed for each subject.
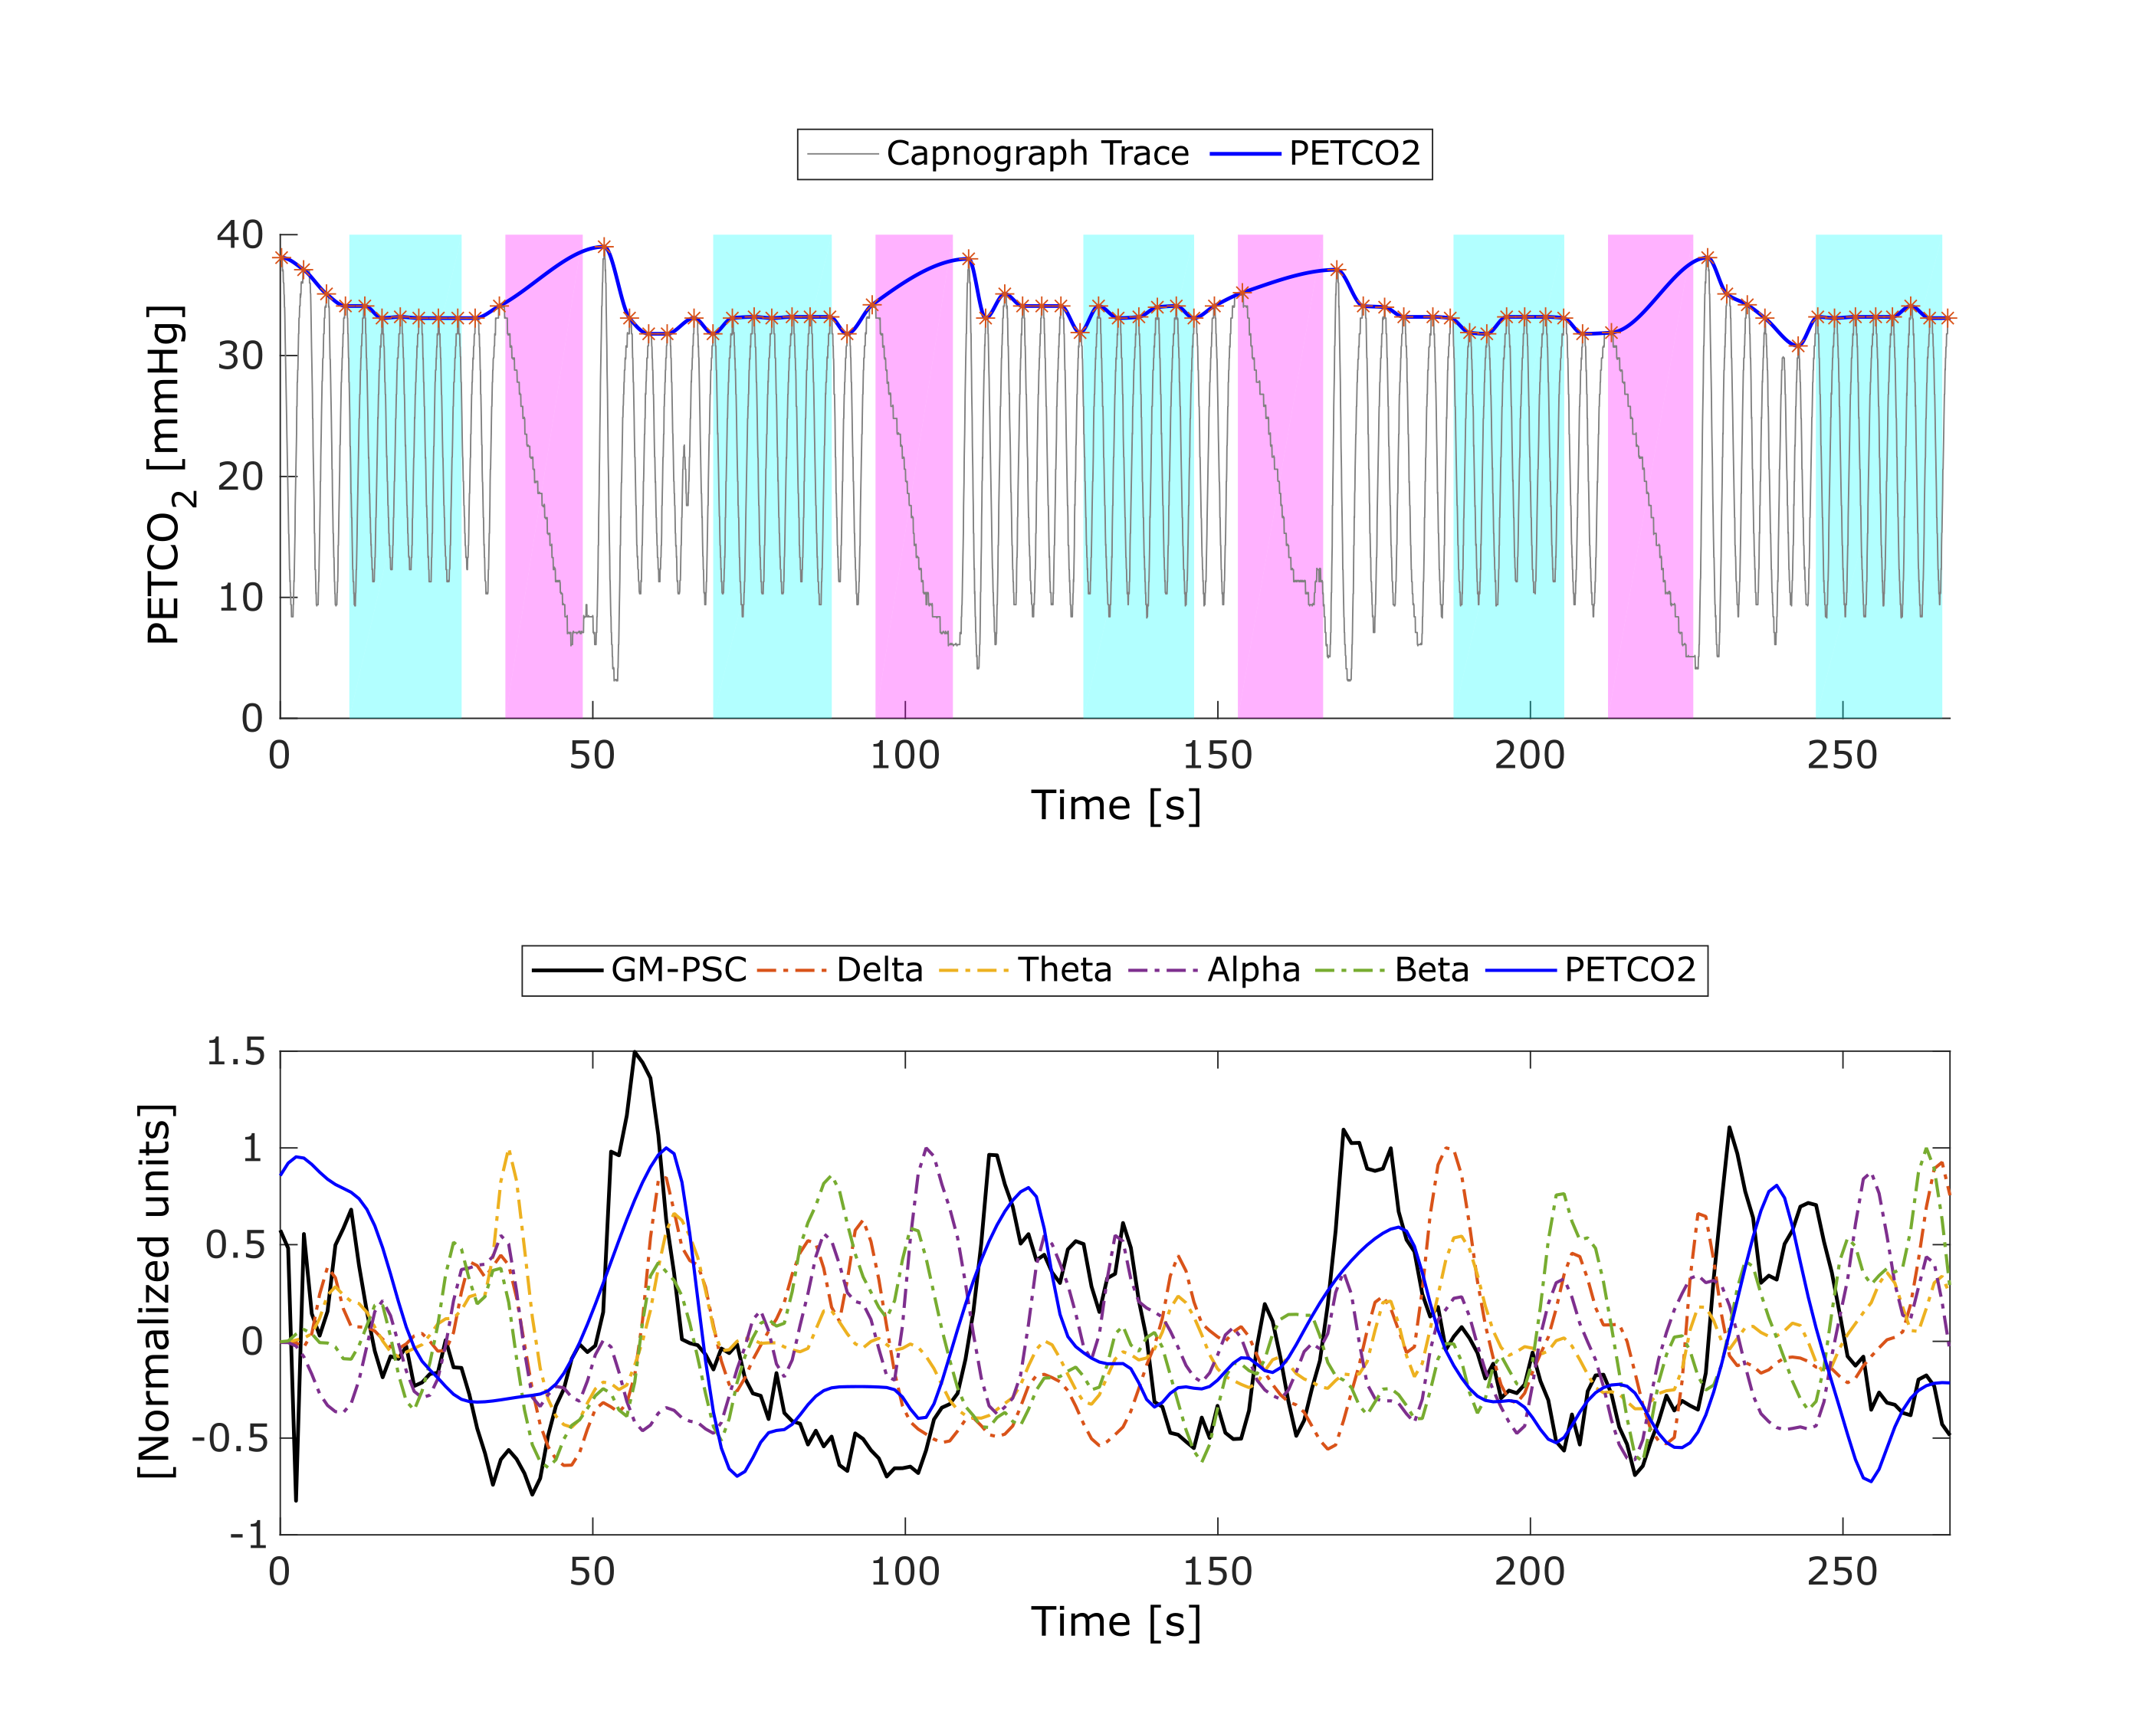
PETCO2 was obtained by peak detection of the capnograph trace, convolved with the canonical HRF, time-shifted by the optimal lag found by cross-correlation with the GM average BOLD signal and downsampled to the TR.
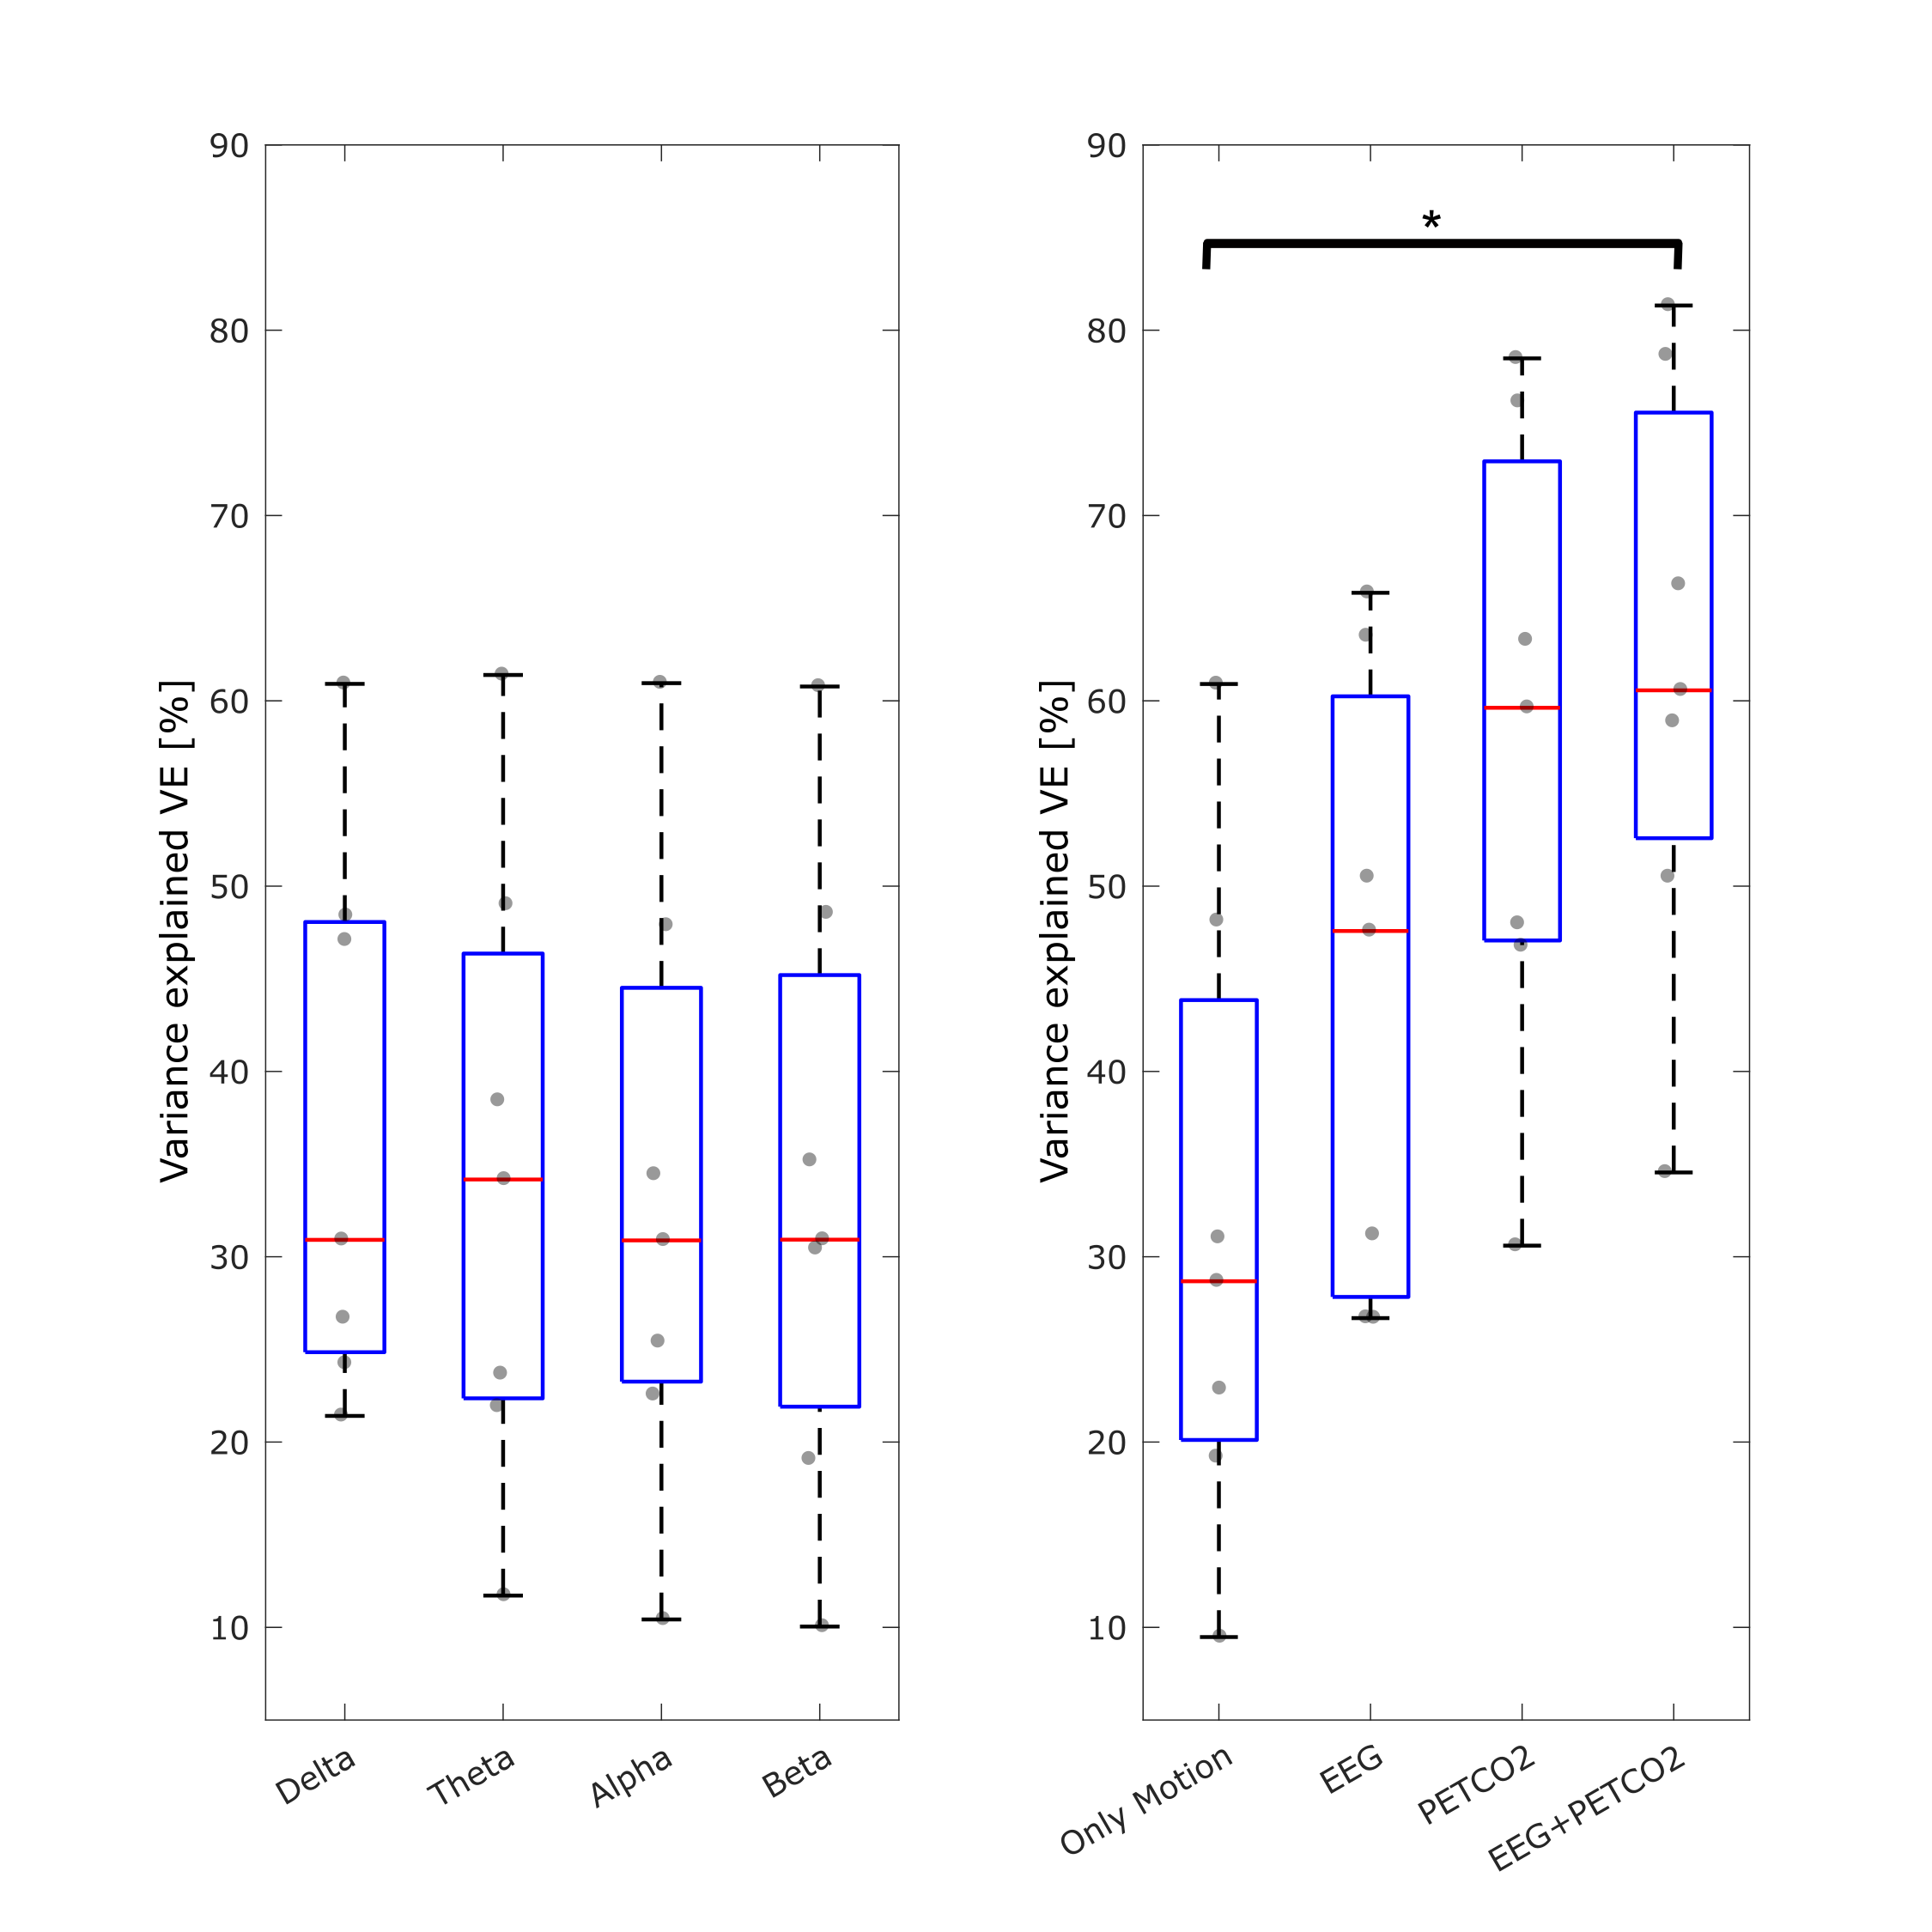
EEG data were analysed using Matlab, including: correction for gradient and pulse artifacts5, downsampling to 250 Hz, bandpass filtering to 0.3-70Hz, robust re-referencing, ICA denoising, and additional denoising through interpolation when exceeding mean±4xSD for each channel. The band power for PNB and BH periods, as well as for the whole task time-course, was extracted for the delta (1-4 Hz), theta (4-8 Hz), alpha (8-12 Hz) and beta (12-30 Hz) bands. The band power time-courses were normalized, convolved with the canonical HRF and downsampled to the TR. The following general linear models were fitted to the GM average BOLD signal: 1) MP only; 2) MP+EEG; 3) MP+PETCO2; 4) MP+PETCO2+EEG. The variance explained (VE) was computed for each model. Statistical analyses were performed using JASP6 and Matlab.
Results
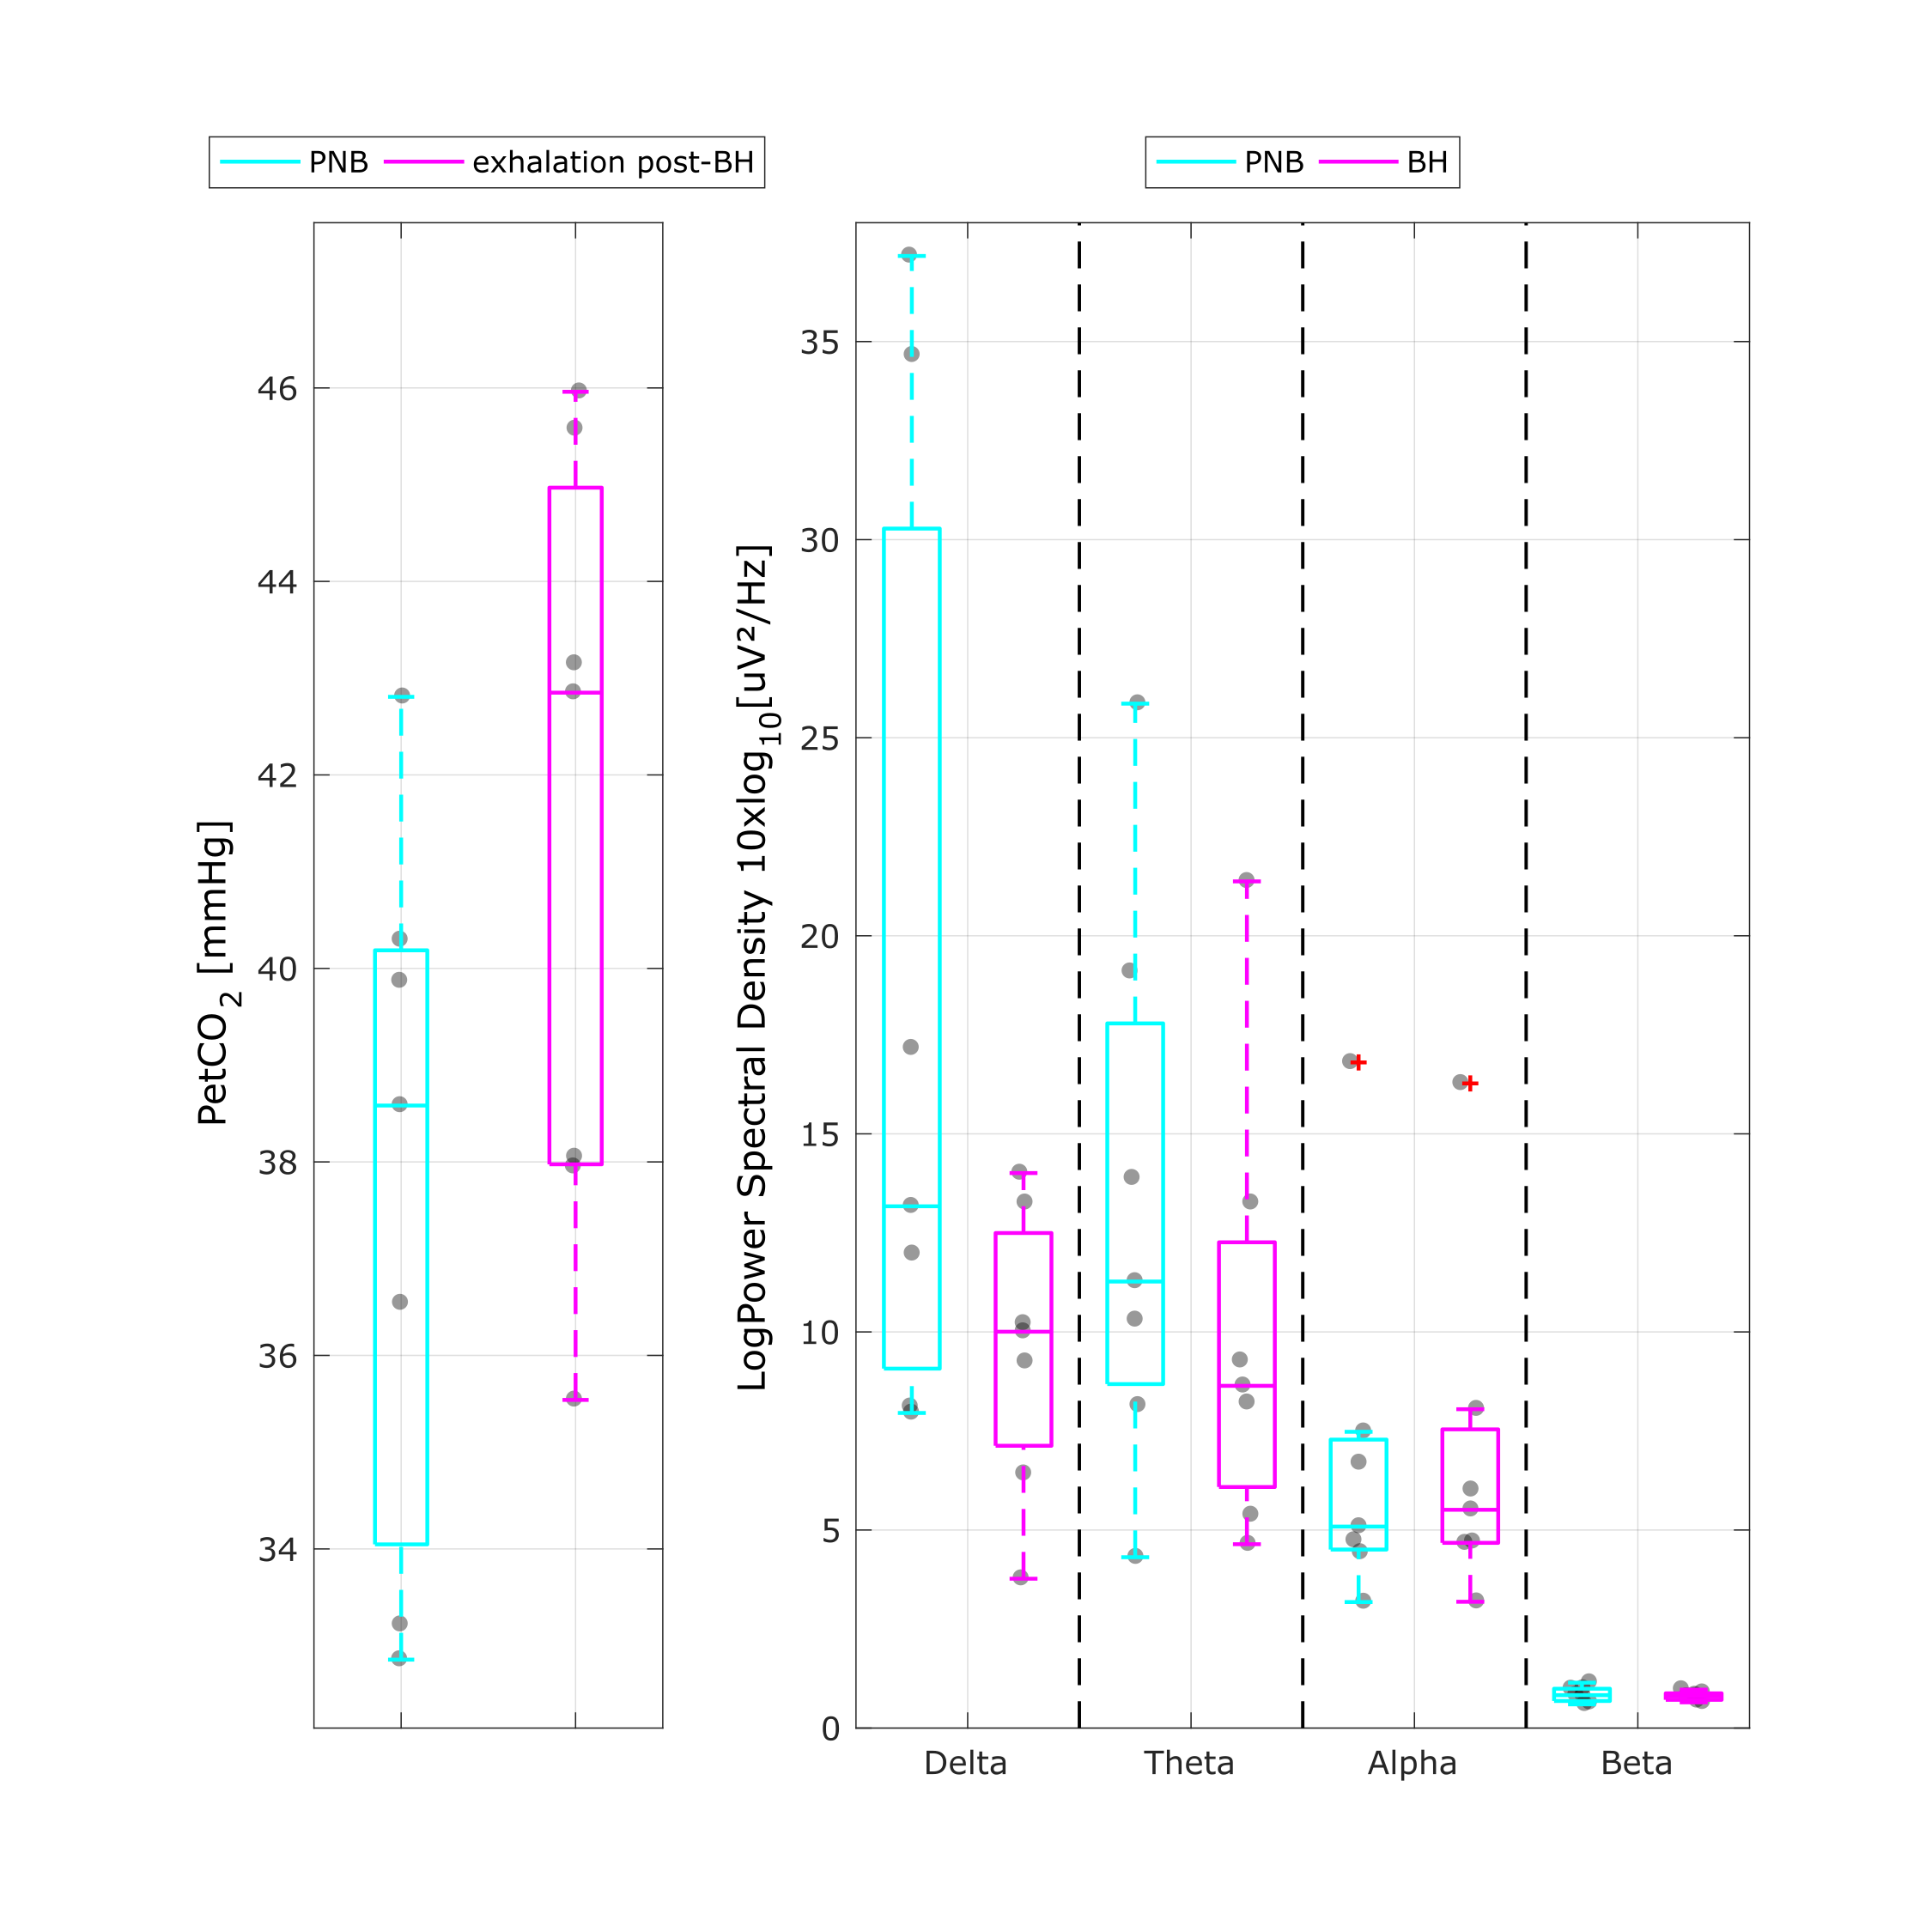
An illustrative example is shown in Fig.1 for the PETCO2 trace during the breath hold task, as well as the GM BOLD signal and corresponding PETCO2 and EEG regressors. The group results for the PETCO2 and the EEG band power during the BH and PNB conditions are presented in Fig.2. With BH, an increase in PETCO2 is found, as expected (median △PETCO2 = 4.57mmHg, interquartile range = 2.00mmHg), and slight decreases in delta and theta EEG power are observed, though they are not significant (Friedman test, Conover's Post-Hoc comparisons). The group results of the VE for each model are presented in Fig.3. VE increased with PETCO2 regressor, but no additional increases were found with EEG regressors.Discussion and conclusion
We measured EEG simultaneously with fMRI during a breath hold task in a group of healthy subjects. Mild hypercapnia was achieved by most subjects and associated BOLD changes were measured across GM. We found that neuronal modulation measured by EEG band power did not explain significantly more BOLD variance on average across GM than PETCO2 changes, indicating that the associated fMRI measurements truly reflect cerebrovascular reactivity. We could not find significant band power modulations with hypercapnia as previously reported2, although trends for a reduction in delta and theta power could be observed. This may be due to the small sample size in our study, or the paradigm differences. In fact, a graded hypercapnia paradigm was used by administering external gases, while we employed a breath hold task. Further work will investigate whether different EEG features may explain local BOLD changes in specific brain areas.Acknowledgements
We acknowledge the Portuguese Science Foundation through grants PTDC/EMD-EMD/29675/2017, LISBOA-01-0145-FEDER-029675 and UIDB/50009/2020.References
1. Pinto et al., Front Physiol. 2021 Jan 18;11:608475. doi: 10.3389/fphys.2020.608475
2. Driver et al., The Journal of Neuroscience, August 17, 2016; 36(33):8541– 8550. doi: 10.1523/JNEUROSCI.4263-15.2016
3. Morelli et al., Scientific Reports. 2018. 8, 4492. doi: 10.1038/s41598-018-22573-6
4. FSL (https://www.fmrib.ox.ac.uk/fsl)[Computer software]
5. Niazy et al., NeuroImage, 2005. 28, no. 3, pp. 720–37. doi: 10.1016/j.neuroimage.2005.06.067
6. JASP Team (2020). JASP (Version 0.14)[Computer software]
Figures