1673
Respiration volume per time (RVT) as a surrogate for end-tidal CO2 to map hemodynamic lag with BOLD fMRI1Physical Therapy and Human Movement Sciences, Northwestern University, Chicago, IL, United States, 2Biomedical Engineering, Northwestern University, Evanston, IL, United States, 3Basque Center on Cognition, Brain and Language, Donostia, [Gipuzkoa], Spain
Synopsis
Using a breath-hold task to modulate end-tidal CO2 during a BOLD fMRI scan is an established method to map hemodynamic lag. However, end-tidal CO2 measurements may not be reliable in less compliant subjects and require additional monitoring equipment. We investigated whether a related metric, respiration volume per time (RVT) can be used as a surrogate for end-tidal CO2 by directly comparing the lag values derived from each physiological measurement. Similar spatial variation was observed in healthy adult participants, albeit with some degree of proportional bias, indicating respiration belt data can be used as an alternative to map hemodynamic lag.
Introduction
Hemodynamic lag describes the timing of the brain's blood flow response to a vasoactive stimulus1–5. Lag can be altered by pathology (e.g., stroke6, intracranial stenosis1, and sickle cell disease7), positioning it as a potential metric to assess cerebrovascular health. There are several ways to measure hemodynamic lag1,8–10; one with growing attention is a breath-holding task which increases arterial CO2 (a potent vasodilator11), stimulating an increase in cerebral blood flow that can be measured with BOLD fMRI. Previous studies have described how end-tidal CO2 (PETCO2) sampled via nasal cannula can be incorporated in a generalized linear model (GLM) to quantify hemodynamic lag12. However, PETCO2 recordings are unreliable if participants fail to exhale through their nose before and after the breath-hold (BH), common in less-compliant cohorts (e.g. children13). Under these circumstances, an alternative measure of the subject’s BH task performance would be useful. Here, we propose to use respiration volume per time (RVT), which quantifies changes in chest position via a belt around the chest, as a surrogate measure for PETCO2. Previous studies show PETCO2 and RVT are highly correlated14–16 and fluctuations in RVT are associated with delayed global fluctuations in the BOLD timeseries17. Therefore, we investigated whether RVT can be used as a surrogate for PETCO2 to assess leg in BH fMRI data.Methods
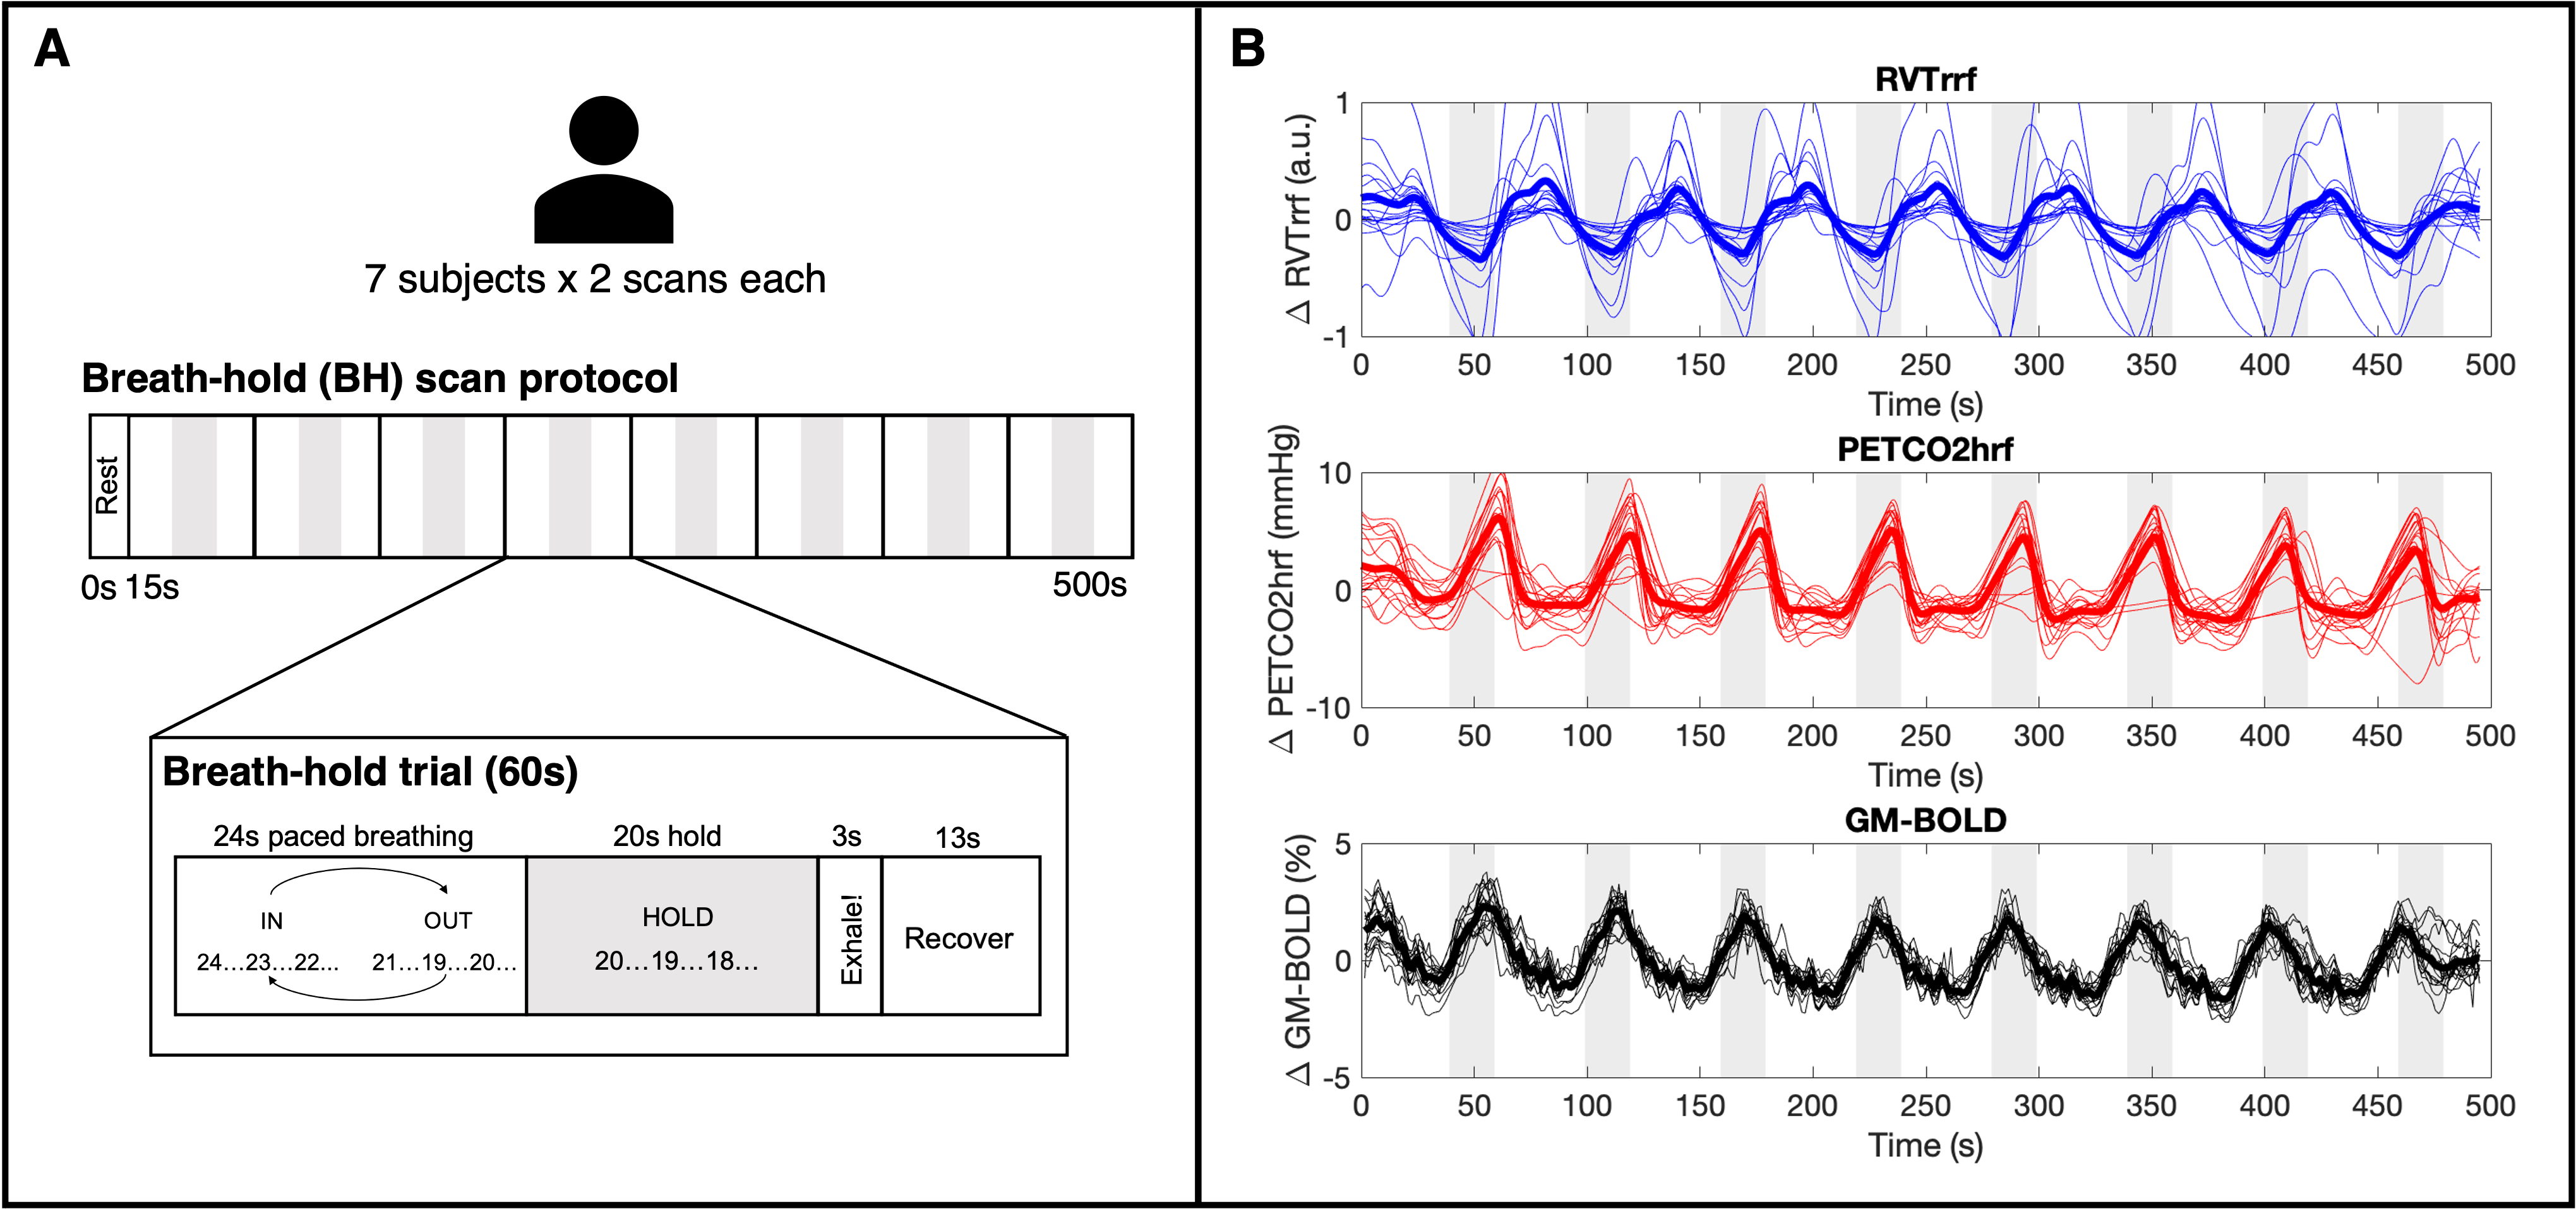
Data: 7 healthy subjects (4F, 25-40y) underwent 10 MRI sessions in a 3T Siemens PrismaFit scanner as previously described18,19. Only sessions 2 and 3 were used in this analysis to capture consecutive scans with good data quality in all subjects, specifically, the multi-echo fMRI acquisition during a BH task (340 scans, TR=1.5s, TEs=10.6/28.69/46.78/64.87/82.96ms, MB factor=4, GRAPPA=2, resolution=2.4×2.4×3mm3). The BH paradigm is described in Fig1A. PETCO2 was recorded via nasal cannula and gas analyzer (ADInstruments) and chest position via respiration belt (BIOPAC), both at 10kHz.Preprocessing: Multi-echo fMRI data were co-registered to the first echo single-band reference image and optimally combined20,21. Physiological signals were downsampled to 40Hz. Maximums and minimums in the respiration trace were used to compute respiration volume per time (RVT)17, which was convolved with the respiration response function (RVTrrf)22. PETCO2 was convolved with a canonical HRF (PETCO2hrf).
Lag Analysis: Voxelwise hemodynamic lags were computed using a lagged-GLM framework12,13,18, with either PETCO2hrf and RVTrrf as regressors of interest. PETCO2hrf and RVTrrf were shifted to maximize cross-correlation with the up-sampled average gray matter (GM) timeseries, then 60 shifted variants of each regressor were created (±9s, in 0.3s increments). fMRI data were modelled by polynomial drift terms, 6 motion parameters and derivatives, and the PETCO2hrf or RVTrrf timeseries. This was repeated for shifted variants of the PETCO2hrf and RVTrrf regressors, with lag (seconds) determined as the shift with the highest model R2 in each voxel.
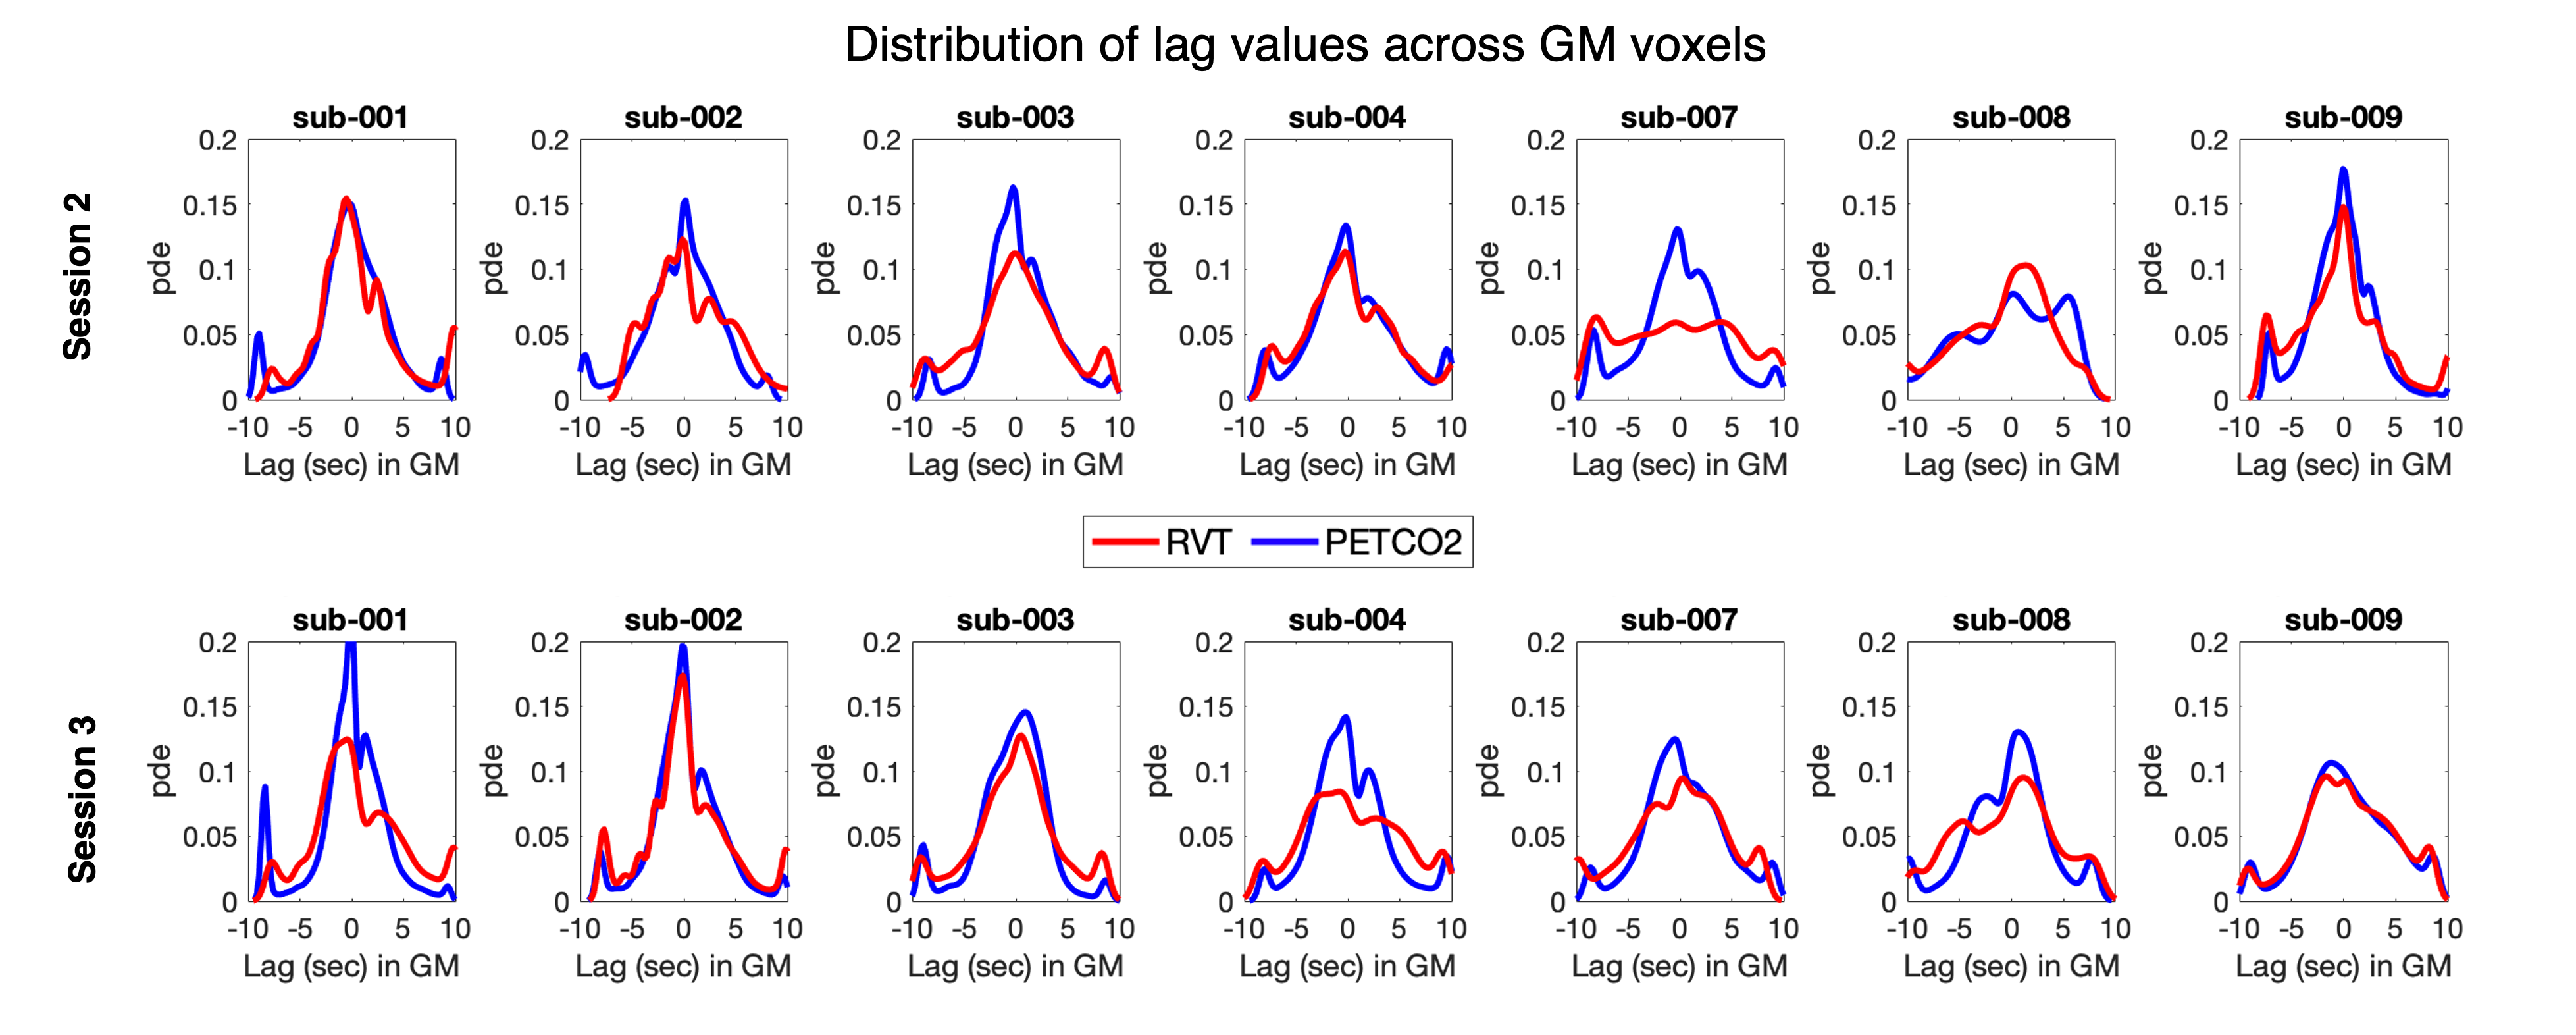
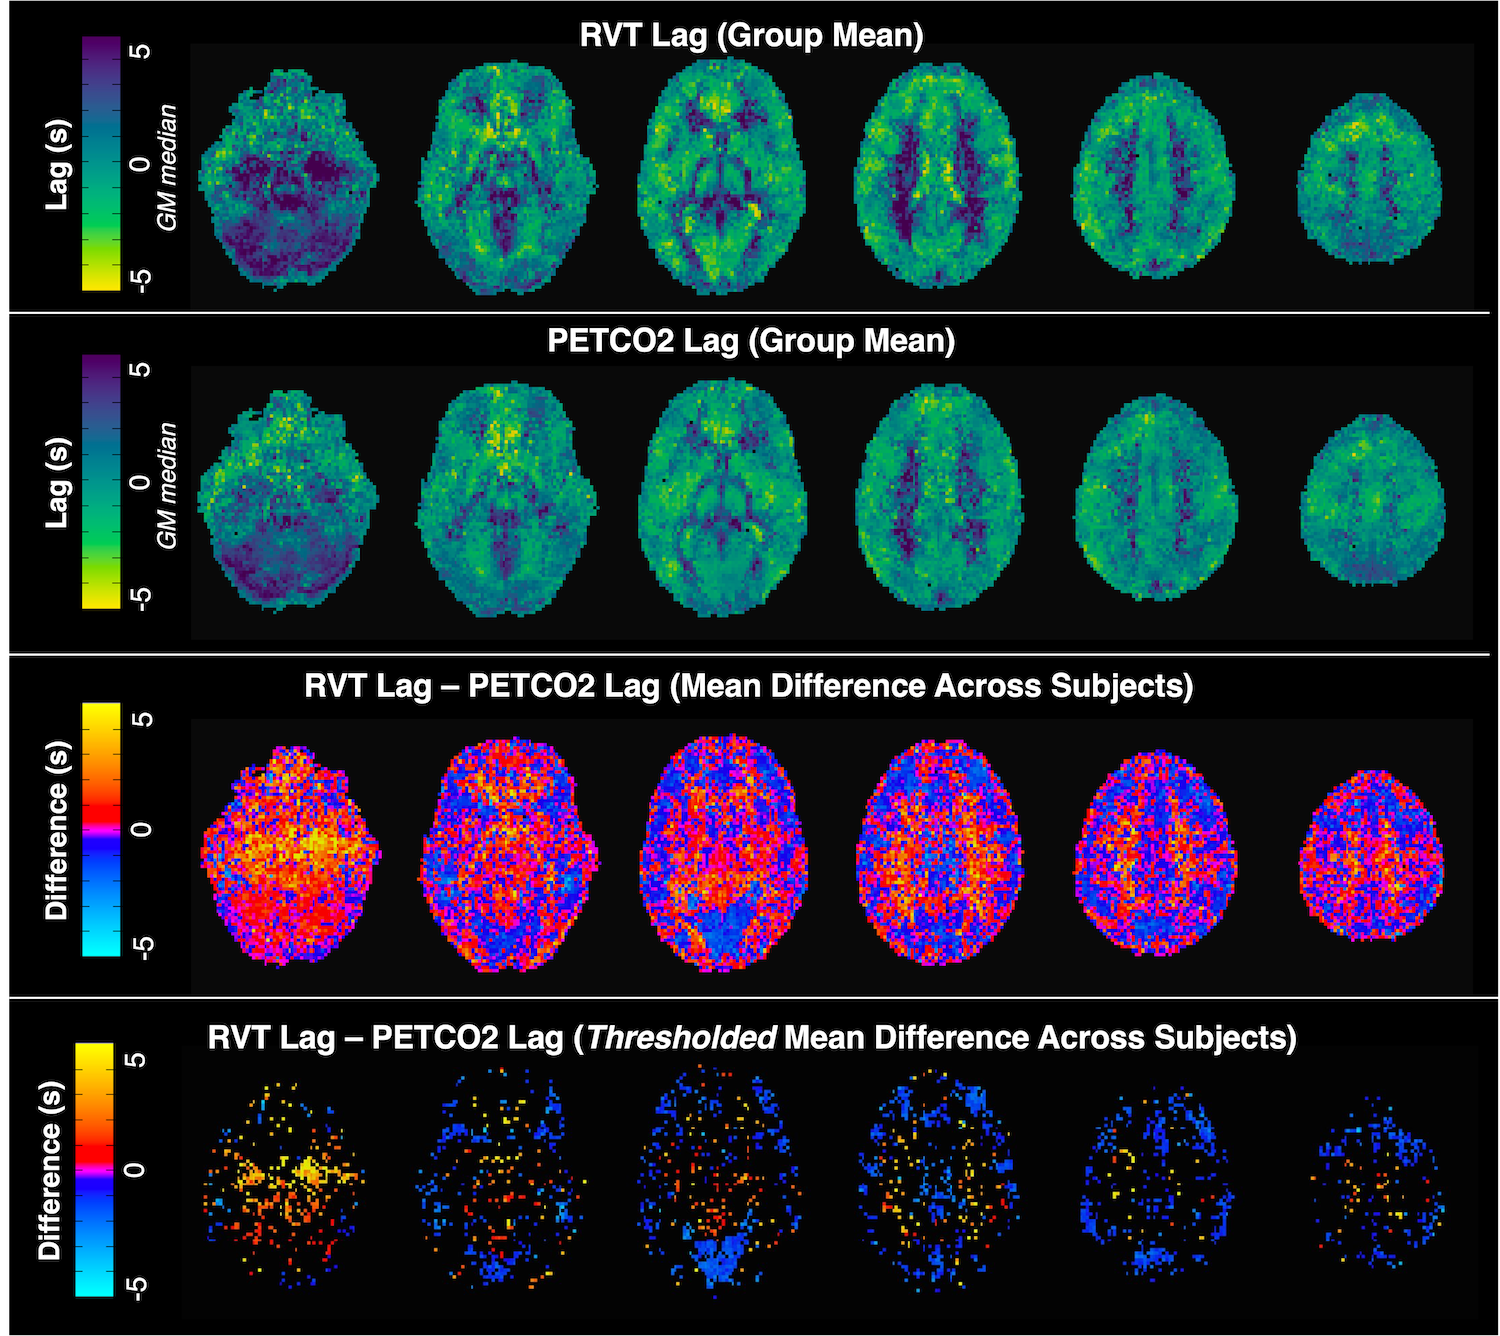
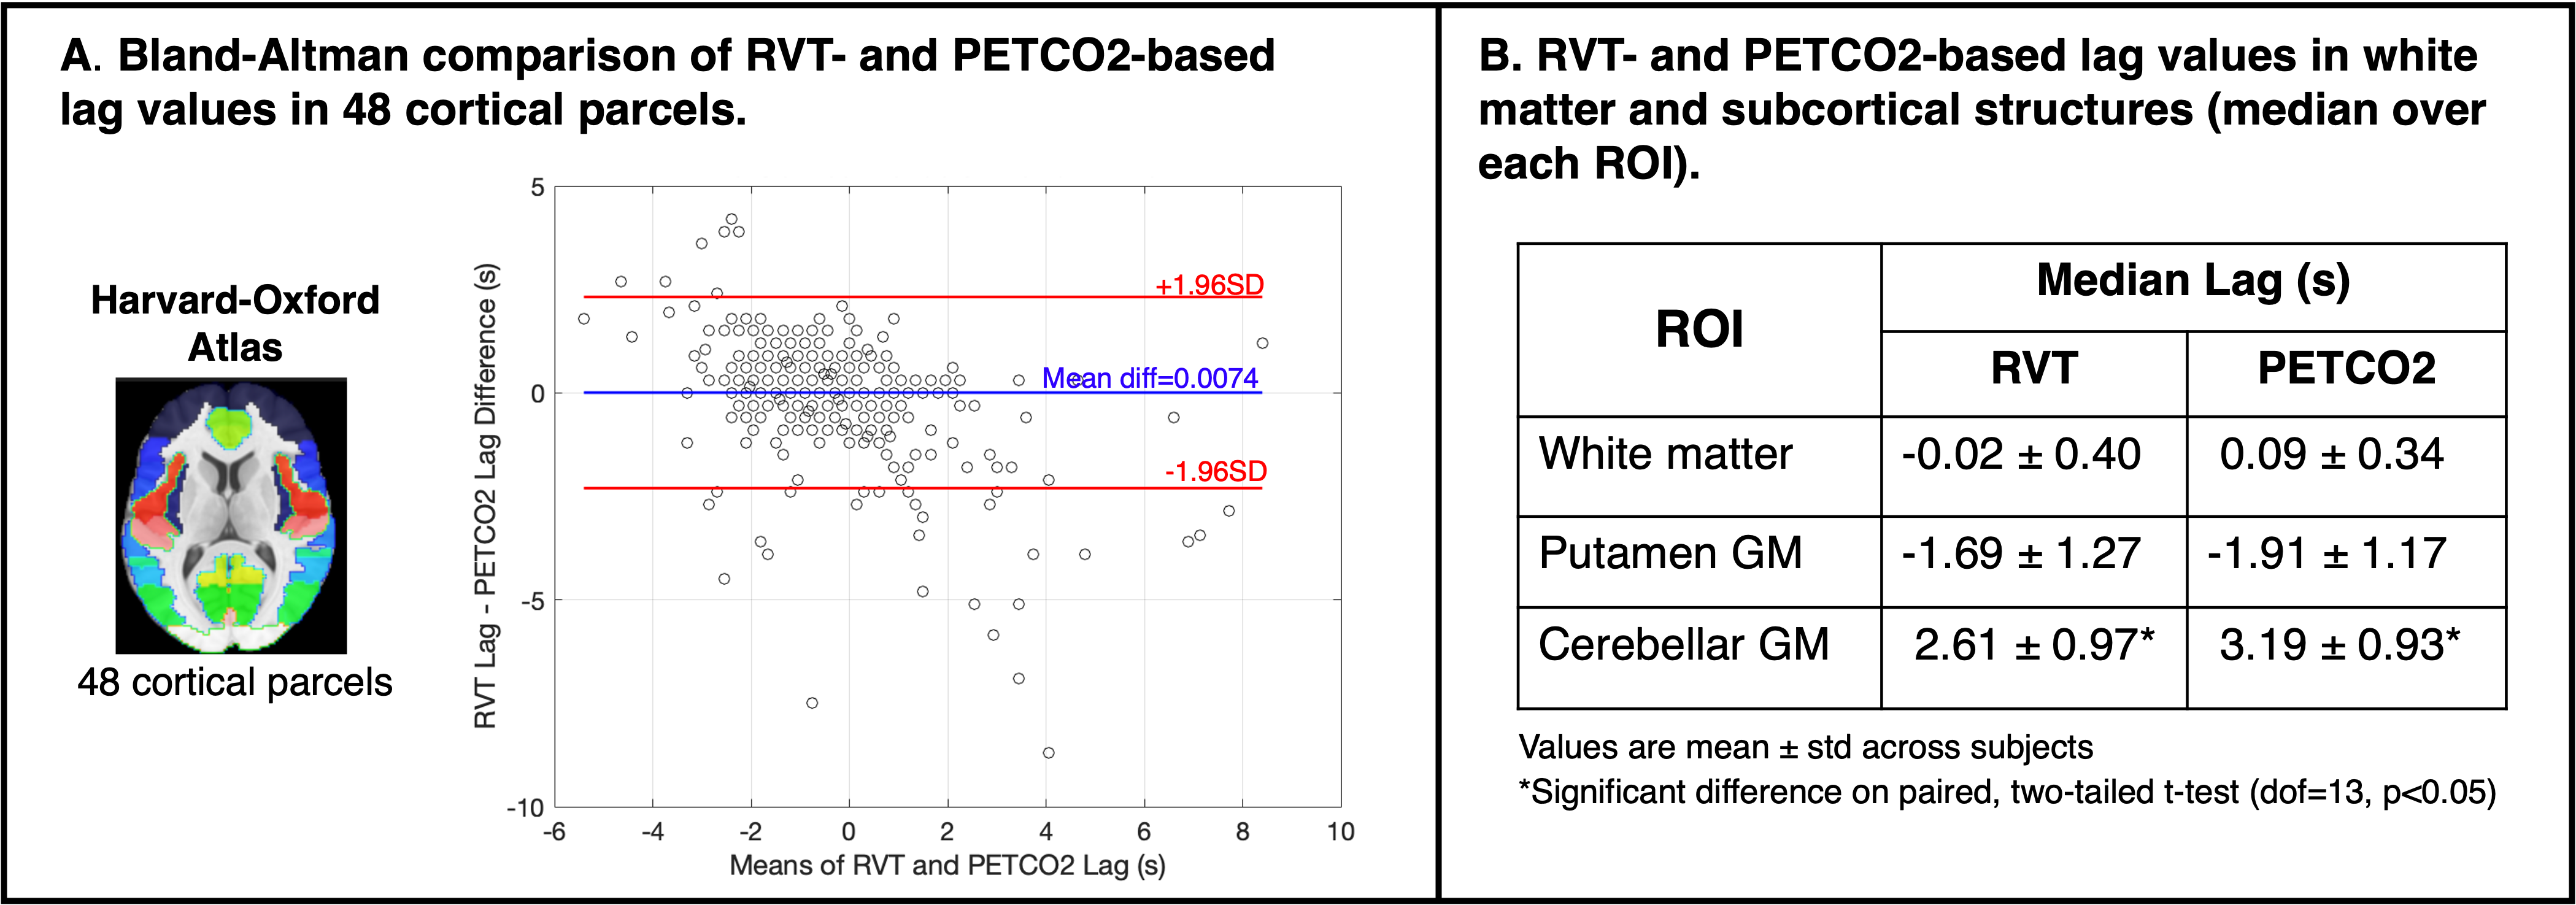
RVT-PETCO2 Comparisons: All lag maps were recentered to the median GM lag. For each subject, session, and regressor (RVTrrf or PETCO2hrf), the kernel density estimation of lag values in GM was computed. Subject lag maps were transformed to MNI space and group-mean differences in RVT-based and PETCO2-based lag calculated. Bland-Altman analysis quantified agreement between median PETCO2-based and RVT-based lag values across 48 cortical parcels (Harvard-Oxford cortical atlas23). To assess agreement in subcortical regions, three additional ROIs were created (white matter, putamen GM, and cerebellum GM24) and median PETCO2-based and RVT-based lags were extracted for each subject; paired t-tests assessed statistical differences.
Results
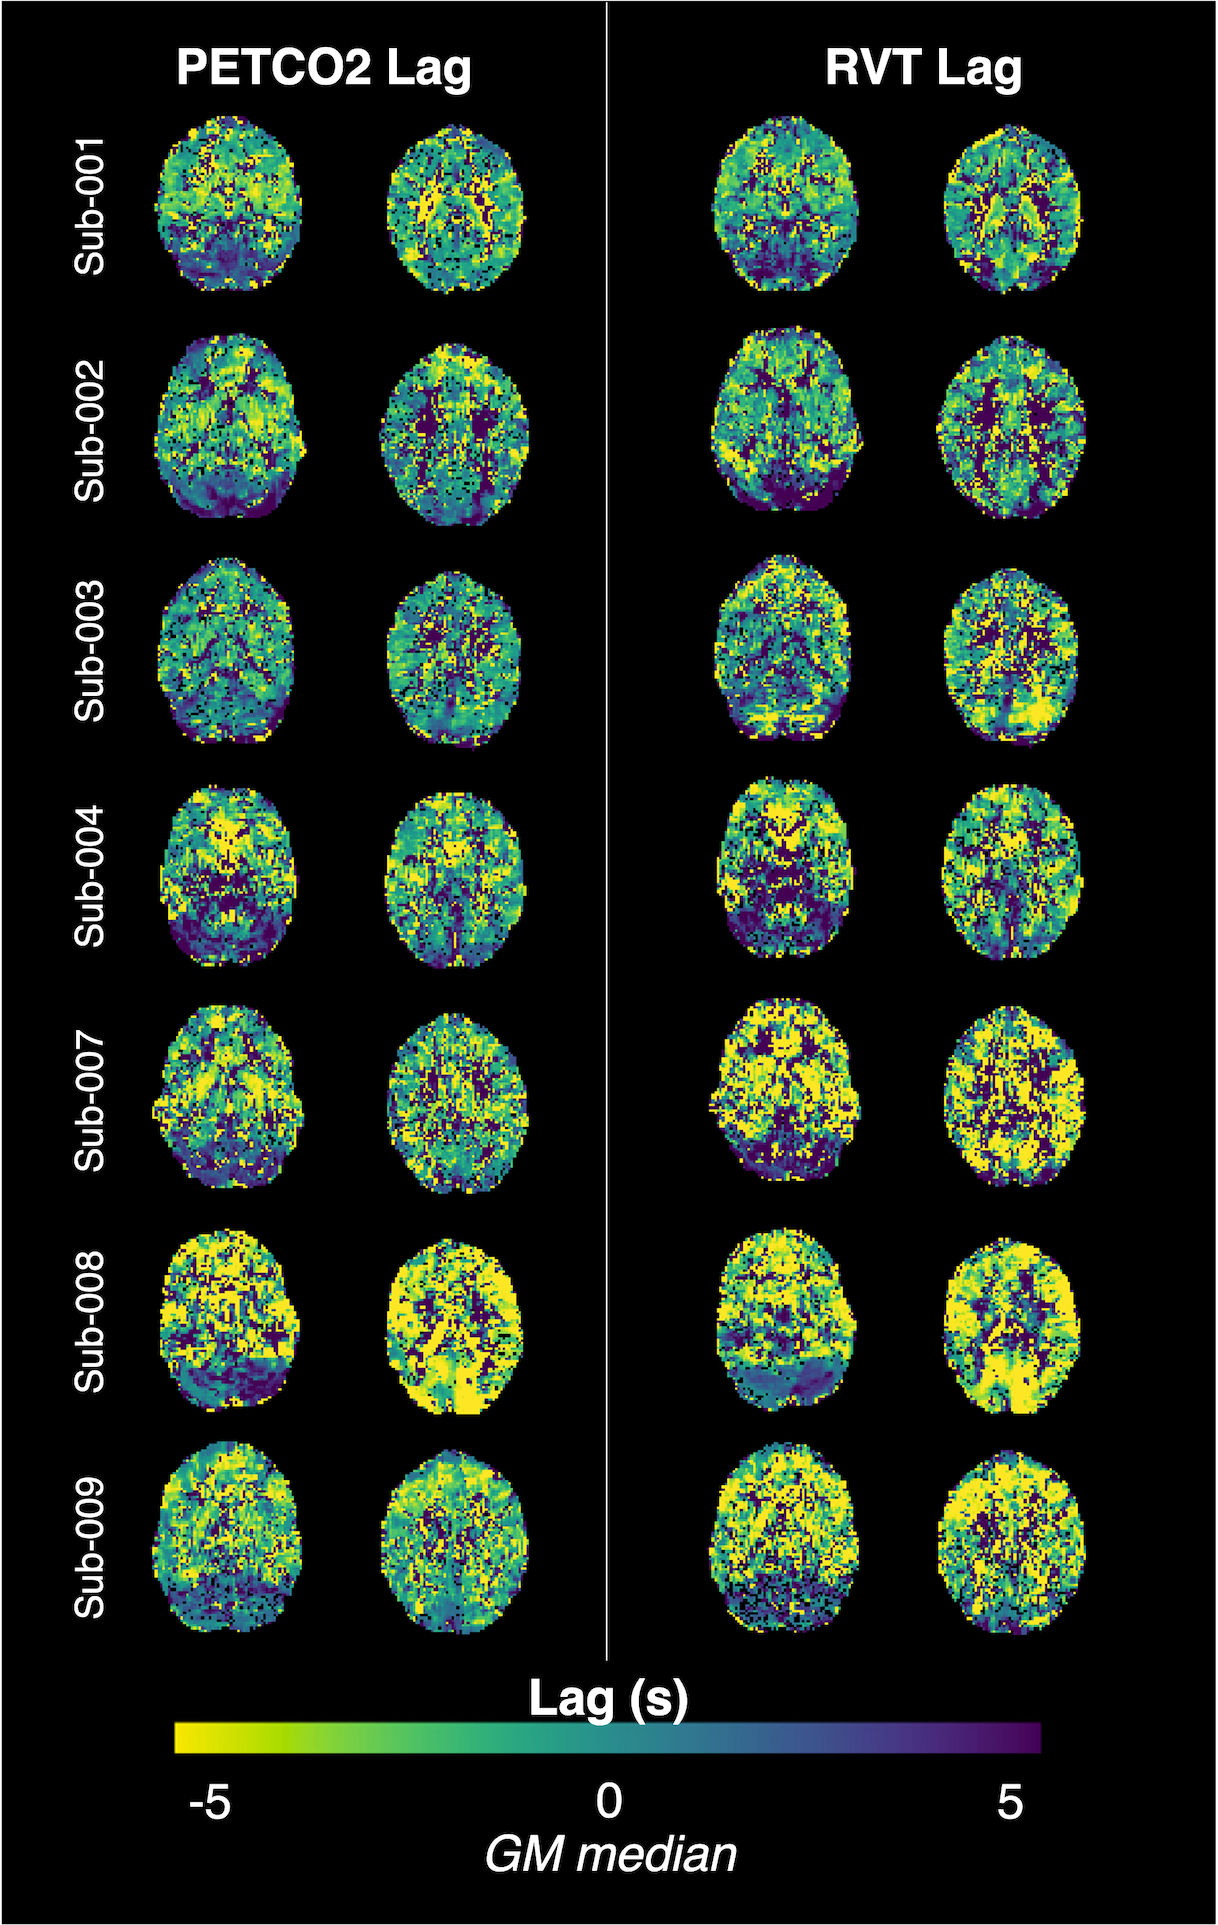
PETCO2hrf and average GM BOLD signal increased during each BH cycle, while RVTrrf decreased (Fig1B), as expected. Individual RVT-based lag maps are physiologically plausible and show similar spatial variation to PETCO2-based maps (early response in GM and later response in posterior structures, Fig2). The distribution of lag across GM is also comparable for RVT-based and PETCO2-based measurements (Fig3). Group-mean maps show small differences throughout most of the brain, with larger differences in the inferior temporal lobe (Fig4). Mean differences between RVT-based and PETCO2-based lag across 48 cortical parcels were not significant based on a one-sample t-test (p=0.87), indicating no significant bias (Fig5A). However, there is a negative trend demonstrating a larger difference in RVT and PETCO2-based measurements for regions with more extreme lags, and particularly for longer lags. In subcortical structures, median lag values were significantly different in the cerebellum but not in the white matter or putamen (Fig 5).Discussion
RVT-based and PETCO2-based lag measures show similar spatial variation across the brain, at the subject and group level. However, RVT-based lag measures are proportionally biased, over-estimating long delays and under-estimating short delays relative to PETCO2-based measures. Although potentially artifactual, this results in improved GM/WM contrast (Fig4). Our results indicate that RVT can be used to map hemodynamic lag. This alternative method could reduce the complexity required to successfully monitor exhaled gas levels and would be especially useful when end-tidal CO2 values may be unreliable. However, caution should be exercised when interpreting absolute lag measures. In addition, unlike end-tidal CO2, RVT-based measures do not allow for quantification of the amplitude of the blood flow response (cerebrovascular reactivity) in the typical units of %BOLD/mmHg. Future work should investigate the agreement between RVT-based and PETCO2-based lag for subjects with poor BH performance and cerebrovascular pathology, and the potential for RVT-derived amplitude measurements.Acknowledgements
This research was supported by the European Union’s Horizon 2020 research and innovation program (Marie Skłodowska-Curie grant agreement No. 713673), a fellowship from La Caixa Foundation (ID 100010434, fellowship code LCF/BQ/IN17/11620063), the Spanish Ministry of Economy and Competitiveness (Ramon y Cajal Fellowship, RYC-2017- 21845), the Spanish State Research Agency (BCBL “Severo Ochoa ” excellence accreditation, SEV- 2015-490), the Basque Government (BERC 2018-2021 and PIBA_2019_104), the Spanish Ministry of Science, Innovation and Universities (MICINN; PID2019-105520GB-100 and FJCI-2017-31814). K.M.Z. was supported by an NIH-funded training program (T32EB025766).References
1. Donahue MJ, Strother MK, Lindsey KP, Hocke LM, Tong Y, Frederick BDB. Time delay processing of hypercapnic fMRI allows quantitative parameterization of cerebrovascular reactivity and blood flow delays. J Cereb Blood Flow Metab. 2016;36(10):1767-1779. doi:10.1177/0271678X15608643
2. Geranmayeh F, Wise RJS, Leech R, Murphy K. Measuring vascular reactivity with breath-holds after stroke: A method to aid interpretation of group-level BOLD signal changes in longitudinal fMRI studies. Hum Brain Mapp. 2015;36(5):1755-1771. doi:10.1002/hbm.22735
3. Sousa I, Vilela P, Figueiredo P. Reproducibility of hypocapnic cerebrovascular reactivity measurements using BOLD fMRI in combination with a paced deep breathing task. Neuroimage. 2014;98:31-41. doi:10.1016/j.neuroimage.2014.04.049
4. Tong Y, Bergethon PR, Frederick B de B. An improved method for mapping cerebrovascular reserve using concurrent fMRI and near-infrared spectroscopy with Regressor Interpolation at Progressive Time Delays (RIPTiDe). Neuroimage. 2011;56(4):2047-2057. doi:10.1016/J.NEUROIMAGE.2011.03.071
5. Murphy K, Harris AD, Wise RG. Robustly measuring vascular reactivity differences with breath-hold: Normalising stimulus-evoked and resting state BOLD fMRI data. Neuroimage. 2011;54(1):369-379. doi:10.1016/j.neuroimage.2010.07.059
6. Siegel JS, Snyder AZ, Ramsey L, Shulman GL, Corbetta M. The effects of hemodynamic lag on functional connectivity and behavior after stroke. J Cereb Blood Flow Metab. 2016;36(12):2162-2176. doi:10.1177/0271678X15614846
7. Coloigner J, Vu C, Borzage M, et al. Transient Hypoxia Model Revealed Cerebrovascular Impairment in Anemia Using BOLD MRI and Near-Infrared Spectroscopy. J Magn Reson Imaging. 2020;52(5):1400-1412. doi:10.1002/jmri.27210
8. Duffin J, Sobczyk O, Crawley AP, Poublanc J, Mikulis DJ, Fisher JA. The dynamics of cerebrovascular reactivity shown with transfer function analysis. Neuroimage. 2015;114:207-216. doi:10.1016/j.neuroimage.2015.04.029
9. Blockley NP, Harkin JW, Bulte DP. Rapid cerebrovascular reactivity mapping: Enabling vascular reactivity information to be routinely acquired. Neuroimage. 2017;159:214-223. doi:10.1016/J.NEUROIMAGE.2017.07.048
10. Tong Y, Frederick B deB. Tracking cerebral blood flow in BOLD fMRI using recursively generated regressors. Hum Brain Mapp. 2014;35(11):5471. doi:10.1002/HBM.22564
11. Pinto J, Bright MG, Bulte DP, Figueiredo P. Cerebrovascular Reactivity Mapping Without Gas Challenges: A Methodological Guide. Front Physiol. 2021;11:1711. doi:10.3389/fphys.2020.608475
12. Moia S, Stickland RC, Ayyagari A, Termenon M, Caballero-gaudes C, Bright MG. Voxelwise optimization of hemodynamic lags to improve regional CVR estimates in breath-hold fMRI. 2020.
13. Stickland RC, Zvolanek KM, Moia S, Ayyagari A, Caballero-Gaudes C, Bright MG. A practical modification to a resting state fMRI protocol for improved characterization of cerebrovascular function. Neuroimage. 2021;239(June):118306. doi:10.1016/j.neuroimage.2021.118306
14. Chang C, Glover GH. Relationship between respiration, end-tidal CO2, and BOLD signals in resting-state fMRI. Neuroimage. 2009;47(4):1381-1393. doi:10.1016/j.neuroimage.2009.04.048
15. Vogt KM, Ibinson JW, Schmalbrock P, Small RH. Comparison between end-tidal CO2 and respiration volume per time for detecting BOLD signal fluctuations during paced hyperventilation. Magn Reson Imaging. 2011;29(9):1186-1194. doi:10.1016/J.MRI.2011.07.011
16. Cauzzo S, Callara AL, Morelli MS, et al. Mapping dependencies of BOLD signal change to end-tidal CO2: Linear and nonlinear modeling, and effect of physiological noise correction. J Neurosci Methods. 2021;362:109317. doi:10.1016/J.JNEUMETH.2021.109317
17. Birn RM, Diamond JB, Smith MA, Bandettini PA. Separating respiratory-variation-related fluctuations from neuronal-activity-related fluctuations in fMRI. Neuroimage. 2006;31(4):1536-1548. doi:10.1016/j.neuroimage.2006.02.048
18. Moia S, Termenon M, Uruñuela E, et al. ICA-based denoising strategies in breath-hold induced cerebrovascular reactivity mapping with multi echo BOLD fMRI. Neuroimage. 2021;233:117914. doi:10.1016/J.NEUROIMAGE.2021.117914
19. Moia S, Uruñuela E, Ferrer V, Caballero-Gaudes C. EuskalIBUR. OpenNeuro. 2020. doi:10.18112/OPENNEURO.DS003192.V1.0.1
20. Posse S, Wiese S, Gembris D, et al. Enhancement of BOLD-Contrast Sensitivity by Single-Shot Multi-Echo Functional MR Imaging. Magn Reson Med. 1999;42:87-97. doi:10.1002/(SICI)1522-2594(199907)42:1
21. DuPre E, Salo T, Markello R, Kundu P, Whitaker K, Handwerker D. ME-ICA/tedana: 0.0.6. February 2019. doi:10.5281/ZENODO.2558498
22. Birn RM, Smith MA, Jones TB, Bandettini PA. The respiration response function: The temporal dynamics of fMRI signal fluctuations related to changes in respiration. Neuroimage. 2008;40(2):644-654. doi:10.1016/j.neuroimage.2007.11.059
23. Desikan RS, Ségonne F, Fischl B, et al. An automated labeling system for subdividing the human cerebral cortex on MRI scans into gyral based regions of interest. Neuroimage. 2006;31(3):968-980. doi:10.1016/J.NEUROIMAGE.2006.01.021
24. Diedrichsen J, Maderwald S, Küper M, et al. Imaging the deep cerebellar nuclei: A probabilistic atlas and normalization procedure. Neuroimage. 2011;54(3):1786-1794. doi:10.1016/J.NEUROIMAGE.2010.10.035
Figures