1672
Repeatability of cerebrovascular reactivity amplitude and timing estimates using a sinusoidal manipulation of end-tidal CO21Physical Therapy and Human Movement Sciences, Feinberg School of Medicine, Northwestern University, Chicago, IL, United States, 2Biomedical Engineering, McCormick School of Engineering, Northwestern University, Evanston, IL, United States
Synopsis
We assessed the repeatability of fMRI Cerebrovascular Reactivity (CVR) estimates using CO2 sinusoidal stimuli. We estimated BOLD-CVR amplitude and phase using a fast Fourier transform (FFT) analysis and a cross-correlation analysis (Rapidtide). Amplitude and delay maps showed sensible regional variations for both time-points, but participant variability was notable. CVR spatial correlations between time-points were higher after averaging within cortical parcels, compared to weak voxel-wise correlations. Qualitatively, Rapidtide achieved higher between-session correlations than FFT. GM average amplitudes agreed between time-points. At the correct spatial scale, with careful consideration of parameter scaling, this short stimulus is a viable CVR mapping option.
INTRODUCTION
Cerebrovascular reactivity (CVR), a metric of cerebrovascular health, reflects the vasculature’s ability to regulate blood flow under changing conditions[1]. CVR impairments have been reported in multiple disease populations[2]. Modeling CVR timing is crucial for understanding cerebrovascular disease[3], and can improve the regional accuracy of CVR amplitude estimates[4]. Previous work demonstrated a sinusoidal design to manipulate the partial pressure of end-tidal CO2 (PETCO2) during fMRI[5-8] can produce robust CVR amplitude & timing estimates with 3-5 minutes of data[8]. The advantages of this sinusoidal versus a typical block design are the short duration and participant comfort. With a Fourier analysis, this stimulus allows for rapid modeling of CVR amplitude and timing, with fewer noise confounds[8]. However, no work has assessed the repeatability of Blood Oxygenation Level Dependent (BOLD) CVR estimates using a sinusoidal manipulation of PETCO2.We evaluate sinusoidal stimulus BOLD-CVR repeatability with (1) a Fourier analysis which assumes an ideal sinusoidal response and (2) a cross-correlation approach that uses a refined global fMRI regressor as the signal model (having the advantage of not assuming an input stimulus however being non-specific to the CO2 induced vasodilatory response).
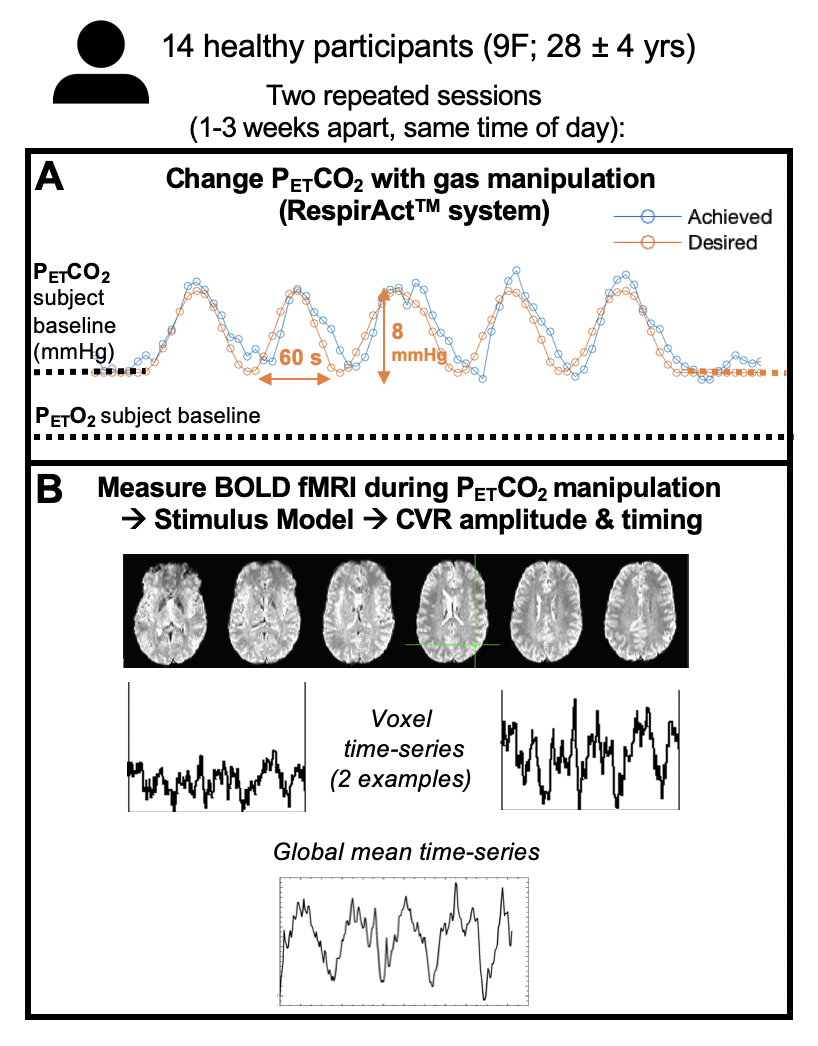
DATA COLLECTION
At two time-points (Tp1 and Tp2), that were 1-3 weeks apart, 14 healthy participants were scanned on a Siemens 3T Prisma, 64-channel head coil (Fig1). A 1mm isotropic T1-weighted scan was acquired for registration and tissue segmentation. A 5-minute BOLD-weighted fMRI scan was acquired with gradient-echo EPI (TR/TE=1200/34ms, FA=63º, 2mm isotropic voxels, 60 slices, MB factor=4), during which participant end-tidal values were modulated with a computer-controlled gas blender (RespirAct™ Thornhill Medical, Toronto[9]). PETO2 was targeted at the participant’s estimated baseline and PETCO2 was targeted to follow 5 sinusoidal cycles (60s period, ranging from participant’s PETCO2 baseline to +8mmHg). A BOLD-weighted volume was collected with reverse phase encoding for distortion correction.DATA ANALYSIS
The T1-weighted dataset was brain extracted and segmented into grey matter (GM), white matter (WM) and cerebrospinal fluid masks with FAST (FSL). Pre-processing of the BOLD data (with FSL and AFNI) included: removal of first 25 volumes, volume registration to the single band reference image, distortion correction, brain extraction, linear transformation to T1-weighted space, and time-course detrending (by fitting a 4th order polynomial series), then expression as % change from mean. Pre-processed BOLD data were linearly transformed to MNI space (FSL, FLIRT) to make group average maps and for spatial correlations within MNI parcels, explained below.MATLAB’s (R2018b) fast Fourier transform (FFT) function was applied to pre-processed BOLD data; the %BOLD amplitude and phase at the stimulus frequency were extracted for each voxel and scaled to %BOLD/mmHg and absolute delay (seconds). A voxel-wise correlation coefficient (CC) between the stimulus and BOLD response was calculated, equivalent to a Pearson’s correlation coefficient[7]. Spatial correlations between time-points were performed on the CVR parameter maps, at the voxel-wise level within tissue masks and at the parcel-wise level (average value from each parcel of FSL’s Harvard-Oxford cortical atlas). CVR-related amplitude and delay maps were also created with the Rapidtide program[10,11] which calculates a similarity function between a probe regressor (refined global BOLD signal) and every voxel using a cross-correlation approach, outputting an optimal delay and amplitude of that delay. The same spatial correlations were performed on these Rapidtide outputs. Agreement of GM median CVR-related amplitude values was assessed with Bland-Altman plots.
RESULTS
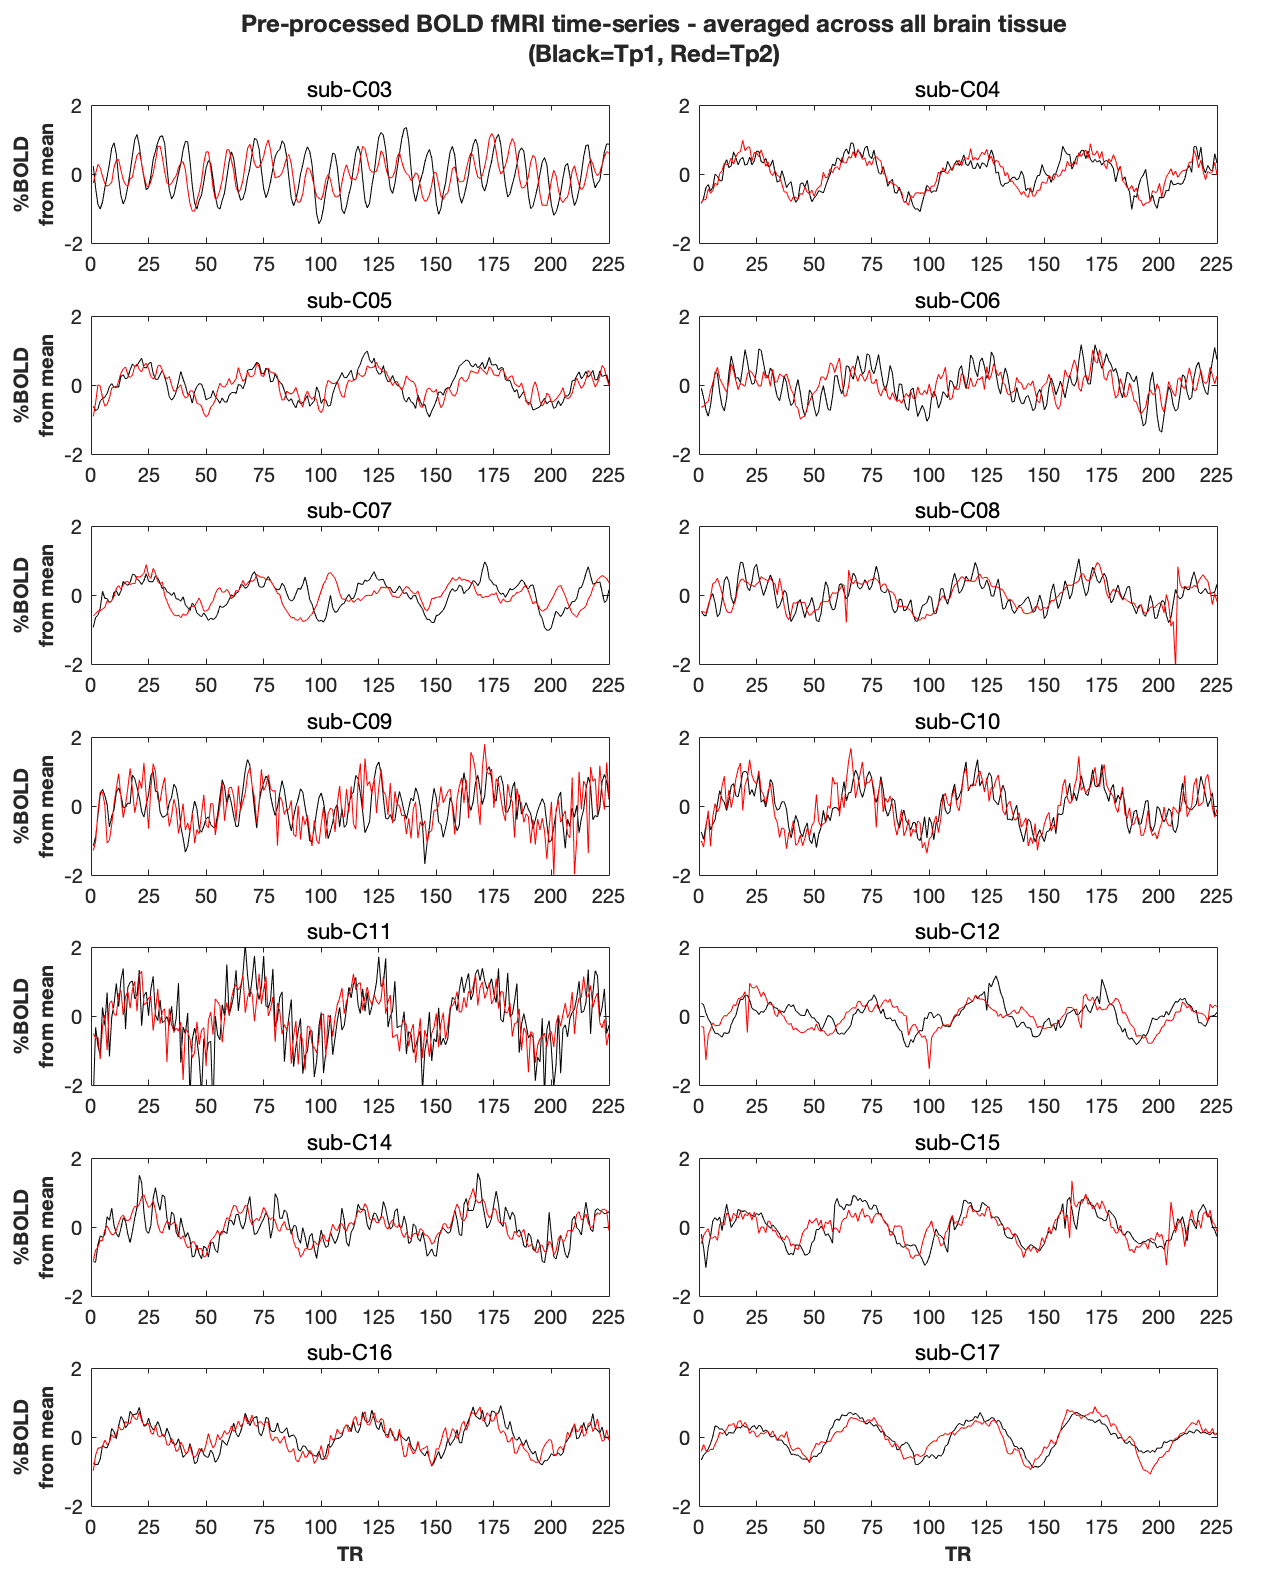
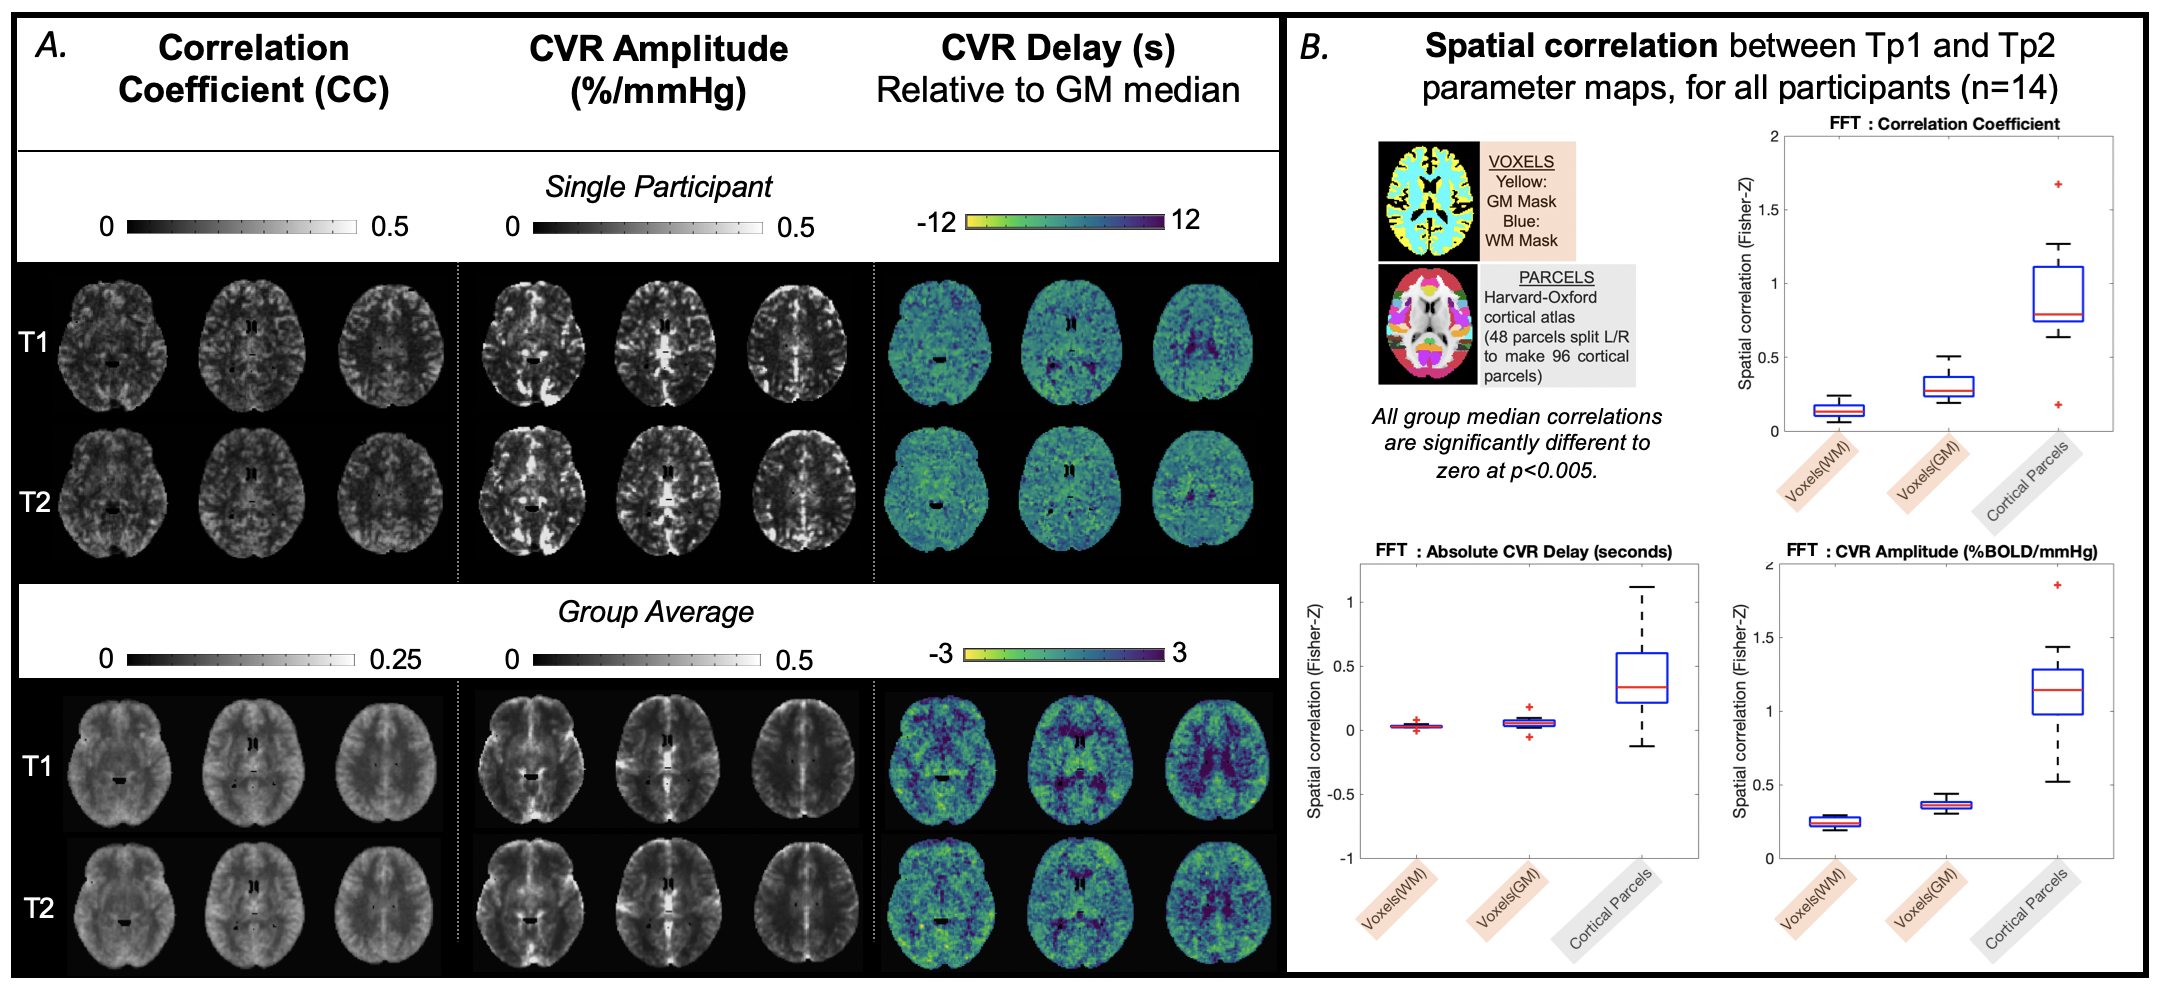
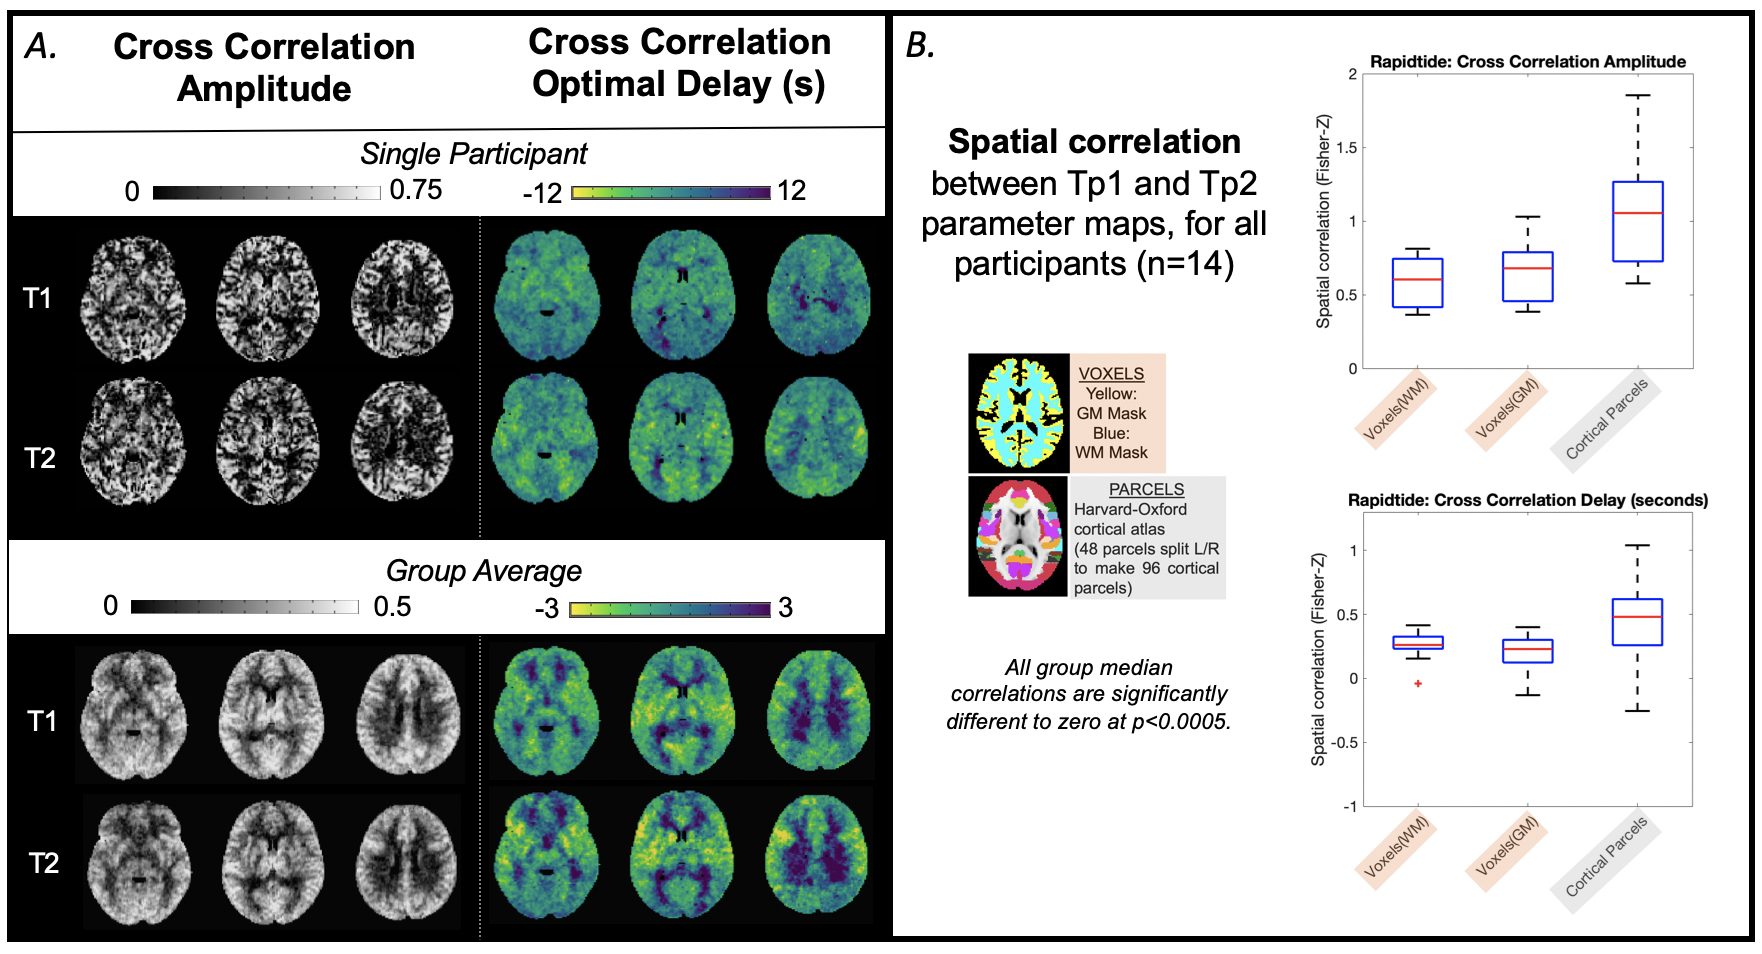
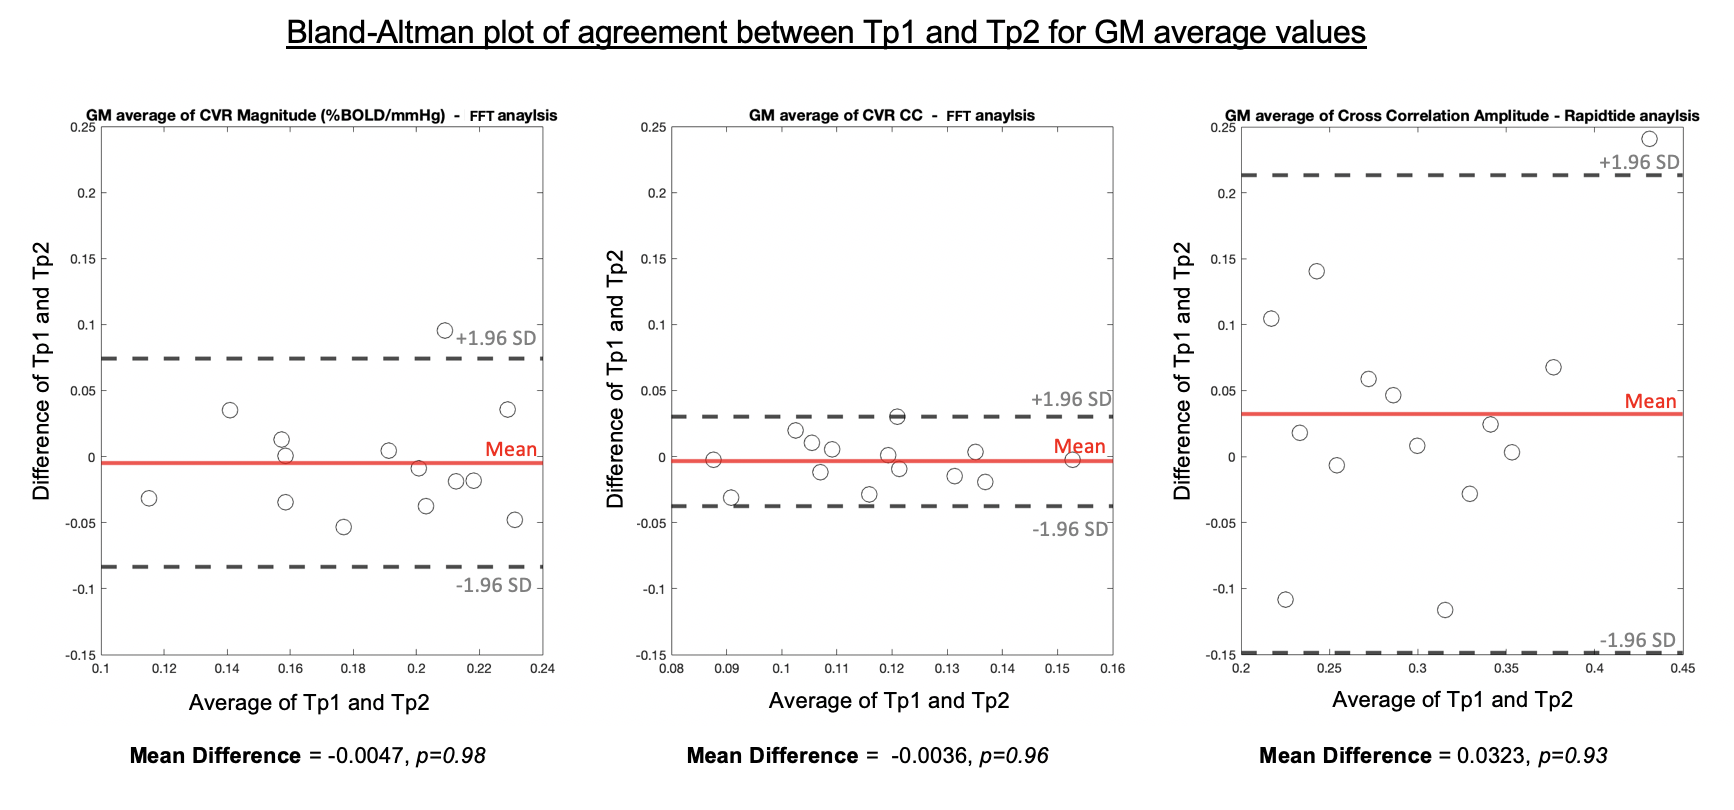
Every participant, except C03, showed global BOLD signal changes in an approximate sinusoidal pattern for both time-points (Fig2). Fig3 and Fig4 display amplitude and delay maps for for each analysis, including summaries of spatial correlations; all group median correlations between time-points were significantly different to zero. Group median spatial correlations (Fisher’s Z transformed) for Rapidtide cross-correlation amplitudes were 0.60 in WM, 0.68 in GM, and 1.05 in cortical parcels, higher than spatial correlations for FFT CVR Amplitude (WM: 0.24, GM: 0.36, Parcels: 1.14) and for FFT CC (WM: 0.13, GM: 0.27, Parcels: 0.79). Timing had much weaker correlations, for both analyses (Rapidtide, WM: 0.26, GM: 0.23, Parcels: 0.48; FFT, WM: 0.03., GM: 0.05, Parcels: 0.34). Fig5 shows the mean difference between time-points for GM CVR-related amplitudes is not significantly different to zero for all analyses, with no clear bias.DISCUSSION
Group maps of CVR-related amplitude and delay show sensible regional variations for both time-points, but participant variability was notable. There was better repeatability of CVR amplitude than delay[12] and better repeatability when assessed at the parcel-level. Repeatability for Rapidtide was better than FFT however we did not directly statistically compare. GM average CVR-related amplitudes agreed across time-points. It is challenging to identify biological/analytical thresholds for maximal acceptable differences, as is recommended with Bland-Altman, considering different relative and absolute scales of these CVR-related amplitudes.Poor voxel-wise repeatability could be driven by misalignment of Tp1 and Tp2 data. Smoothing input data, incorporating measures of CVR parameter error (to further restrict voxels analyzed) and using the achieved stimulus frequency and amplitude (from PETCO2 recordings[6]) may improve repeatability in both analyses.
Maps of CVR amplitude and delay can be produced with a short sinusoidal stimulus and simple Fourier or cross-correlation type analyses. This stimulus is a viable option for CVR mapping if analyzed at the correct spatial scale, and with careful consideration of parameter scaling.
Acknowledgements
Research reported in this abstract was supported, in part, by the National Institutes of Health's National Center for Advancing Translational Sciences, Grant Number UL1TR001422. The content is solely the responsibility of the authors and does not necessarily represent the official views of the National Institutes of Health. Thanks to staff at the Center for Translational Imaging (CTI), Northwestern Radiology, and members of the Bright Lab for help with study set up. K.M.Z. was supported by an NIH-funded training program (T32EB025766).References
1. Meng L, Gelb AW. Regulation of cerebral autoregulation by carbon dioxide. Anesthesiology. 2015;122(1):196-205. doi:10.1097/ALN.0000000000000506
2. Sleight E, Stringer MS, Marshall I, Wardlaw JM, Thrippleton MJ. Cerebrovascular Reactivity Measurement Using Magnetic Resonance Imaging: A Systematic Review. Front Physiol. 2021;0:182. doi:10.3389/FPHYS.2021.643468
3. Donahue MJ, Strother MK, Lindsey KP, Hocke LM, Tong Y, Frederick BDB. Time delay processing of hypercapnic fMRI allows quantitative parameterization of cerebrovascular reactivity and blood flow delays. J Cereb Blood Flow Metab. 2016;36(10):1767-1779. doi:10.1177/0271678X15608643
4. RC S, KM Z, S M, A A, C C-G, MG B. A practical modification to a resting state fMRI protocol for improved characterization of cerebrovascular function. Neuroimage. 2021;239. doi:10.1016/J.NEUROIMAGE.2021.118306
5. Golestani AM, Kwinta JB, Strother SC, Khatamian YB, Chen JJ. The association between cerebrovascular reactivity and resting-state fMRI functional connectivity in healthy adults: The influence of basal carbon dioxide. Neuroimage. 2016;132:301-313. doi:10.1016/j.neuroimage.2016.02.051
6. Driver ID, Andoh J, Blockley NP, Francis ST, Gowland PA, Paus T. Hemispheric asymmetry in cerebrovascular reactivity of the human primary motor cortex: an in vivo study at 7 T. NMR Biomed. 2015;28(5):538-545. doi:10.1002/nbm.3282
7. Blockley NP, Driver ID, Francis ST, Fisher JA, Gowland PA. An improved method for acquiring cerebrovascular reactivity maps. Magn Reson Med. 2011;65(5):1278-1286. doi:10.1002/mrm.22719
8. Blockley NP, Harkin JW, Bulte DP. Rapid cerebrovascular reactivity mapping: Enabling vascular reactivity information to be routinely acquired. Neuroimage. 2017;159:214-223. doi:10.1016/J.NEUROIMAGE.2017.07.048
9. Slessarev M, Han J, Mardimae A, et al. Prospective targeting and control of end-tidal CO 2 and O 2 concentrations. J Physiol. 2007;581(3):1207-1219. doi:10.1113/jphysiol.2007.129395
10. Tong Y, Hocke LM, Frederick BB. Low Frequency Systemic
Hemodynamic “Noise” in Resting State BOLD fMRI: Characteristics, Causes, Implications, Mitigation Strategies, and Applications. Front Neurosci. 2019;13(JUL):787. doi:10.3389/fnins.2019.00787
11. Rapidtide. github.com/bbfrederick/rapidtide.
12. Moia S, Termenon M, Uruñuela E, et al. ICA-based denoising strategies in breath-hold induced cerebrovascular reactivity mapping with multi echo BOLD fMRI. Neuroimage. 2021;233:117914. doi:10.1016/j.neuroimage.2021.117914
Figures