1671
Vascular supply affects hemodynamic responses to a hypercapnia cerebrovascular reactivity challenge assessed by BOLD-fMRI
Kayley Marchena-Romero1,2, Xiang Ji2, Andrew Centen2, Rosa Sommer2,3, Joel Ramirez2, Michael J Thrippleton4, Andrew Lim2,3, Joanna M Wardlaw4, Sandra E Black2, and Bradley J MacIntosh1,2
1Medical Biophysics, University of Toronto, Toronto, ON, Canada, 2Sunnybrook Research Institute, Toronto, ON, Canada, 3Institute of Medical Sciences, University of Toronto, Toronto, ON, Canada, 4Centre for Clinical Brain Sciences, University of Edinburgh, Edinburgh, United Kingdom
1Medical Biophysics, University of Toronto, Toronto, ON, Canada, 2Sunnybrook Research Institute, Toronto, ON, Canada, 3Institute of Medical Sciences, University of Toronto, Toronto, ON, Canada, 4Centre for Clinical Brain Sciences, University of Edinburgh, Edinburgh, United Kingdom
Synopsis
Cerebrovascular reactivity (CVR) is a dynamic assessment of hemodynamic response during hypercapnia. Conventional CVR metrics provide a single estimate to summarize the dilatory response to CO2. We propose to isolate dilation and constriction responses to a CVR challenge measured by BOLD-fMRI and assess the effect of vascular supply on vasoreactivity. We show that vascular supply affects the hemodynamic response to hypercapnia, and that this effect varies over time in different clinical cohorts. This work suggests that the extraction of individual features embedded in a CVR challenge can help characterize cerebrovascular physiology in unique clinical cohorts.
Introduction
The ability to control vascular tone is often diminished in diseases associated with cerebrovascular dysfunction1-3. The health of the cerebrovascular system can be probed using a cerebrovascular reactivity (CVR) challenge with hypercapnia. This experiment measures the vessel’s ability to dilate in response to a vasoactive stimulus. CVR has been shown to be heterogenous across the brain4. Several groups have observed a varying response to CO2 between anterior and posterior cerebral arteries5,6, suggesting that the regional response to CO2 may be influenced by vascular supply.A CVR challenge is composed of individual dilation and constriction events that describe the vascular response to hypercapnia. However, the conventional CVR measure summarizes dilation responses with a single estimate7. There is an opportunity to extract additional outcome measures from this experiment. In this study, we assess vascular supply (i.e. anterior and posterior cerebral artery) effect on dilation and constriction responses to CO2 using blood-oxygen-level-dependent (BOLD) fMRI. Here, we capitalize on individual hemodynamic responses of a CVR experiment to better characterize unique clinical cohorts.
Methods
Study Design: Participants with sleep apnea or sporadic small vessel disease (SVD) were recruited to this study at Sunnybrook Research Institute. The sleep apnea cohort consists of individuals with sleep concerns and were scanned at baseline prior to treatment. The sporadic SVD cohort consists of individuals with cognitive concerns and varying levels of white matter hyperintensities. A second cohort of individuals with SVD was included to assess the generalization of this methodology. This dataset was collected using a different experimental paradigm. Full datasets and analysis were completed in N= 48 (F: 63 ± 11 years, M: 70 ± 11 years).Breathing Task: The hypercapnia challenge used for the sleep apnea and sporadic SVD groups is adopted from a published protocol established by our international collaborators1. The gas was administered as follows: 120 seconds off, 180 seconds on, 120 seconds off, 180 seconds on, and 120 seconds off. For the second SVD dataset, hypercapnic gas was administered as follows: 45 off, 90 seconds on, 90 seconds off, 120 seconds on, and 180 seconds off.
Imaging: BOLD-fMRI data were collected on a 3T Siemens Prisma system scanner using an SMS-EPI pulse sequence (TR/TE= 1550/30 ms, flip angle=67°, number of slices = 50, voxel size = 2.5x2.5x2.5 mm3). The second SVD dataset was collected using a 3T Phillips Achieva system scanner using a SENSE pulse sequence (TR/TE= 1550/30 ms, flip angle=90°, number of slices = 50, voxel size = 3.6x2.9x3 mm3).
ROI Generation: Brains were skull stripped using iCVMapp3r (icvmapp3r.readthedocs.io). An anterior (ACA) and posterior cerebral artery (PCA) region of interest was segmented to cover grey and white matter area that are supplied by each artery (Figure 1).
Data Analysis: A dilation (CVR) estimate was calculated for each administration of CO2 using Thiel-Sen’s Slope, a non-parametric method: $$CVR=\frac{\dfrac{Sen's\:slope\times\:no.\:time\:points}{mean\:baseline\:BOLD\:signal}}{\triangle\:PETCO_2}\times100$$
The constriction rate describes the rate of BOLD signal decay after CO2 cessation, where β is the coefficient of a linear regression between BOLD signal and time: $$Constriction\:Rate=\frac{\beta}{\triangle\:PETCO_2}$$
Ratio estimates describe the difference in vasoreactivity between the ACA and PCA region, where a ratio of 1 is indicative of no difference: $$Ratio_{dilation}=\frac{ACA\:CVR_1\:+ACA\:CVR_2}{PCA\:CVR_1\:+PCA\:CVR_2}$$
$$Ratio_{constriction}=\frac{ACA\:constriction\: rate_1\:+ACA\:constriction\: rate_2}{PCA\:constriction\: rate_1+PCA\:constriction\: rate_2}$$
Statistical Analysis: A one-way ANOVA was conducted for group differences in ratio estimates. Linear regression models between age and ratio estimates were used to analyze the relationship between regional vasoreactivity and age. Beta estimates and unadjusted p-values are reported for these models.
Results
Boxplots of dilation and constriction results are shown in Figure 2. Significant between-group differences were observed for dilation [F(2,45)=6.11, P=0.005] but not constriction [F(2,45)=0.573, P=0.568) ratios. Correlation plots between ratio estimates and age are show in Figure 3. Ratioconstriction is positively associated with age in the sporadic SVD group (β=0.057, P=0.042), negatively associated with age in sleep apnea (β=-0.04, P=0.013), and no association exists in the second SVD cohort (β=-0.007, P=0.483). There were no significant associations between Ratiodilation and age for any cohort.Discussion and Conclusion
By investigating dilation and constriction features in isolation, we were able to show a difference in vasoreactivity dependent on vascular supply. Results from our analysis found that the ACA region had a lower dilation response and slower constriction compared to the PCA region in sporadic SVD groups, but not in sleep apnea patients. Group differences indicate that underlying physiology may affect the hemodynamic response to CO2 at the level of large arteries, altering the ability of downstream small vessels to control vascular tone and perfusion. However, it is not possible to disambiguate grey from white matter contributions to the ACA and PCA regions of interest. Nor can we comment on the underlying vascular anatomy. Group differences between the association of age and constriction suggest that isolating constriction features may be a useful outcome measure for CVR experiments as we pursue therapy and interventions for cerebrovascular dysfunction.Acknowledgements
This work was funded by the Foundation Leducq Transatlantic Network of Excellence for the Study of Perivascular Spaces in Small Vessel Disease. We thank the participants, MRI technicians, and support staff for their involvement in this work.References
- Thrippleton MJ, Shi Y, Blair G, et al. Cerebrovascular reactivity measurement in cerebral small vessel disease: Rationale and reproducibility of a protocol for MRI acquisition and image processing. Int J Stroke. 2017;13(2):195-206. doi:10.1177/17474930177307402.
- Ponsaing LB, Lindberg U, Rostrup E, Iversen HK, Larsson HBW, Jennum P. Impaired cerebrovascular reactivity in obstructive sleep apnea: a case-control study. Sleep Medicine. 2018;43(Complete):7-13. doi:10.1016/j.sleep.2017.10.010.3.
- Alwatban M, Murman DL, Bashford G. Cerebrovascular Reactivity Impairment in Preclinical Alzheimer's Disease. J Neuroimaging. 2019;29(4):493-498. doi: 10.1111/jon.126064.
- Bhogal AA, Philippens MEP, Siero JCW, et al. Examining the regional and cerebral depth-dependent BOLD cerebrovascular reactivity response at 7T. NeuroImage. 2015;114(Complete):239-248. doi:10.1016/j.neuroimage.2015.04.014.5.
- Al-Khazraji BK, Shoemaker LN, Gati JS, Szekeres T, Shoemaker JK. Reactivity of larger intracranial arteries using 7 T MRI in young adults. J Cereb Blood Flow Metab. 2019;39(7):1204-1214. doi:10.1177/0271678X187628806.
- Skow RJ, MacKay CM, Tymko MM, et al. Differential cerebrovascular CO₂ reactivity in anterior and posterior cerebral circulations. Respir Physiol Neurobiol. 2013;189(1):76-86. doi:10.1016/j.resp.2013.05.0367.
- Sleight E, Stringer MS, Marshall I, Wardlaw JM, Thrippleton MJ. Cerebrovascular Reactivity Measurement Using Magnetic Resonance Imaging: A Systematic Review. Frontiers in Physiology. 2021;12. doi:10.3389/fphys.2021.643468.
Figures
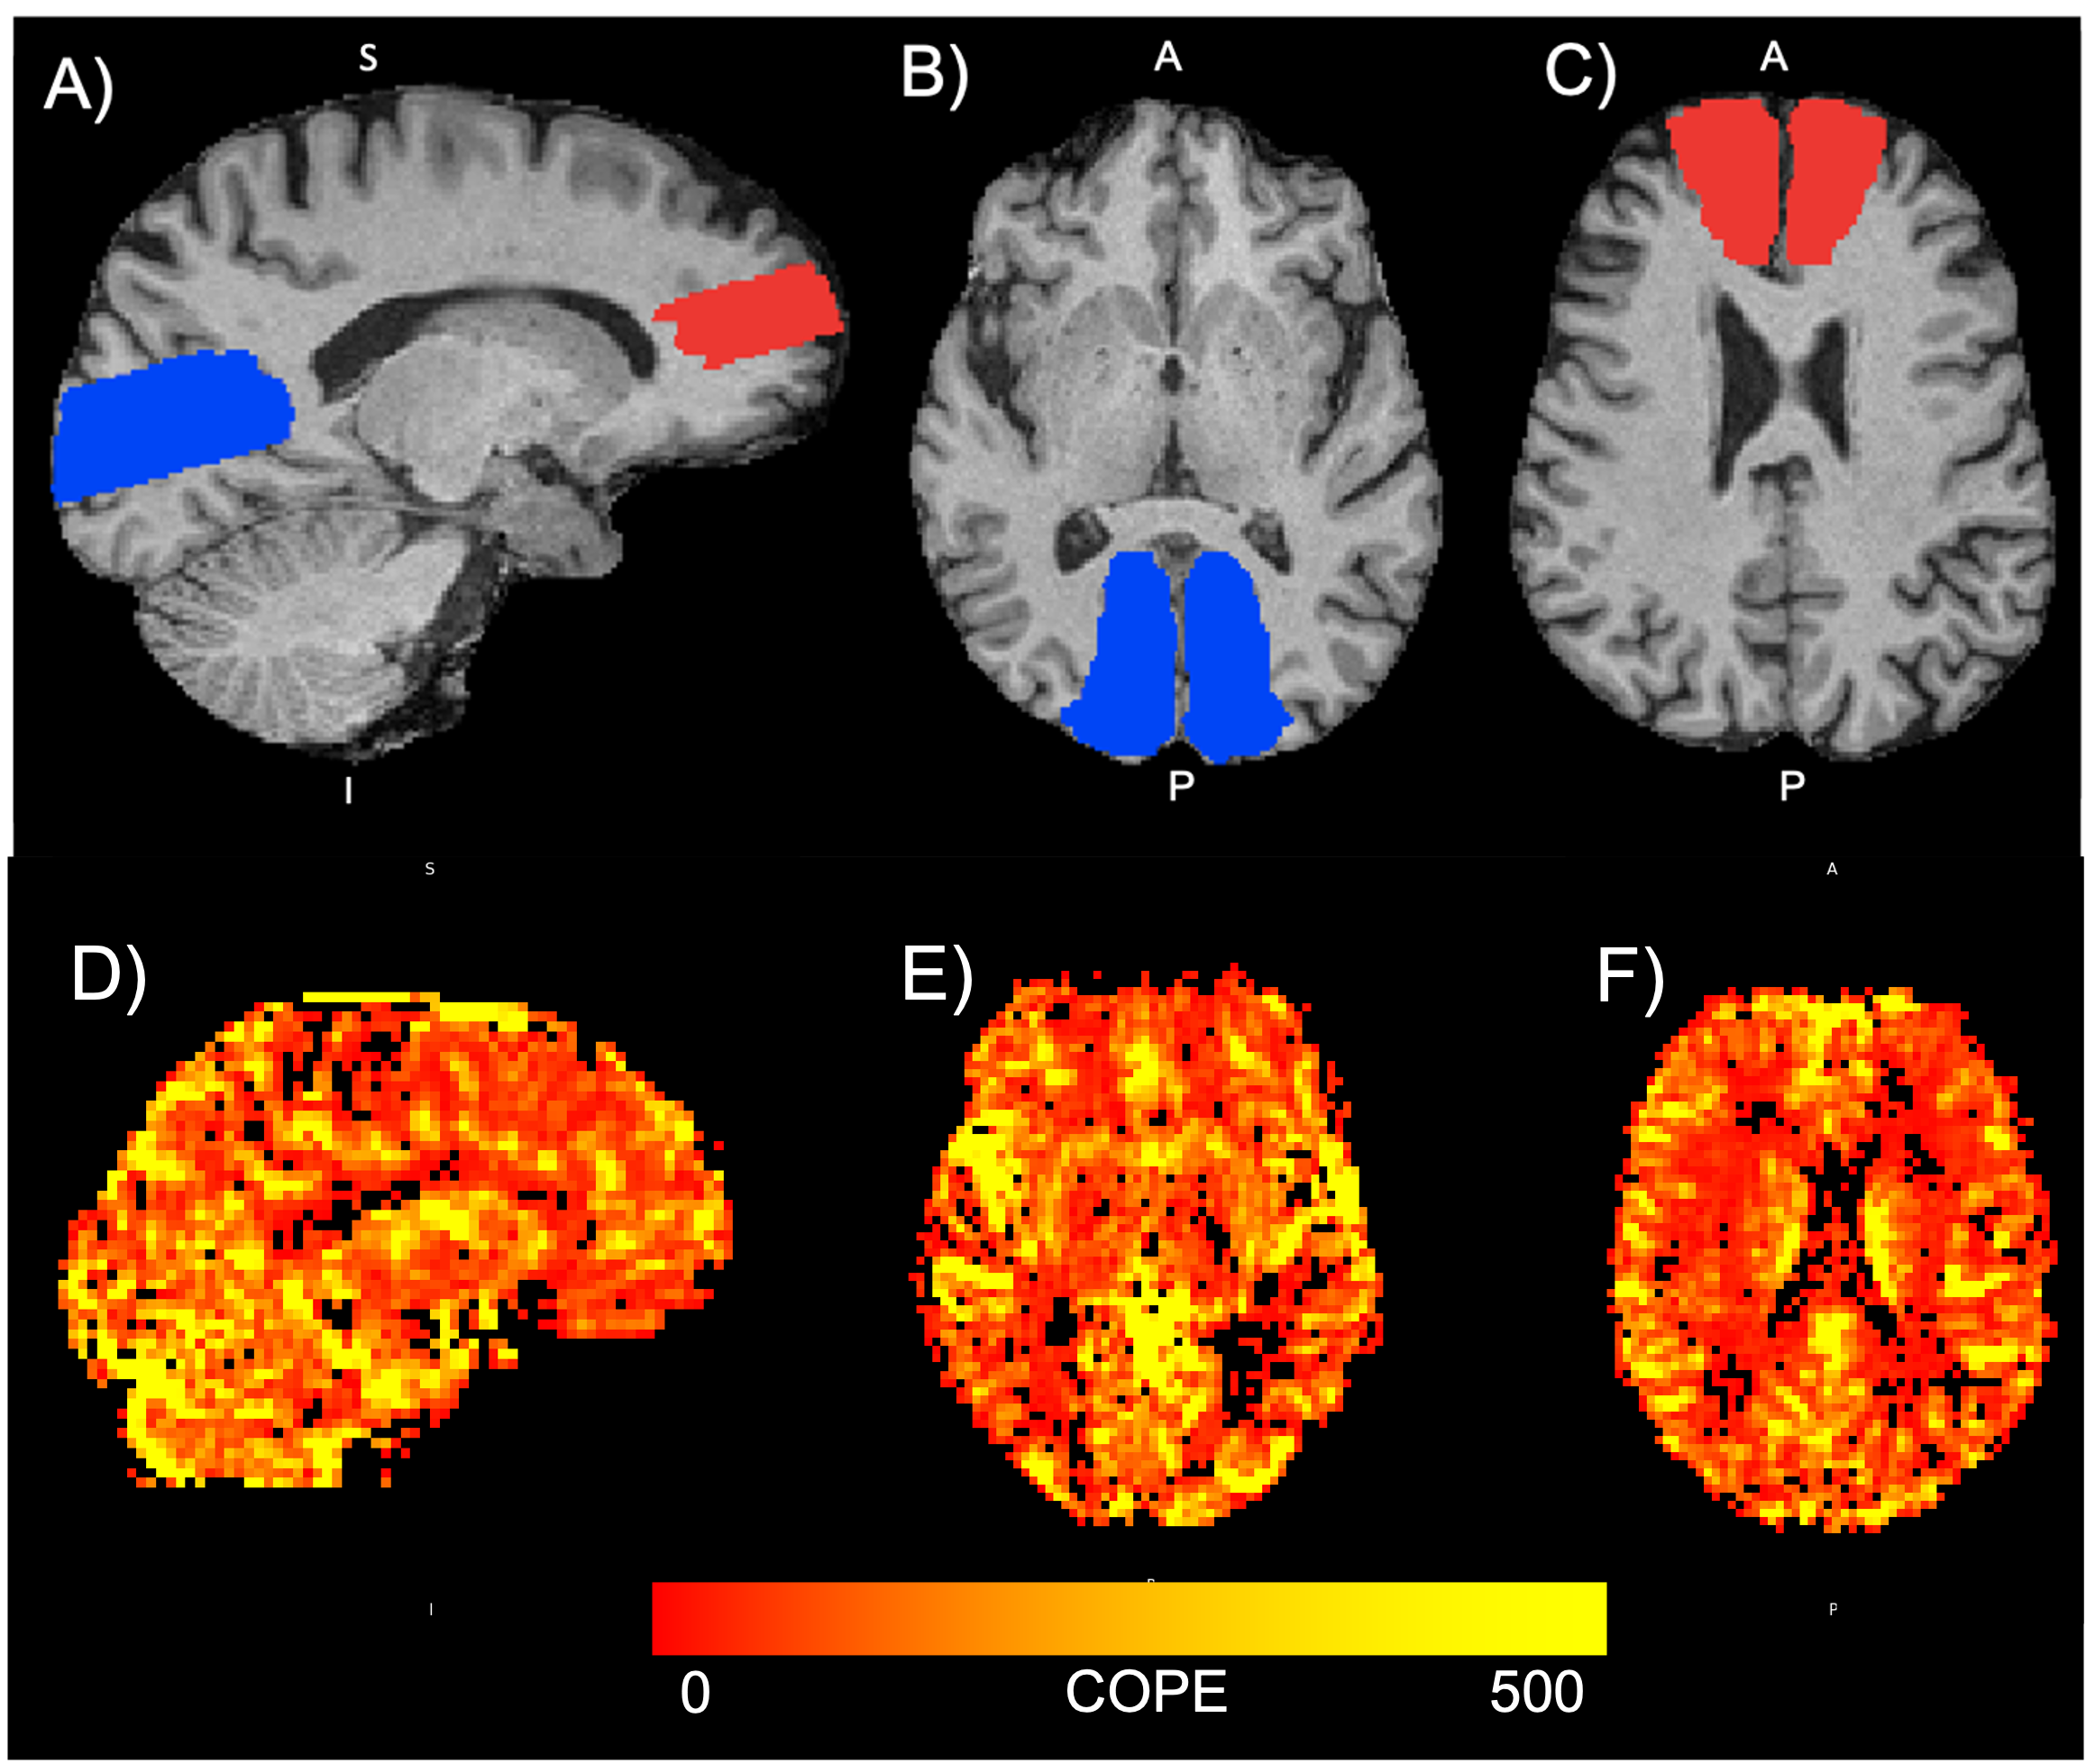
Figure 1: Top panel: Segmentations in T1-space for an example participant. (A) Sagittal view of ACA (red) and PCA (blue) segmentations (B) axial view of the PCA segmentation (C) axial view of the ACA segmentation. Bottom panel: Parametric CVR map shown for an example participant in (D) sagittal and (E-F) axial views. The colour bar denotes the range of contrast of parameter estimates (COPE) obtained for each voxel. A higher COPE value indicates a better goodness-of-fit between the BOLD signal and experimental paradigm. ACA = anterior cerebral artery, PCA = posterior cerebral artery.
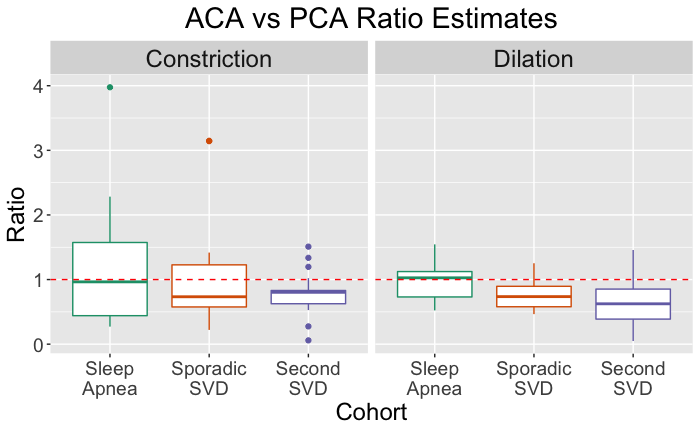
Figure 2: Boxplots indicating ratio estimates for Ratioconstriction and Ratiodilation across each cohort. Ratio estimates indicate the difference between ACA and PCA CVR (or constriction rate) measures. The red dashed line indicates the ratio value where there is no difference between ACA and PCA vasoreactivity.
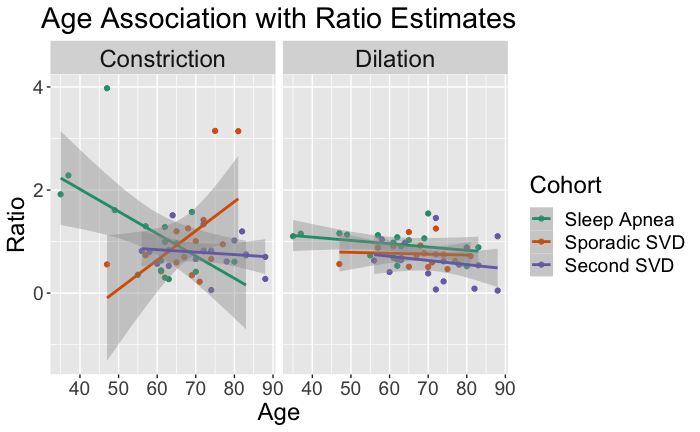
Figure 3: Correlation plots beween Ratioconstriction and age (left) and Ratiodilation and age (right) across all cohorts. A positive association between age and ratio estimates indicates that as age increases, the difference in hemodynamic response between the ACA and PCA decreases. A negative association between age and ratio estimates indicates that as age increases, the difference betweeen ACA and PCA hemodyamic response is also increasing.
DOI: https://doi.org/10.58530/2022/1671