1668
A groupwise registration & tractography framework for cardiac architecture description by diffusion MRI: application to ventricular junctions1IHU Liryc, Electrophysiology and Heart Modeling Institute, Foundation Bordeaux Université, Bordeaux, France, 2Univ. Bordeaux, Centre de recherche Cardio-Thoracique de Bordeaux, U1045, Bordeaux, France, 3INSERM, Centre de recherche Cardio-Thoracique de Bordeaux, U1045, Bordeaux, France, 4Institut des Sciences Cognitives Marc Jeannerod, CNRS UMR 5229, Université Claude Bernard Lyon I, Bron, France, 5Centre de Résonance Magnétique des Systèmes Biologiques, UMR 5536, CNRS/Université de Bordeaux, Bordeaux, France
Synopsis
In this study, we developed a groupwise registration and tractography framework to investigate the global myofiber arrangement of large mammalian sheep hearts. To demonstrate the potential application of the proposed method, a novel description of sub-regions in the intraventricular septum (IVS) is presented. The study focuses on one fiber-bundle in the posterior junction and three fiber-bundles in the anterior junction.
Introduction
Knowledge of the normal myocardial–myocyte orientation could theoretically allow the definition of relevant quantitative biomarkers in clinical routine to diagnose heart pathologies [1,2]. A whole heart diffusion tensor template representative of the global myofiber organization over species is therefore crucial for comparisons across populations. In this study, we develop a groupwise registration and tractography framework to investigate the global myofiber arrangement of large mammalian sheep hearts. To demonstrate the potential application of the proposed method, a novel description of sub-regions in the intraventricular septum (IVS) is presented.Methods
This protocol was approved by the Animal Research Ethics Committee in accordance with the European rules for animal experimentation. The hearts of 4 female sheeps (ovine) were explanted via sternal thoracotomy under general anesthesia. Three hearts were dedicated to MR experiments and one heart was dissected for macroscopic visualization. The three hearts (~12×8×6 cm3, heart weight=150±10 g) were perfusion-fixed in 10% formaldehyde containing 2 mL of gadoterate meglumin. Before imaging, the heart were removed from the solution and immersed in Fomblin. The experiments were performed at 9.4T (Bruker BioSpin MRI system, Ettlingen Germany) with an open bore access of 30 cm and a 200-mm inner diameter gradient (300 mT/m).A 3D FLASH sequence (TE/TR/FA = 9ms, 30ms, 30°) at 150 μm3 voxel resolution was applied to get anatomical images. Diffusion-weighted (DW) images were acquired using a 3D diffusion-weighted spin-echo sequence (TE/TR = 22 ms, 500 ms) at 600 μm3 voxel resolution with 6 diffusion encoded directions, a single b-value of 1000 s/mm2 and three b0 image. This sample preparation and acquisition is described with additional details in Magat et al. [3].
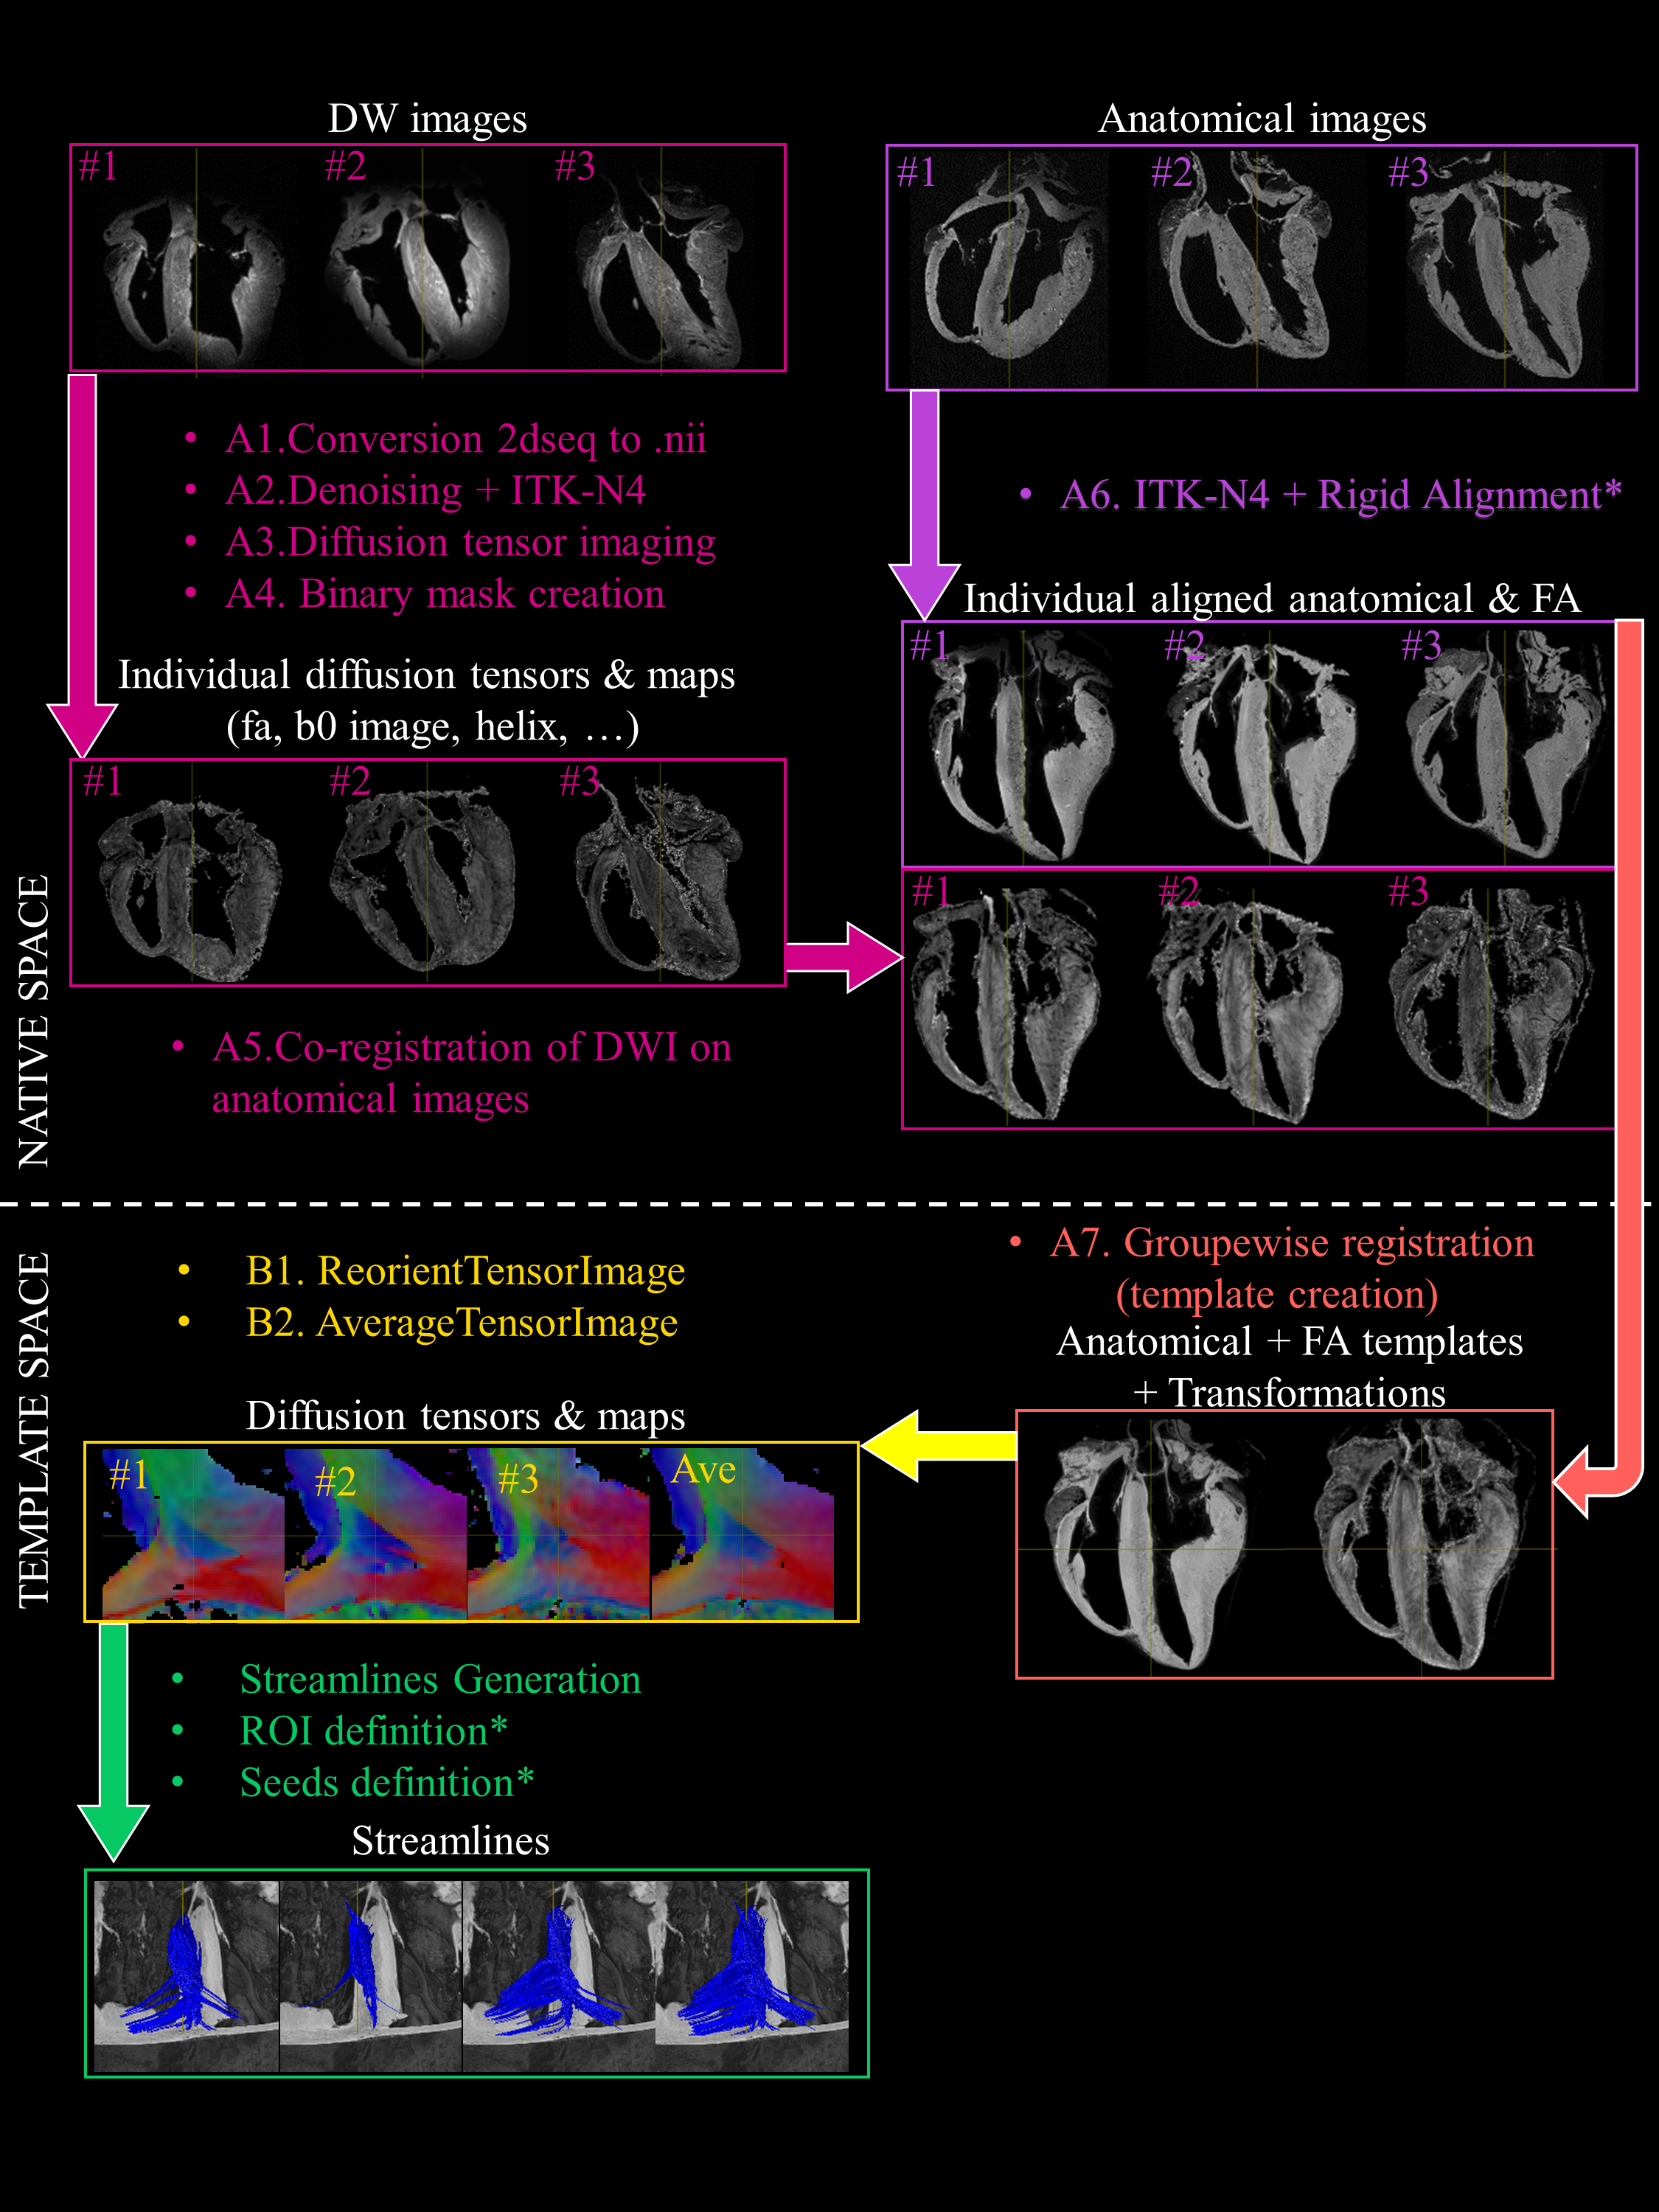
A group-wise registration [4] of anatomical and diffusion-weighted images was performed to generate anatomical and diffusion tensor templates (Fig. 1). Diffusion tensor metrics (eigenvalues, eigenvectors, fractional anisotropy …) were computed [5] to provide a quantitative and spatially-resolved analysis of cardiac microstructure. Then deterministic and probabilistic tractography [5] was performed in order to : i) visualize the myofiber architecture, ii) segment sub-areas depicting the same fiber organization, iii) dilineate seed and tract editing. Finally, dissection was performed to confirm the existence of macroscopic structures identified in the diffusion tensor template (see [6]).
Results
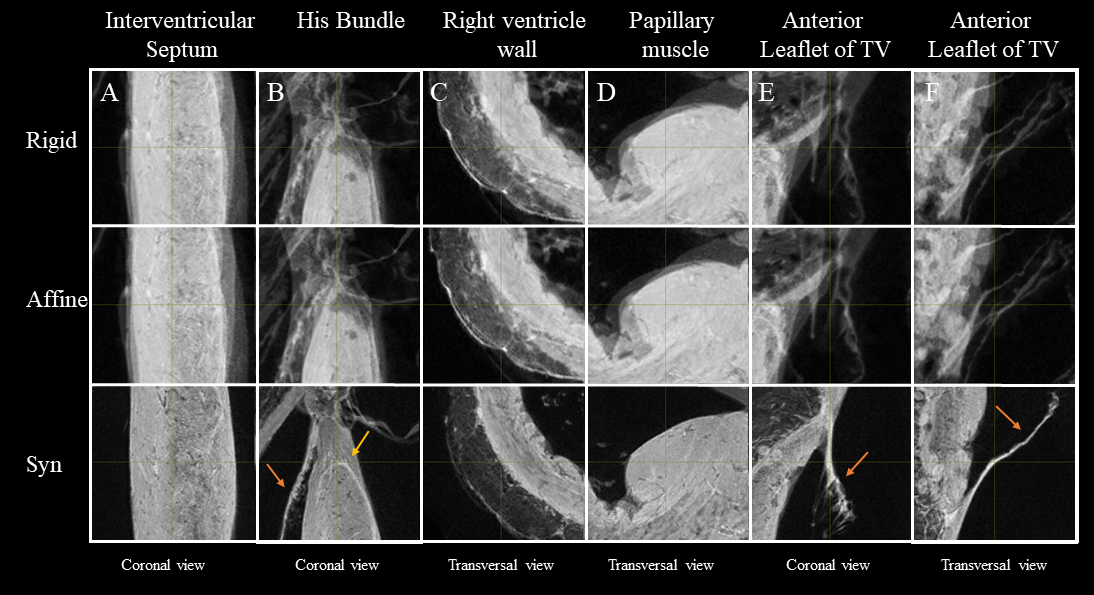
Fig. 2 shows the anatomical templates made with different transformation models during the template creation.Misregistration areas were more visible with rigid or affine transformations than with the symmetric normalization (SyN) transformation model. Several differences are evident through visual inspection: (i) a sharper definition of the myocardial wall (Fig. 3A-F); (ii) an enhanced definition of the division of the His bundle in left and right bundles (Fig. 3B); (iii) a more accurate delineation of the leaflets of the tricuspid valve (Fig. 3B, 3E, 3F).Fig. 3 shows color-coded FA (cFA) maps also known as Red-Green-Blue colormap maps overlaid on anatomical data for the average diffusion tensor images. While a smooth gradient of color from green to red (or vice versa) indicates a normal arrangement of the cardiac myofibers, the existence of small sub-regions in the LV indicates either a rapid change in orientation or apparent boundaries. In particular: fiber arrangements in Inferior-Superior (IS) orientation are visible: i) from the basal area to the mid-ventricular level close to the papillary muscle, ii) at the intersection of the LV and RV from the basal area to mid-ventricular level, iii) in the basal area of the IVS, divided into two fiber-bundles that go on the one hand to the pulmonary artery and on the other hand to the aorta.
To further investigate the existence of abrupt changes in orientation, Fig.4 focuses the analysis on the posterior wall. Fiber orientation can be visually identified on the anatomical template images due to 150 µm resolution and the T2* contrast (Fig 4A,B). Fiber orientation (Fig 4D,E) changes abruptly between adjacent voxels in the IVS and in the middle of the LV/RV junction (blue) depicting a triangular shape in the coronal view, denoted as the posterior singularity.
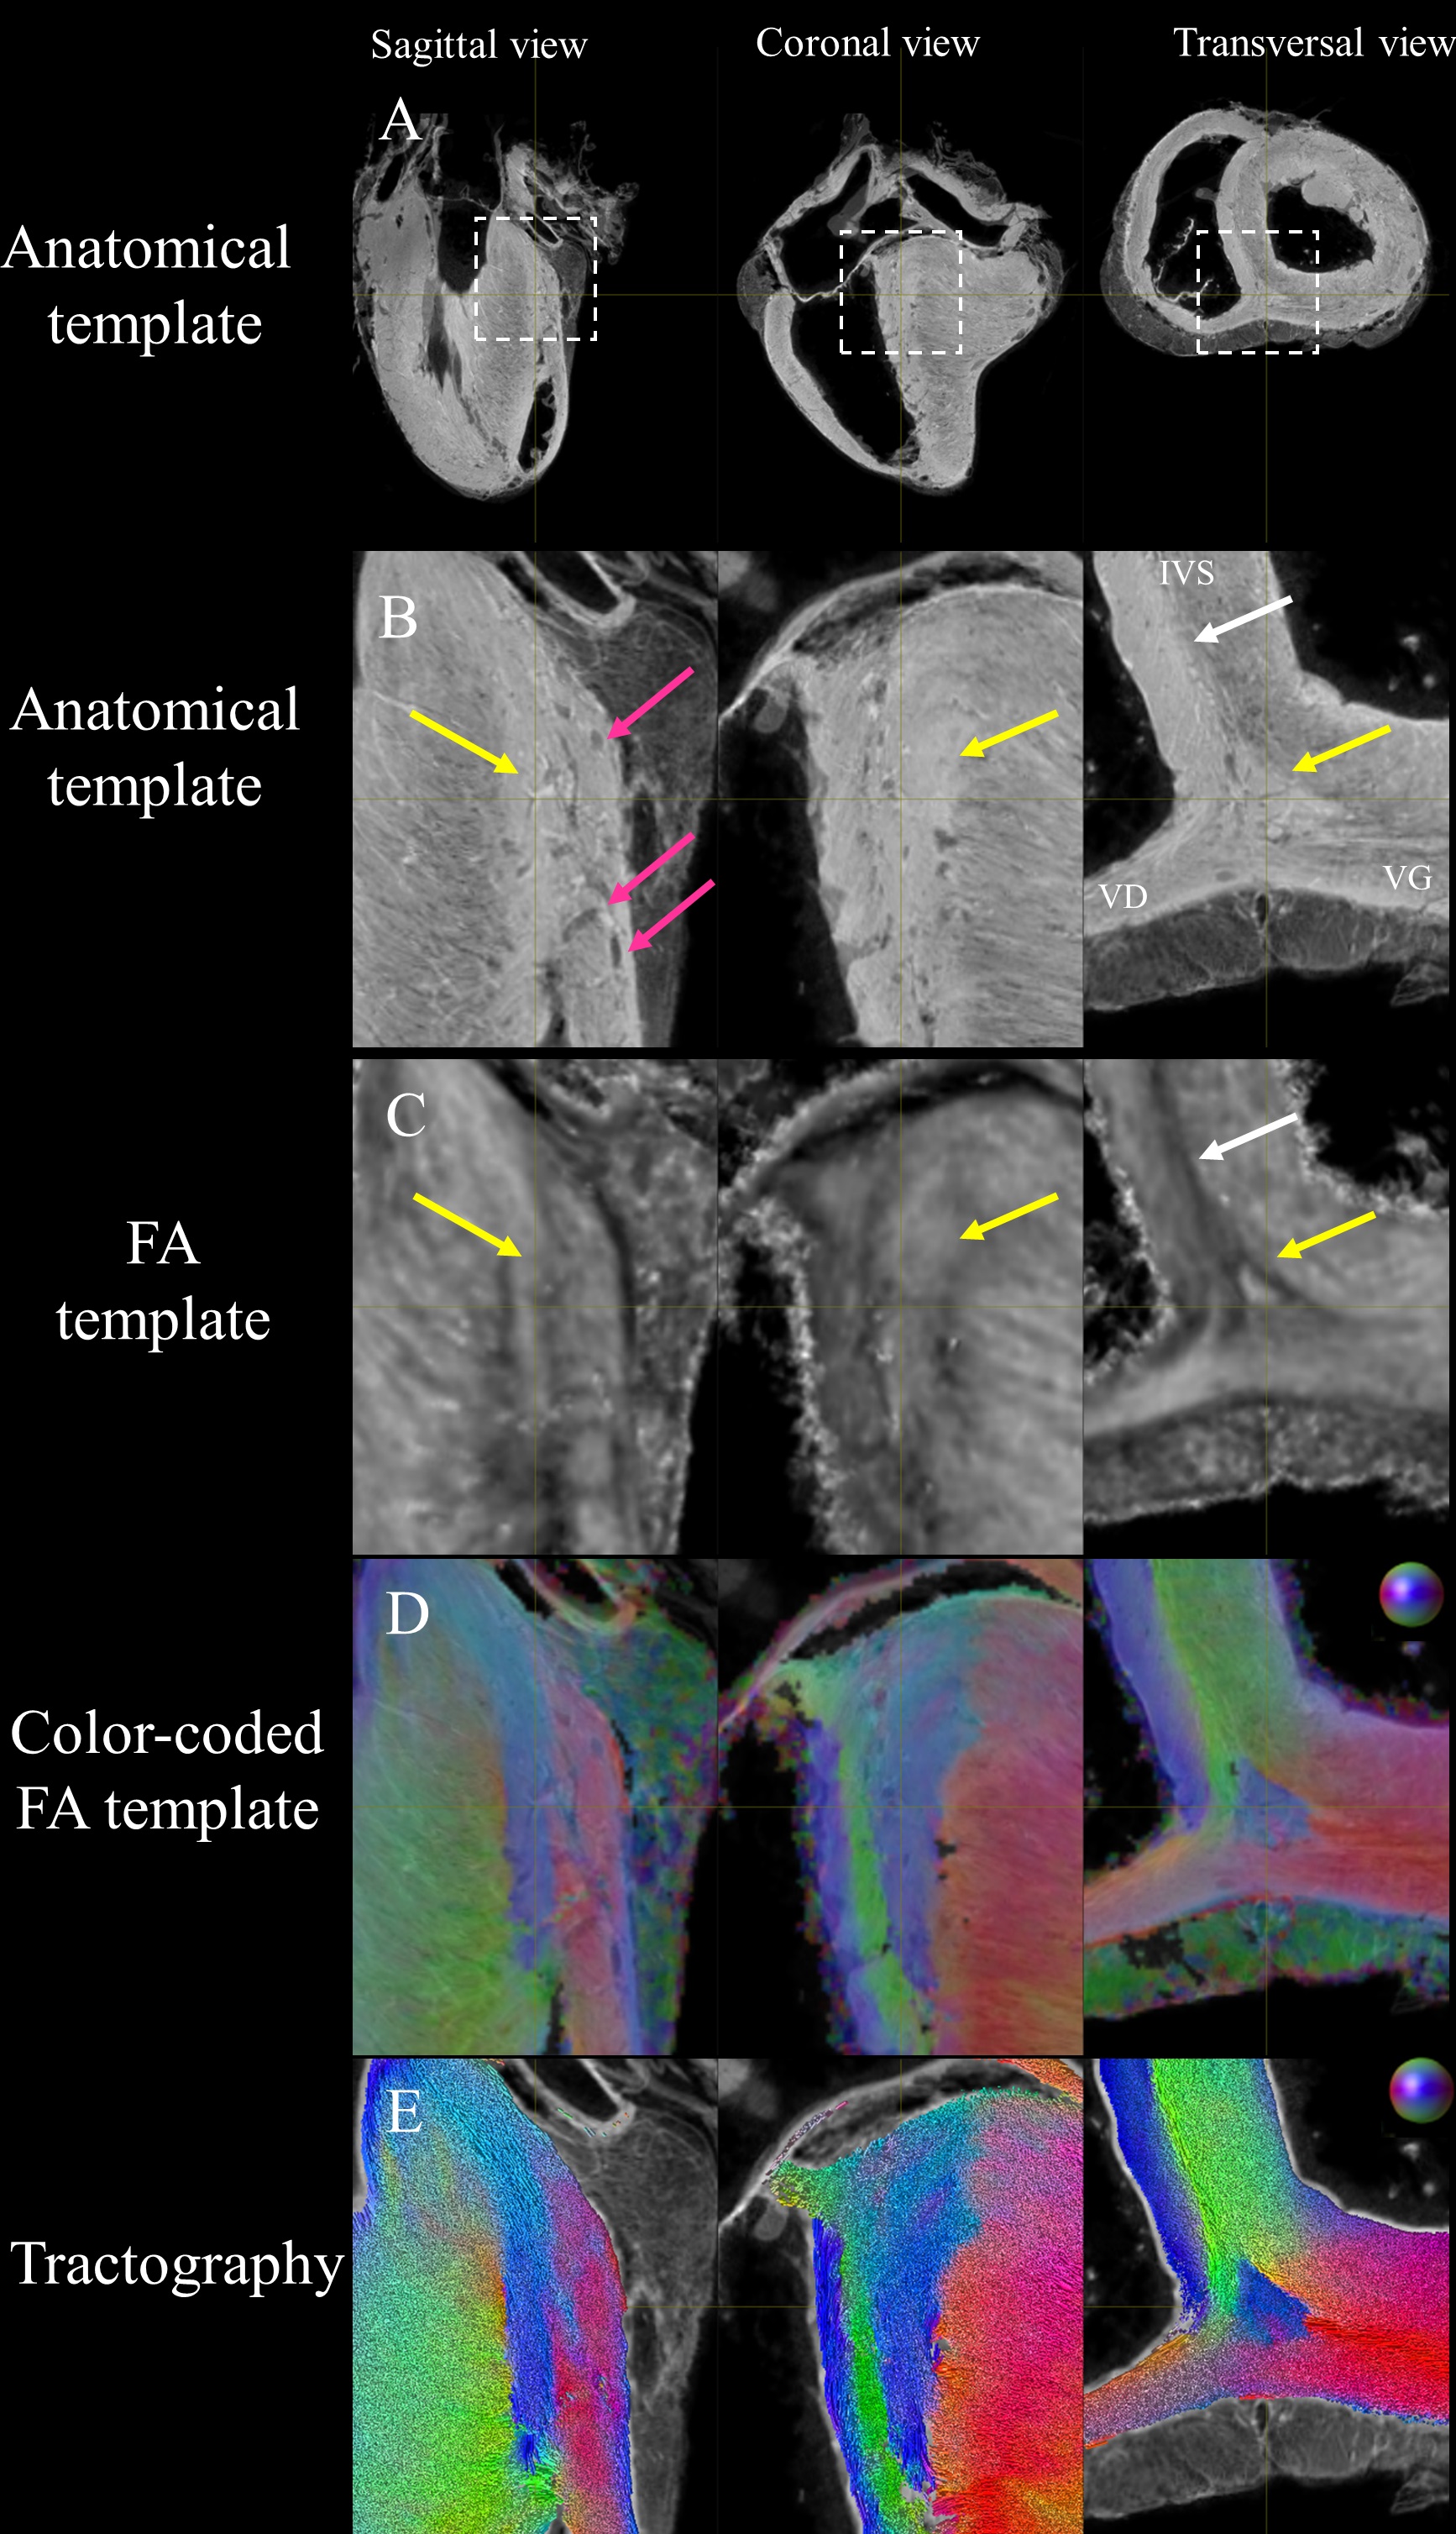
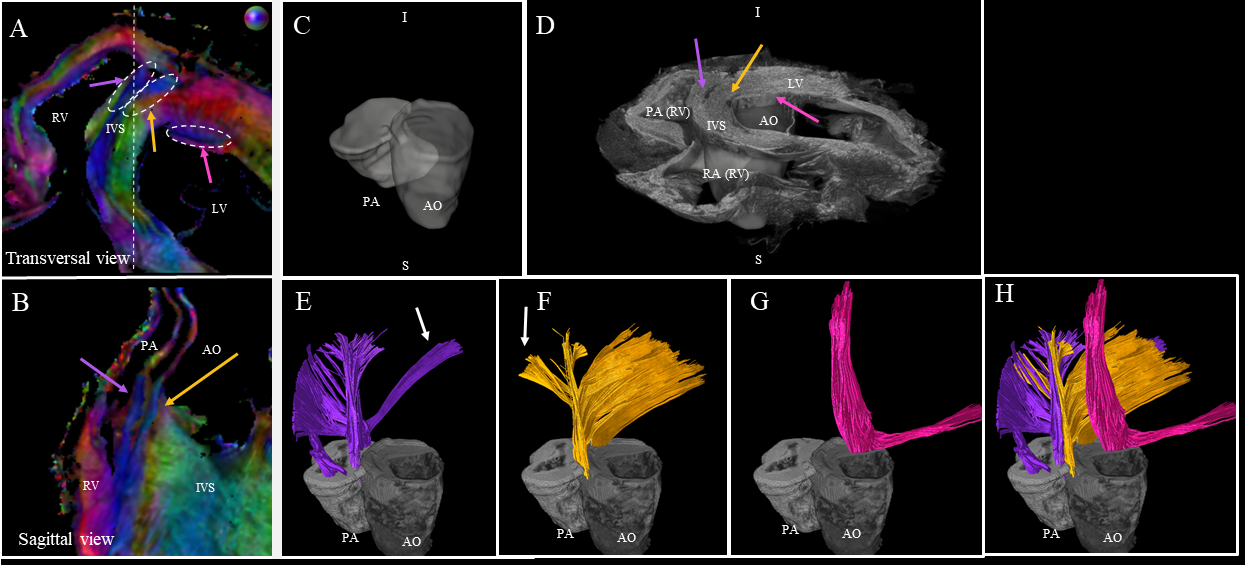
Fig. 5 focuses the analysis on the anterior wall. We observe a division of the fibers inside the IVS into the fiber-bundles going through the aorta (yellow arrow) and the pulmonary artery (purple arrow). The third fascicle of fibers (in pink), located close to the endocardium in the LV, is also noticeable with an orientation differing from the surrounding structures.
Discussion and conclusion
One novelty of the proposed template were to cover both ventricles, the atria, and a fraction of the arteries at an unprecedented spatial resolution of 600 µm isotropic for the DTI acquisition. To assess the accuracy of the model, image-based quantitative measurements and quality check on quantitative DTI metrics (see [6]) were done. To demonstrate the benefits of the tractography to depict the cardiac fiber organization, the structural organization of the anterior and posterior junction was characterized. The study focuses on one fiber-bundle in the posterior junction and three fiber-bundles in the anterior junction. We found no reference and possible comparison in the literature regarding the global myofiber organization in this region. Nevertheless, the findings must be balanced for two differents reasons: i) the fix state of the ex-vivo samples and ii) the low number of datasets.Acknowledgements
The authors are grateful for the help provided via the Github or Discourse platform by Philip Cook and Nick Tustison regarding the use of ANTs and Max Pietsh, Robert Smith and Donald Tournier regarding the use of MRtrix3 software. The authors thank Girish Ramlugun for proofreading
A large fraction of the datasets analyzed during the current study has already been released and more are available upon reasonable request. Data are available at this link (https://zenodo.org/record/5156088). All the processing were fully automatic, reproducible and executed using shell scripts without any input from the user with the exception of long axis alignement and ROIs and seeds definition. The corresponding transformations, ROIs and seed have been shared for reproducibility purposed.
References
1. Hooks DA, Trew ML, Caldwell BJ, Sands GB, LeGrice IJ, Smaill BH. Laminar arrangement of ventricular myocytes influences electrical behavior of the heart. Circ Res. 2007
2. Buckberg G, Hoffman JI, Mahajan A, Saleh S, Coghlan C. Cardiac mechanics revisited: the relationship of cardiac architecture to ventricular function. Circulation. 2008
3. Magat J, Ozenne V, Cedilnik N, Naulin J, Haliot K, Sermesant M, et al. 3D MRI of explanted sheep hearts with submillimeter isotropic spatial resolution: comparison between diffusion tensor and structure tensor imaging. MAGMA. 2021
4. Avants BB, Tustison NJ, Song G, Cook PA, Klein A, Gee JC. A reproducible evaluation of ANTs similarity metric performance in brain image registration. Neuroimage. 2011
5. Tournier JD, Calamante F, Connelly A. MRtrix: diffusion tractography in crossing fiber regions. International journal of imaging systems and technology. 2012
6 Julie Magat, Maxime Yon, Yann Bihan-Poudec, Valéry Ozenne. A groupwise registration and tractography framework for cardiac myofiber architecture description by diffusion MRI: an application to the ventricular junctions. bioRxiv 2021.10.05.463112
Figures