1667
In Vivo Clinical Cardiac DTI in 5 minutes1Leeds Institute of Cardiovascular and Metabolic Medicine, University of Leeds, Leeds, United Kingdom, 2Leeds Teaching Hospitals Trust, Leeds, United Kingdom, 3Massachusetts General Hospital, Harvard Medical School, Cardiovascular Research Center, Martinos Center for Biomedical Imaging, Charlestown, MA, United States, 4Health Science Technology, Harvard-MIT, Cambridge, MA, United States
Synopsis
There is strong interest in characterising the cardiac microstructure using in vivo cardiac diffusion tensor imaging (CDTI). However, its use in larger clinical studies is often hampered by long scan times. We sought to rationalise the scan parameters needed for a clinically feasible CDTI protocol, by comparing carefully subsampled data against a 24-minute reference dataset. A design strategy was identified based on maximising the number of diffusion-weighting (DW) directions, subject to minimum SNR requirements. Feasibility of a 5-minute protocol was demonstrated where NRMSE(MD) = 5.2±0.2%, NRMSE(FA) = 12.8±0.2%, RMSE(HA) = 5.5±0.4°, RMSE(absE2A) = 15.7±1.9°.
Purpose
Cardiac diffusion tensor imaging (CDTI) is an emerging method for myocardial tissue characterisation without need for exogenous contrast agents. It has shown promise in a range of diseases including infarction1, amyloidosis2, hypertrophic3, 4 and dilated cardiomyopathy5. However, its use in broader clinical studies is hampered by long scan times needed to obtain sufficient signal-to-noise ratio (SNR) and angular resolution in diffusion-weighting (DW), where scans exceeding 10 minutes are common. Scan times are directly proportional to the number of repetitions (NR) and number of DW directions (ND) used. Previous work in ex vivo hearts extrapolated to the clinical SNR, NR and ND showed up to 13% overestimation in fractional anisotropy (FA) with respect to ground truth6. We extend this work in healthy volunteers, and evaluate strategies for shorter acquisitions, with the objective of enhancing the numbers of patients in which CDTI would be clinically feasible.Methods
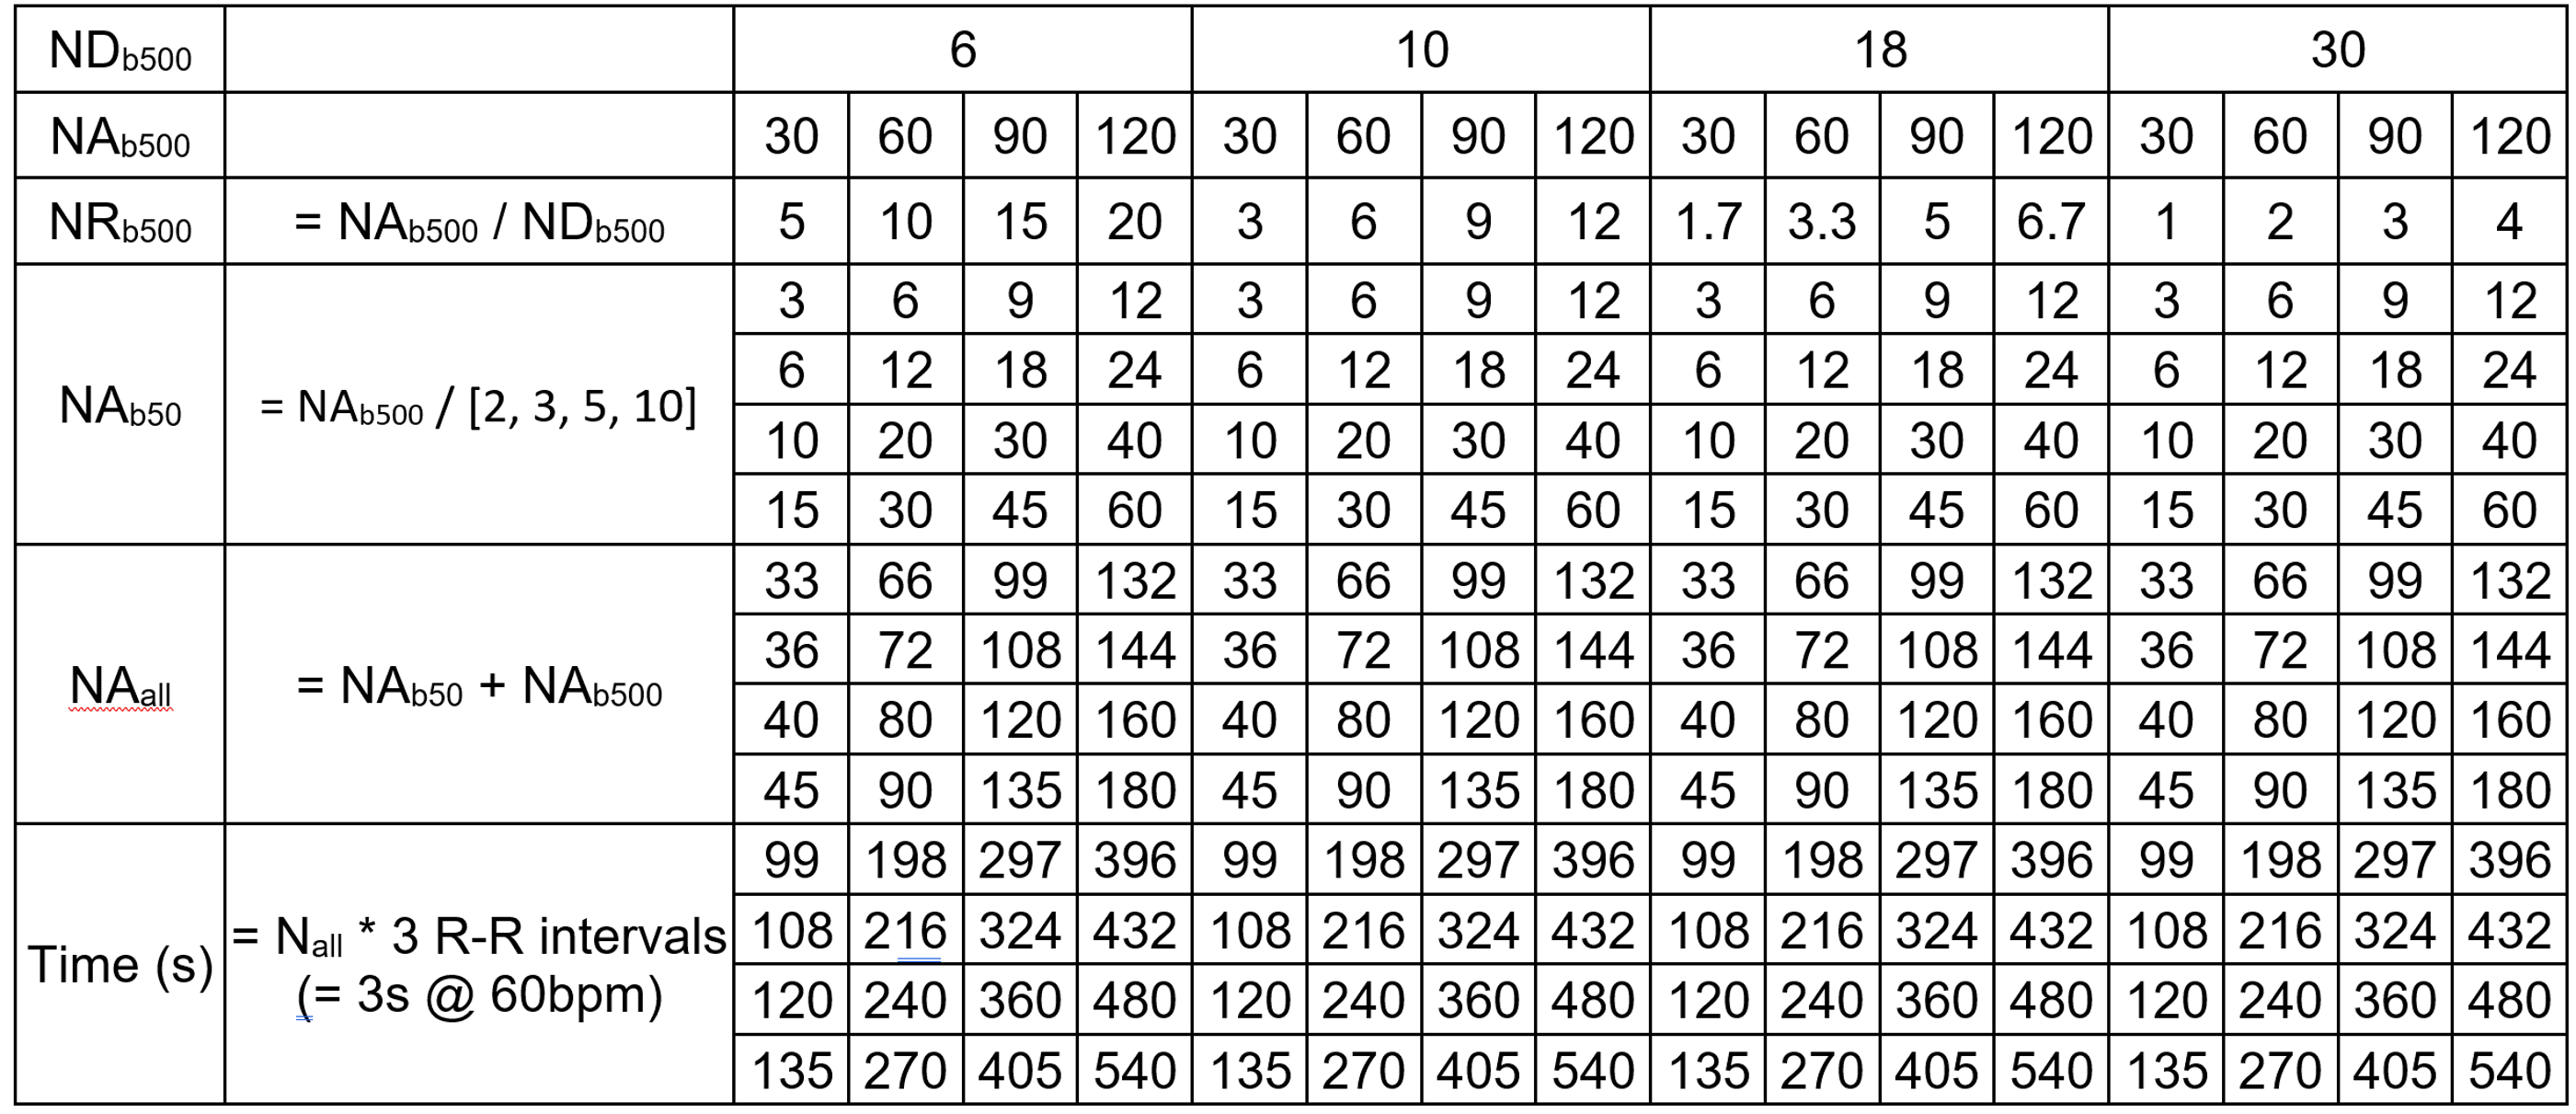
CDTI data were acquired in healthy volunteers (N = 3) using a Prisma 3T MRI (Siemens Healthineers, Erlangen, Germany). The study was performed under approved ethics, and healthy volunteers provided written consent. Data were acquired with single-shot spin echo EPI, 2DRF inner volume excitation and cardiac triggering: TR = 3 RR-intervals, TE = 76 ms, in-plane resolution = 2.3 x 2.3 mm2, slice thickness = 8 mm, number of slices = 3, field-of-view = 320 x 111 mm2, bandwidth = 2012 Hz/px, b-value = 50 and 500 s/mm2. Reference data were acquired with NR(ND3, b50) = 24, NR(ND30, b500) = 12 and NR(ND6, b500) = 8, with number of acquisitions (NA) = 480, in randomised fashion. The nominal acquisition time = NA * TR = 24 min @ 60 bpm. ND3, ND30 and ND6 diffusion schemes refer to an orthogonal scheme, modified Cook scheme7, and subset of the modified Cook scheme. Data were registered to the averaged dataset using rigid followed by affine transformation in Elastix8. We investigated the effects of DW sampling scheme (NDb500 = 6, 10, 18, 30), number of acquisitions at high b (NAb500 = 30, 60, 90, 120) and number of acquisitions at low b (NAb50 = NAb500 / 2, 3, 5, 10) giving rise to 64 subsampled datasets (Table 1). The condition numbers of the DW sampling schemes NDb500 = 6, 10, 18, 30 were 1.74, 1.75, 1.70 and 1.58 respectively. Tensors were fitted to each dataset using non-linear least squares, and the left ventricular myocardium was manually segmented. Mean diffusivity (MD), FA, helix angle (HA) and absolute E2 angle (absE2A) were reported in a mid-myocardial short-axis slice. Root-mean-squared-error (RMSE) was reported in HA and absE2A, and normalised RMSE (NRMSE) was reported in MD and FA, with respect to the reference dataset.Results
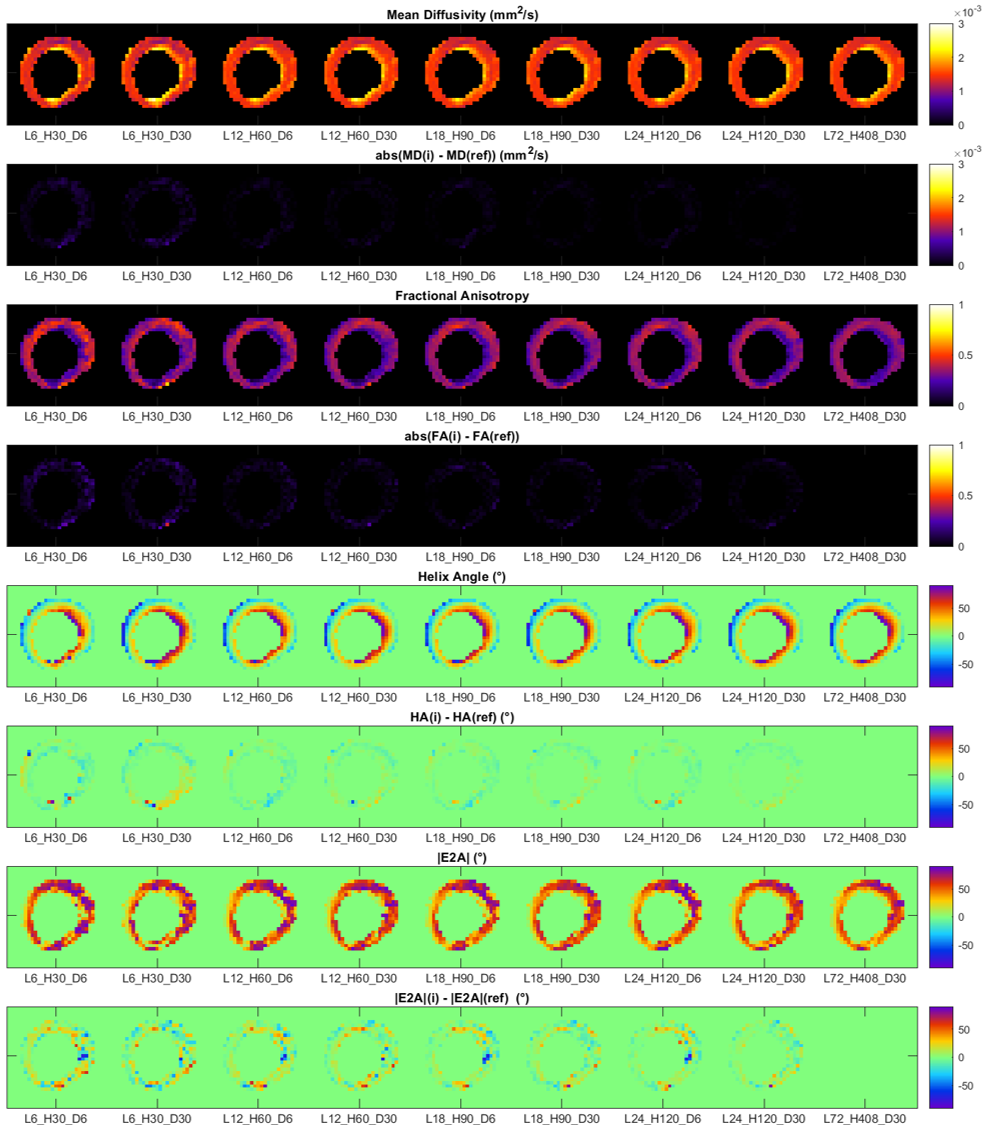
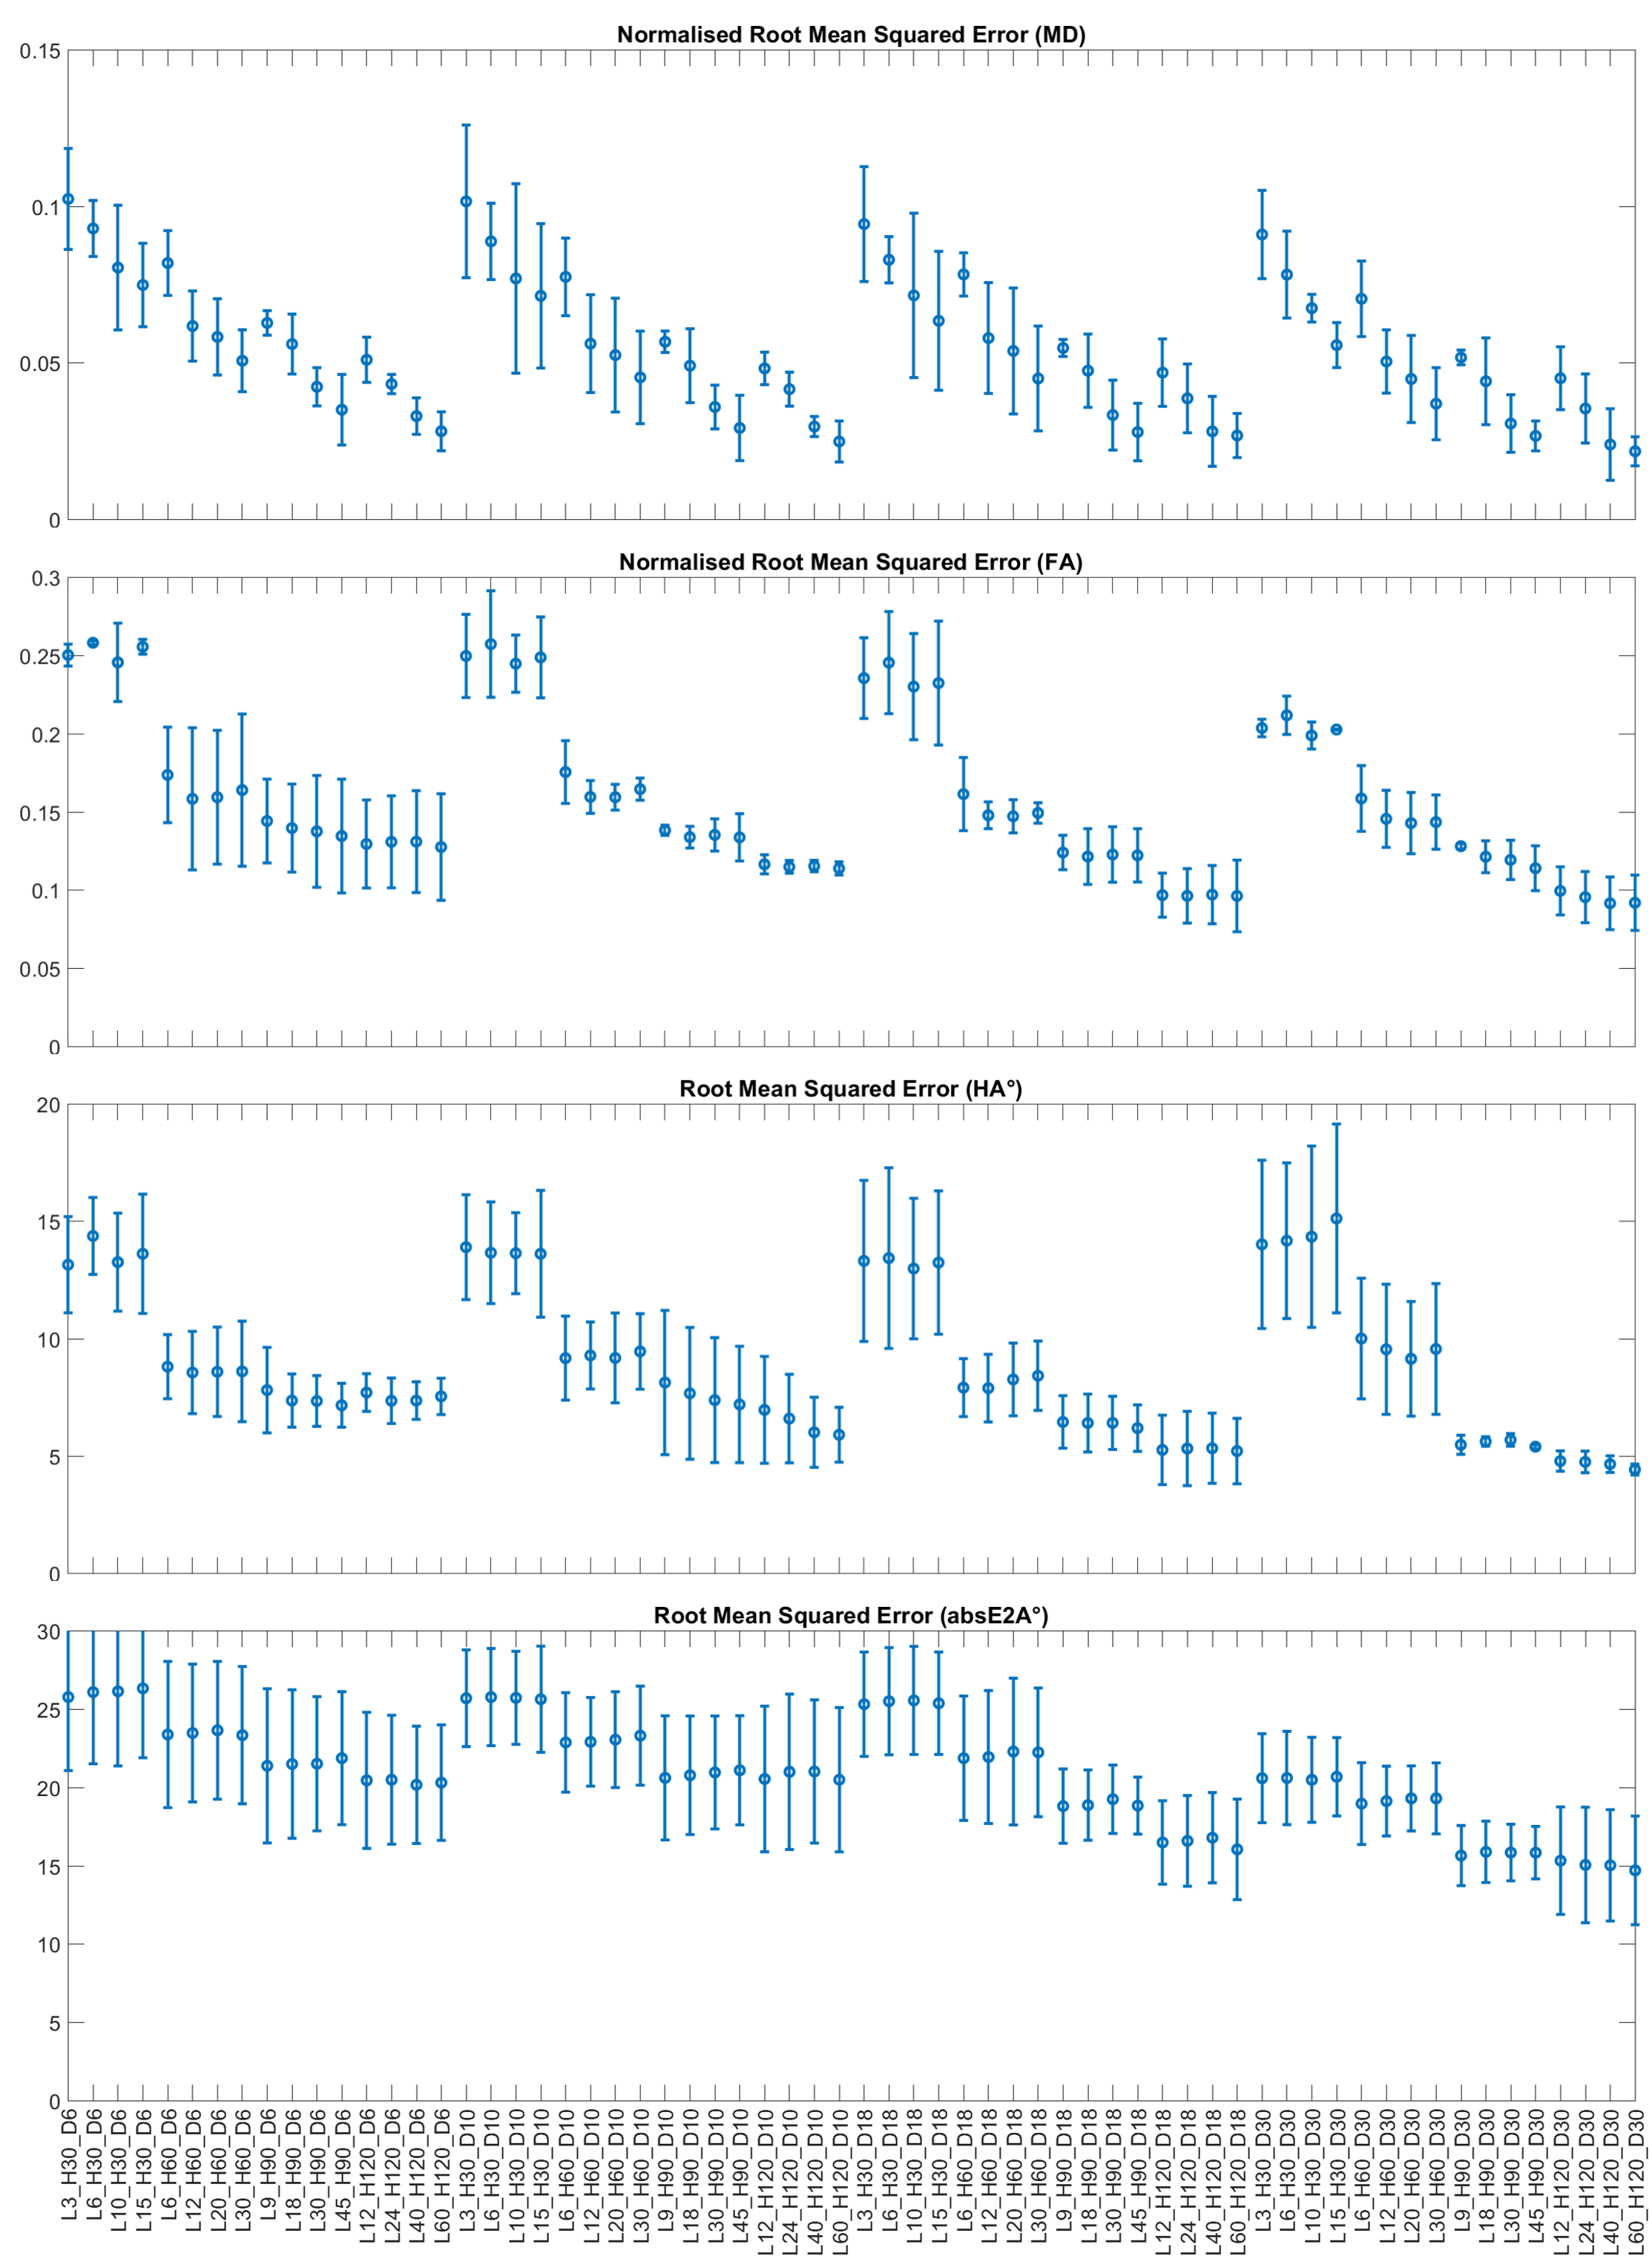
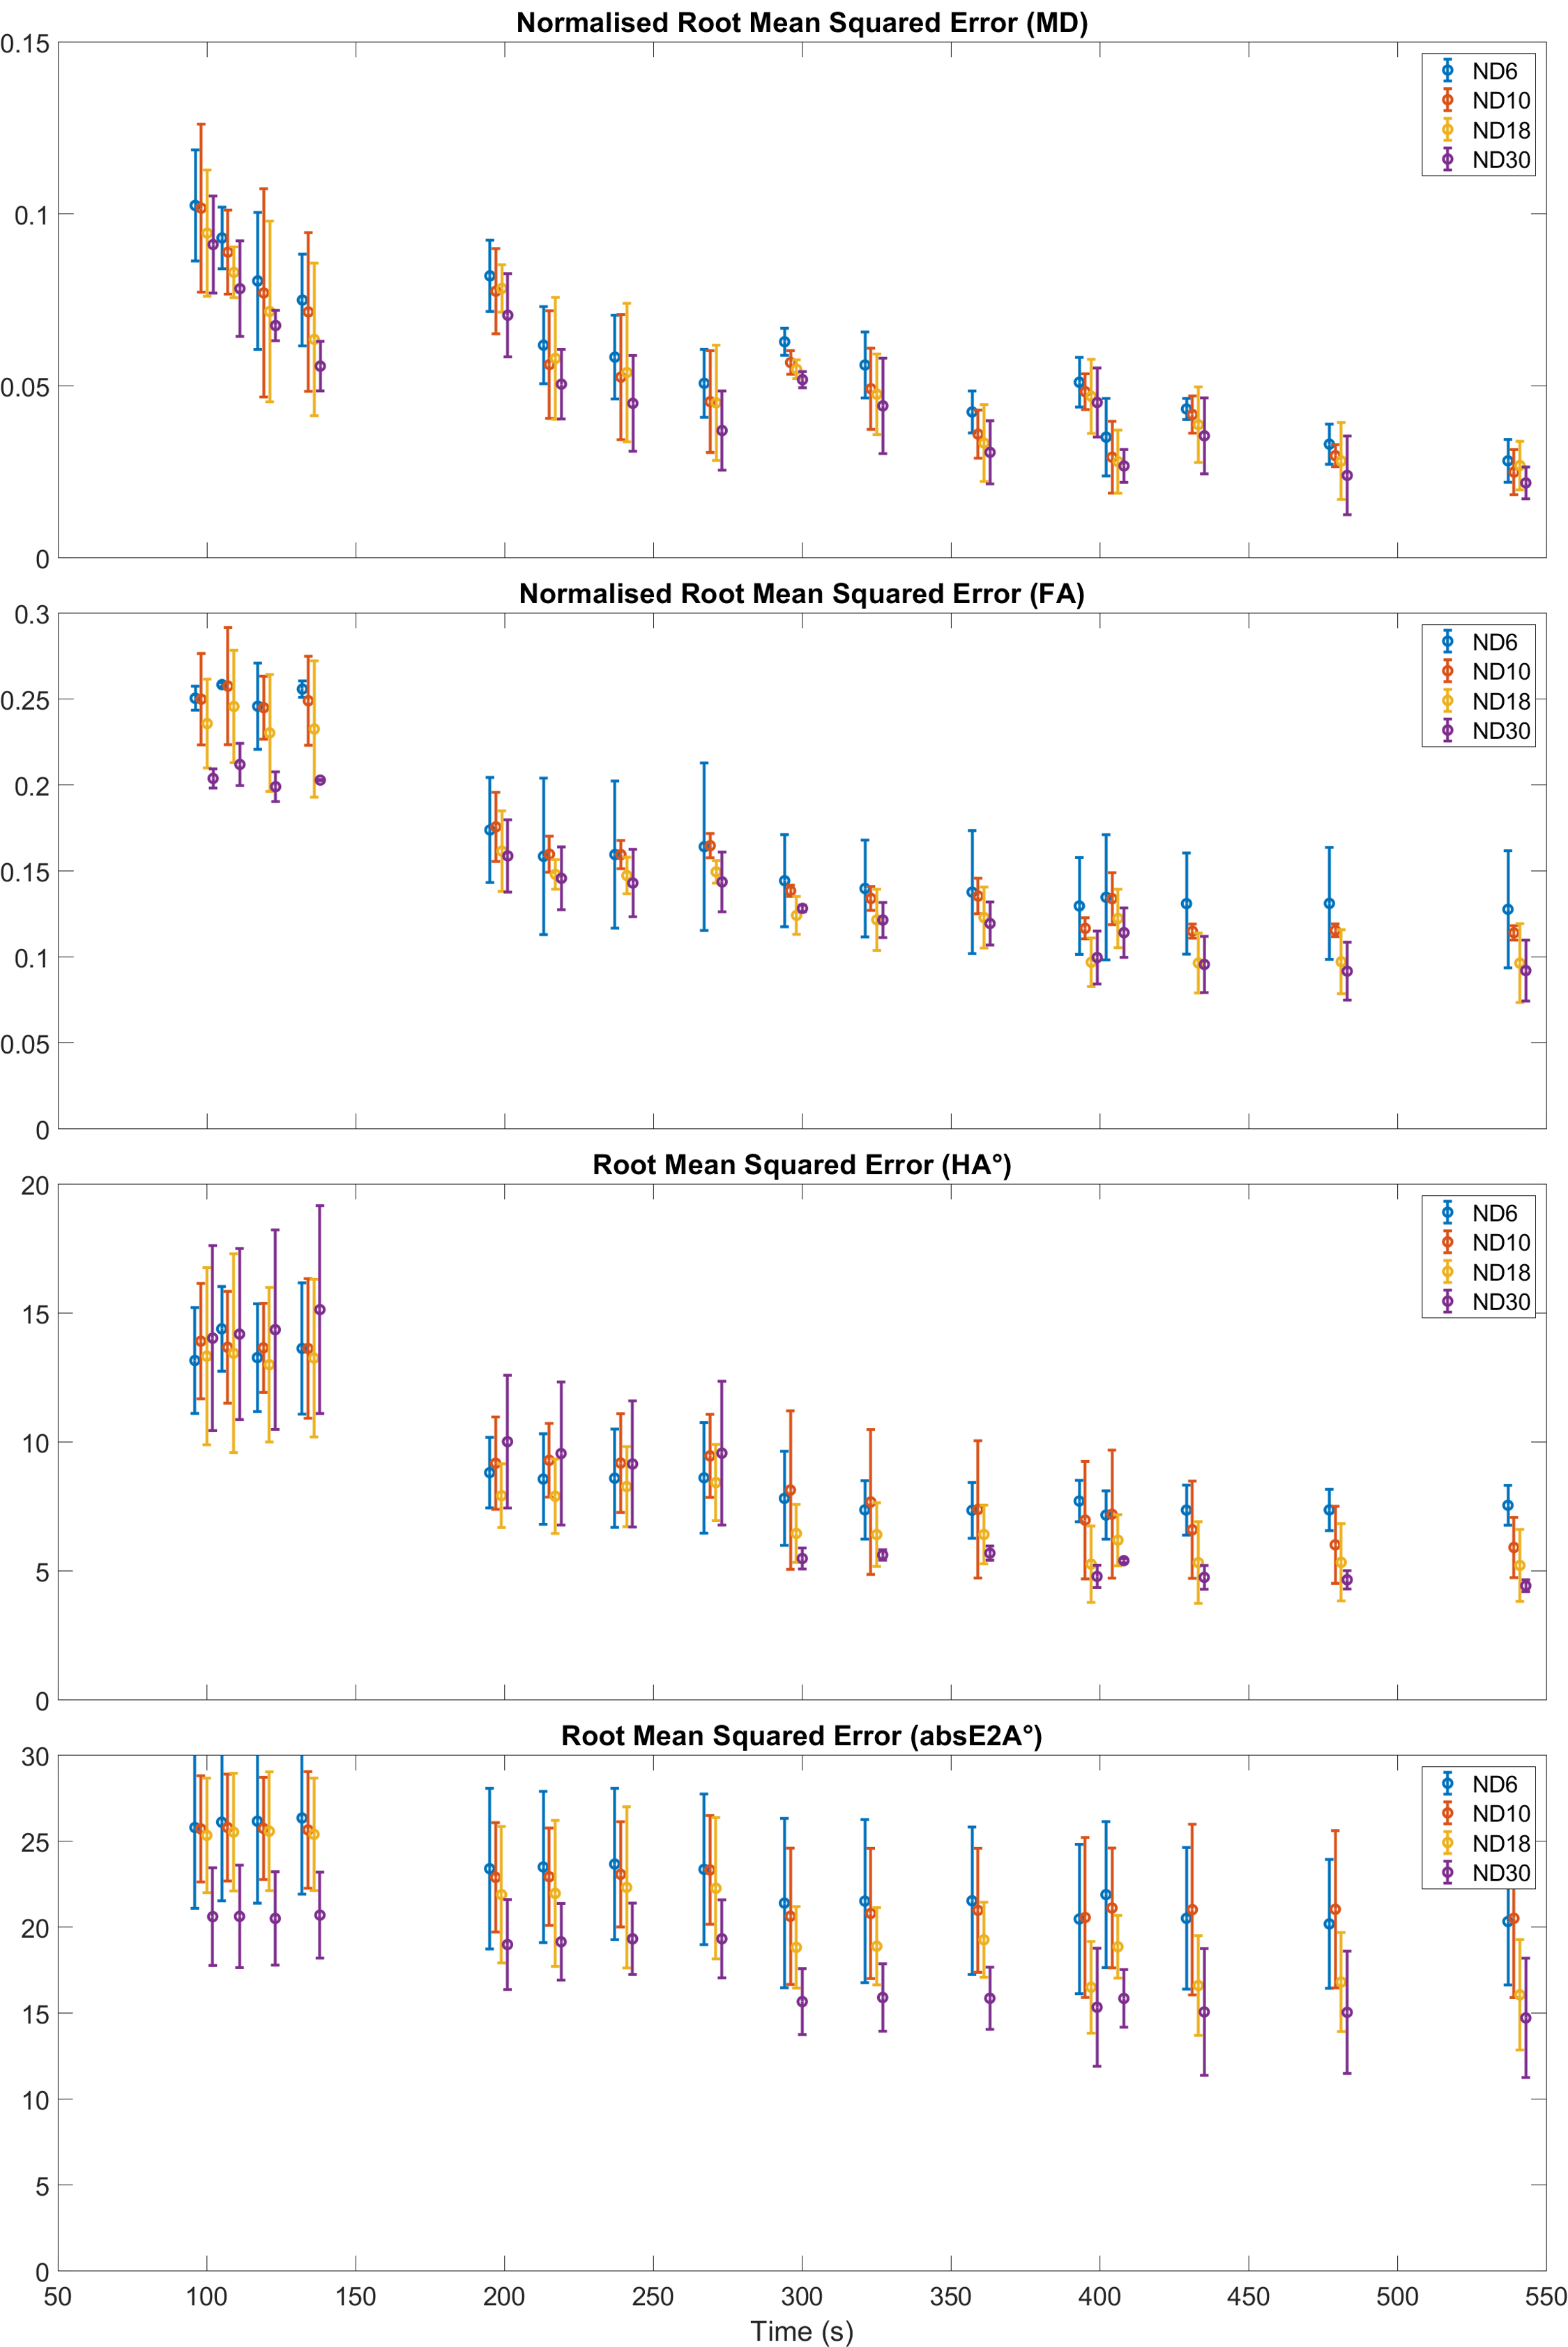
Representative MD, FA, HA and absE2A maps based on a selection of subsampled datasets are given in Figure 1, along with difference maps with respect to fully sampled reference data. RMSE and NRMSE data of the DTI parameter maps are given in Figures 2 and 3. For brevity, each dataset is denoted by the number of b50 acquisitions (L), number of b500 acquisitions (H) and number of DW directions at b500 (D), e.g. L72_H408_D30 for fully sampled data. Assuming a heart rate of 60 bpm and based on minimising RMSE, the optimal acquisition under 7 minutes was L12_H120_D30 with NRMSE(MD) = 4.5 ± 1.0%, NRMSE(FA) = 10.0 ± 1.5%, RMSE(HA) = 4.8 ± 0.4°, RMSE(absE2A) = 15.3 ± 3.4°, time = 396 s (mean ± SD across subjects). Where a modest increase in RMSE could be tolerated, an acquisition under 5 minutes (L9_H90_D30) would be feasible, where NRMSE(MD) = 5.2 ± 0.2%, NRMSE(FA) = 12.8 ± 0.2%, RMSE(HA) = 5.5 ± 0.4°, RMSE(absE2A) = 15.7 ± 1.9°, time = 297 s.Discussion
In healthy volunteers, we observed that increasing NAb500 from 30 to 120 reduced RMSE non-linearly across parameters, at the expense of acquisition time. Increasing NAb50 had greatest impact on RMSE(MD), but marginal effects on FA, HA and absE2A. For the same acquisition time, increasing the number of DW directions NDb500 generally led to reduced RMSE in all parameters, subject to a minimum number of repetitions (i.e. 3 repetitions for NDb500 = 30). This would suggest an experimental design strategy that maximises ND, subject to a minimum SNR requirement on a per DW direction basis mitigated by increasing NA. In practical terms, a scan time of 6m 36s could be achieved whilst keeping NRMSE(MD) and NMRSE(FA) to within 5% and 10% respectively. This would be a reasonable compromise given that the within-group variation in MD and FA reported in healthy volunteers can range from 1.4% to 18.4% and from 8.3% to 23.7% respectively2, 3, 9. Where scan time is limited, as is often the case when seeking to scan large cohorts of patients, then scan time could be reduced to 4m 57s with modest increase in RMSE. Future work will include patient subjects with varying degrees of body habitus to validate the proposed optimized protocol.Acknowledgements
This work was supported by the British Heart Foundation, UK (PG/19/1/34076, SI/14/1/30718, FS/13/71/30378). CN and JES are joint senior authors.References
1. Das A, Kelly C, Teh I, Stoeck CT, Kozerke S, Chowdhary A, Brown LAE, Saunderson CED, Craven TP, Chew PG, Jex N, Swoboda PP, Levelt E, Greenwood JP, Schneider JE, Plein S and Dall'Armellina E. Acute Microstructural Changes after ST-Segment Elevation Myocardial Infarction Assessed with Diffusion Tensor Imaging. Radiology. 2021;299:86-96.
2. Gotschy A, von Deuster C, van Gorkum RJH, Gastl M, Vintschger E, Schwotzer R, Flammer AJ, Manka R, Stoeck CT and Kozerke S. Characterizing cardiac involvement in amyloidosis using cardiovascular magnetic resonance diffusion tensor imaging. Journal of cardiovascular magnetic resonance : official journal of the Society for Cardiovascular Magnetic Resonance. 2019;21:56.
3. Das A, Chowdhary A, Kelly C, Teh I, Stoeck CT, Kozerke S, Maxwell N, Craven TP, Jex NJ, Saunderson CED, Brown LAE, Ben-Arzi H, Sengupta A, Page SP, Swoboda PP, Greenwood JP, Schneider JE, Plein S and Dall'Armellina E. Insight Into Myocardial Microstructure of Athletes and Hypertrophic Cardiomyopathy Patients Using Diffusion Tensor Imaging. Journal of magnetic resonance imaging : JMRI. 2020.
4. Ariga R, Tunnicliffe EM, Manohar SG, Mahmod M, Raman B, Piechnik SK, Francis JM, Robson MD, Neubauer S and Watkins H. Identification of Myocardial Disarray in Patients With Hypertrophic Cardiomyopathy and Ventricular Arrhythmias. J Am Coll Cardiol. 2019;73:2493-2502.
5. Nielles-Vallespin S, Khalique Z, Ferreira PF, de Silva R, Scott AD, Kilner P, McGill LA, Giannakidis A, Gatehouse PD, Ennis D, Aliotta E, Al-Khalil M, Kellman P, Mazilu D, Balaban RS, Firmin DN, Arai AE and Pennell DJ. Assessment of Myocardial Microstructural Dynamics by In Vivo Diffusion Tensor Cardiac Magnetic Resonance. J Am Coll Cardiol. 2017;69:661-676.
6. McClymont D, Teh I and Schneider JE. The impact of signal-to-noise ratio, diffusion-weighted directions and image resolution in cardiac diffusion tensor imaging - insights from the ex-vivo rat heart. Journal of cardiovascular magnetic resonance : official journal of the Society for Cardiovascular Magnetic Resonance. 2017;19:90.
7. Cook PA, Symms M, Boulby PA and Alexander DC. Optimal acquisition orders of diffusion-weighted MRI measurements. Journal of Magnetic Resonance Imaging. 2007;25:1051-1058.
8. Klein S, Staring M, Murphy K, Viergever MA and Pluim JP. elastix: a toolbox for intensity-based medical image registration. IEEE transactions on medical imaging. 2010;29:196-205.
9. Nguyen CT, Christodoulou AG, Coll-Font J, Ma S, Xie Y, Reese TG, Mekkaoui C, Lewis GD, Bi X, Sosnovik DE and Li D. Free-breathing diffusion tensor MRI of the whole left ventricle using second-order motion compensation and multitasking respiratory motion correction. Magnetic resonance in medicine : official journal of the Society of Magnetic Resonance in Medicine / Society of Magnetic Resonance in Medicine. 2021;85:2634-2648.
Figures