1665
Strain-free in-vivo time dependent diffusion measures in the myocardium: A potential new biomarker ?1Department of Aeronautics, Imperial College of London, London, United Kingdom, 2Cardiovascular Magnetic Resonance Unit, Royal Brompton Hospital, London, United Kingdom, 3National Heart and Lung Institute, Imperial College London, London, United Kingdom
Synopsis
Diffusion tensor cardiovascular magnetic resonance (DT-CMR) has proved to be a unique non-invasive method to investigate the myocardial microstructure. The time dependence of the diffusion tensor provides insights into the barriers that restrict free diffusion. We present a method to assess the time dependence of diffusion in the beating heart along with numerical simulations that demonstrate the sensitivity of this potential new biomarker to changes in myocardial microstructure including membrane permeability, extracellular volume fraction and cell hypertrophy.
Introduction
The time dependence of the apparent diffusivity measured in MR has provided interesting insights into pathologies within a number of organs[1] [2]. Diffusion tensor cardiovascular MR (DT-CMR) is able to provide measures of myocardial microstructure despite the heart’s highly mobile nature[3] [4]. However, the ability to use the time dependence of DT-CMR measures in-vivo is hampered by this motion and the effects of cyclical strain on DT-CMR results[5]. In this work, we minimise the effects of strain on in-vivo diffusion-time DT-CMR by measuring diffusion over multiples of the cardiac cycle duration. We explore the potential sensitivity utility of this potential new imaging biomarker to microstructural changes using histology-based Monte Carlo random walk simulations[6].Methods
Based on Reese et al.[5], we assume strain << 1, a time-invariant diffusion tensor and diffusion times ($$$\Delta$$$) as non-zero integer multiples (N) of the cardiac cycle. The strain-affected diffusivities are then independent of N and the differences in DT-CMR parameters between cardiac cycles are only influenced by $$$\Delta$$$.We performed in-vivo DT-CMR in a single mid-ventricular slice in three healthy human hearts and three fresh ex-vivo pig hearts. Acquisitions were performed using a Siemens Vida 3T and a single-shot STEAM EPI sequence with both $$$\Delta=1RR$$$ and $$$\Delta=2RR$$$ intervals. $$$TR=2\Delta$$$ ensuring that the signal to noise ratio (SNR) lost due to $$$T1$$$ when increasing $$$\Delta$$$ was partially recovered. $$$8/30$$$ averages at b= $$$600s/ms^{2}$$$ and $$$2/6$$$ averages at b= $$$200s/ms^{2}$$$ were acquired in-vivo/ex-vivo with 6 diffusion encoding directions. In-vivo acquisitions were triggered to peak systole and acquired during breath-holding. Data were acquired at $$$3.3x3.3x10 mm^3$$$ resolution, field of view $$$360x100 mm^2$$$, $$$TE=29 ms$$$.
To study the time dependency of DT-CMR on several key microstructural features, we perform Monte Carlo random walk simulations in a histology-based domain using the STEAM sequence used experimentally. We consider the effects of varying extracellular volume fraction (ECV), intra- and extracellular diffusivity and cellular hypertrophy with two extreme permeability coefficients ($$$\kappa=0.0$$$ and $$$0.05μm/ms$$$). Each of these factors has been studied in the range of ($$$700ms<∆<2400ms$$$) to account for inter-subject variations in heart rate. A more detailed analysis was performed for a wider range of ECV and permeabilities covering expected values in human cardiomyocytes[7,9]. The numerical simulations utilise the histology-based domain illustrated in Figure 1. ECV is varied by thickening the cells and permeability was modelled using the transit method published by Fieremans et. al[9]. The b-values and diffusion encoding directions were selected to match those used experimentally.
Results
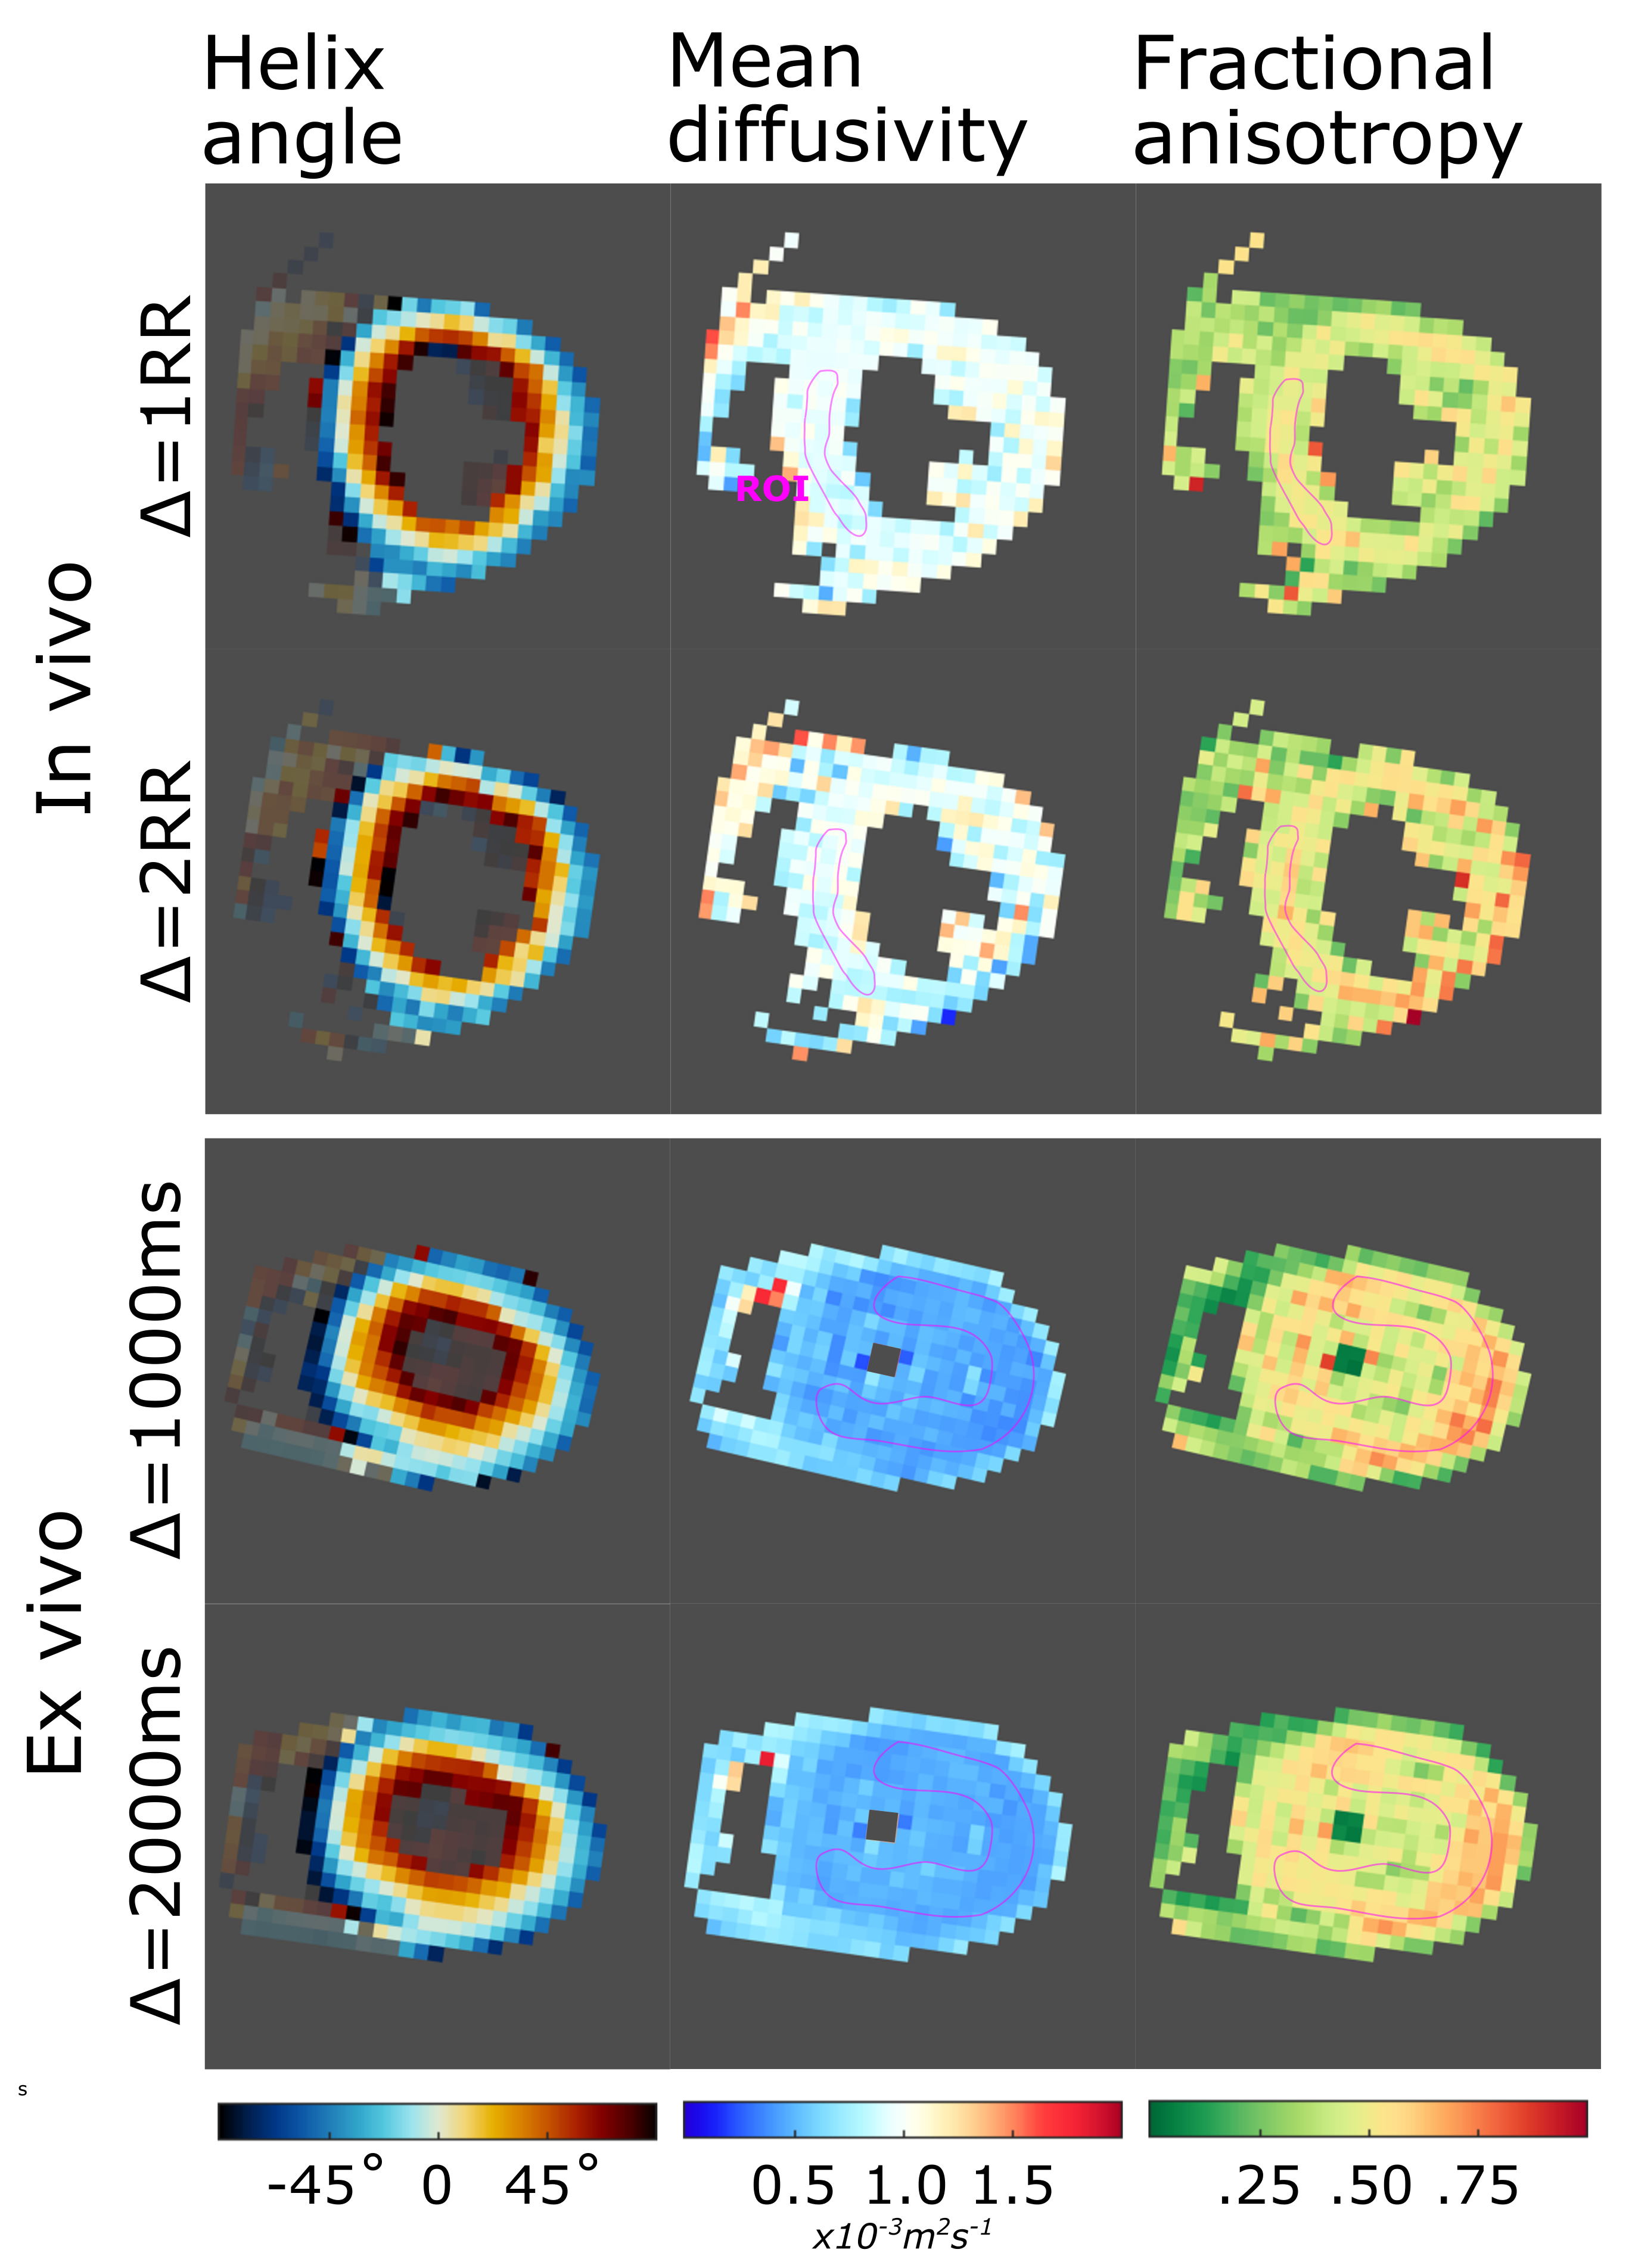
Figures 2 and 3 show the ratio of fractional anisotropy (FA) and mean diffusivity (MD) at $$$\Delta=2RR$$$ and $$$\Delta=1RR$$$ intervals for two extreme permeability conditions. While for impermeable membranes the MD and FA ratios are dependent on ECV, heart rate and, to a lesser extent, intra and extracellular diffusivity, for highly permeable membranes both ratios are close to 1 in all of these tests. Figure 4 illustrates the dependence of the MD and FA ratios on membrane permeability and ECV. The values obtained experimentally (see examples in Figure 5) are superimposed on the plot.Discussion and Conclusions
The fractional anisotropy (FA) and the mean diffusivity (MD) measure the degree of anisotropy and the time normalised average distances diffused by water molecules respectively. For impermeable membranes, we observe a dependence of the ratio between MD and FA at $$$2RR$$$ intervals and $$$1RR$$$ interval due to the greater number of interactions of the diffusing water molecules with the cell membranes. We demonstrate that the FA and MD ratios begin to substantially deviate from 1 (10%−15% changes) for $$$\kappa_{lim}<0.002μm/ms$$$ corresponding to exchange times ($$$\tau_{ex}=937.5 ms$$$) approximating the diffusion time ($$$\Delta=1000ms$$$) for the first $$$RR$$$ interval. We conclude that the MD and FA ratio show a measurable deviation from $$$1$$$ when $$$\tau_{ex}/\Delta<1$$$. The water exchange time ($$$\tau_{ex}$$$) is inversely proportional to $$$\kappa$$$ and directly proportional to ECV which explains the strong dependency depicted in Figure 4 for low permeability values.In experimental studies, we successfully performed DT-CMR using a STEAM sequence with $$$\Delta$$$=$$$1RR$$$ interval and with $$$\Delta$$$=$$$2RR$$$ intervals both in and ex vivo. While existing models of the effects of cyclical strain on the measured diffusion tensor may be inadequate to accurately describe the effects of strain in restricted anisotropic media[10], our findings of FA and MD ratios ($$$\approx 1$$$) are consistent with minimal strain effects on these ratios. The FA ratios $$$>1$$$ measured experimentally are likely due to the reduced SNR in the 2RR data, resulting in elevated FA via eigenvalue repulsion[11-12]. In future work, this effect may be minimised by matching the SNR between $$$\Delta$$$ = $$$1RR$$$ and $$$\Delta=2RR$$$ data. From our numerical results, we show that any membrane with a permeability higher than $$$\kappa_{lim}=0.002μm/ms$$$ is sufficient to maintain constant MD and FA values for long diffusion times $$$\Delta>700ms$$$ coinciding with the lower bound for permeable cells[10]. These findings are also in accordance with the experimental results observed by Kim et al.[1]. While the MD and FA ratios acquired with $$$\Delta=1RR$$$ and $$$\Delta=2RR$$$ intervals do not appear to provide useful sensitivity to changes in the myocardial microstructure, these parameters could serve as a possible biomarker to study the effectiveness of aquaporin inhibitors or to better understand permeability-related diseases[13].
Acknowledgements
This work was supported by BHF programme grant number RG/19/1/34160References
[1] Sungheon Kim et al. “Dependence on diffusion time of apparent diffusion tensor of ex vivo calf tongue and heart”. In: Magnetic Resonance in Medicine (2005)
[2] Josef Pfeuffer et al. “Restricted diffusion and exchange of intracellular water: Theoretical modelling and diffusion time dependence of 1H NMR measurements on perfused glial cells”. In: NMR in Biomedicine (1998)
[3] Sonia Nielles-Vallespin et al. “Assessment of Myocardial Microstructural Dynamics by In Vivo Diffusion Tensor Cardiac Magnetic Resonance”. In: Journal of the American College of Cardiology (2017)
[4] Choukri Mekkaoui et al.Diffusion MRI in the heart. 2017.doi:10.1002/nbm.3426.[5]Timothy G. Reese, J. Van Wedeen, and Robert M. Weisskoff. “Measuring diffusion in the presence of material strain”. In: Journal of Magnetic Resonance - Series B112.3 (1996)
[5] Timothy G. Reese, J. Van Wedeen, and Robert M. Weisskoff. “Measuring diffusion in the presence of material strain”. In: Journal of Magnetic Resonance - Series B112.3 (1996)
[6] Jan N. Rose et al. “Novel insights into in-vivo diffusion tensor cardiovascular magnetic resonance using computational modelling and a histology-based virtual microstructure”. In: Magnetic Resonance in Medicine (2019)
[7] Otavio R. Coelho-Filho et al. “Quantification of cardiomyocyte hypertrophy by cardiac magnetic resonance: Implications for early cardiac remodelling”. In: Circulation 128.11(2013)
[8] Charles S. Landis et al. “Equilibrium transcytolemmal water-exchange kinetics in skeletal muscle in vivo”. In: Magnetic Resonance in Medicine (1999)
[9] Els Fieremans et al. “Monte Carlo study of a two-compartment exchange model of diffusion”. In: NMR in Biomedicine (2010)
[10] Pedro F. Ferreira et al. “Evaluation of the impact of strain correction on the orientation of cardiac diffusion tensors with in vivo and ex vivo porcine hearts”. In: Magnetic Resonance in Medicine (2018)
[11] Derek K. Jones and Peter J. Basser. “Squashing peanuts and smashing pumpkins”: How noise distorts diffusion-weighted MR data”. In: Magnetic Resonance in Medicine (2004)
[12] Andrew D. Scott et al. “The effects of noise in cardiac diffusion tensor imaging and the benefits of averaging complex data”. In: NMR in Biomedicine (2016)
[13] Mohammed Abir-Awan et al.Inhibitors of mammalian aquaporin water channels. 2019.
Figures