1662
Cine Image Based Cardiac Disease Classification Using Random Forest Classifier and Graph Based Deep Learning Approach1Medical University of South Carolina, Charleston, SC, United States, 2Siemens Healthcare, Princeton, NJ, United States, 3Johns Hopkins University, Baltimore, MD, United States, 4Siemens Healthcare, Charleston, SC, United States
Synopsis
Existing work demonstrates the value of image-based cardiovascular diagnosis with AI. We aimed to develop and test a machine learning algorithm for cardiovascular disease classification based on cine image datasets of 570 consecutive patients. Disease classification was performed using a random forest (RF) classifier and a disease classification network based on graph attention networks. The fully automated deep learning algorithm showed high accuracy for cardiac disease classification based on cine images only. Such algorithm has the potential to improve the efficiency of the reading process, especially by identifying and filtering out patients with normal cardiac anatomy and function.
Introduction
CMR plays a pivotal role in diagnostic decision making in patients with cardiovascular diseases. Current image analysis techniques are mostly reliant on qualitative visual assessment and crude quantitative measures of cardiac structure and function. In recent years, the wide availability of high computational power has triggered the development of artificial intelligence (AI) technologies in medical imaging. AI approaches to image-based diagnosis rely on algorithms that learn from past clinical examples through identification of hidden and complex imaging patterns [1]. Existing work demonstrates the value of image-based cardiovascular diagnosis with AI for several conditions [2-3]. In the current study, we aimed to develop and test a machine learning algorithm for cardiovascular disease classification based on cine image datasets.Methods
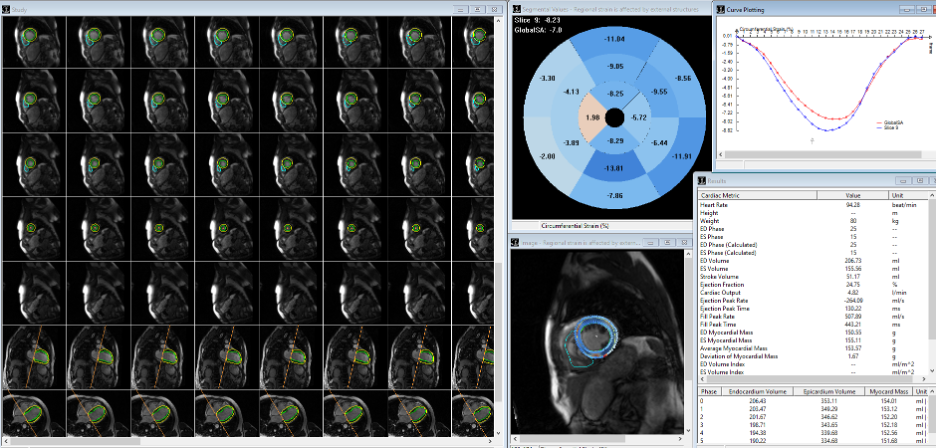
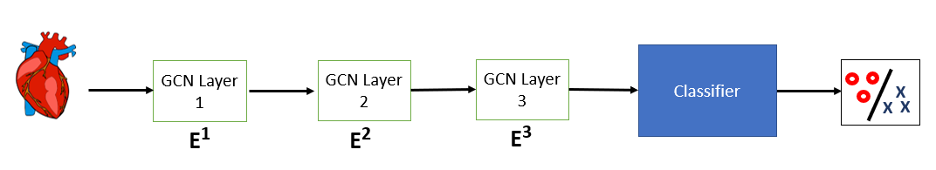
Image datasets of 570 consecutive patients who had previously undergone clinically indicated CMR at our institution were retrospectively identified. The cohort included normal patients (n=277), patients with dilated cardiomyopathy (DCM, n=77), hypertrophic CM (HCM, n=65), ischemic heart disease (IHD, n=134), and myocarditis (n=17). Expert annotation was performed by a reader with 12 years of experience in CMR and used as reference. Cine images in short and long axis were segmented using a DL approach [4] (Figure 1) and 26 volume, strain, and wall thickness measures were computed for the left and right ventricles. Disease classification was performed using a random forest (RF) classifier and a disease classification network (DCN) based on graph attention networks [5] (Figure 2). Three variations of the DCN were trained using: (i) a full set of 26 features from the DL method; (ii) a set of four features from the DL method (end-diastolic, end-systolic, stroke volumes, and ejection fraction); and (iii) the same four features from manual annotation. Both the RF and the DCNs were evaluated by five-fold cross-validation. Classification performance was assessed using receiver operating characteristic (ROC) curves and F1 score, which were calculated for each individual class.Results
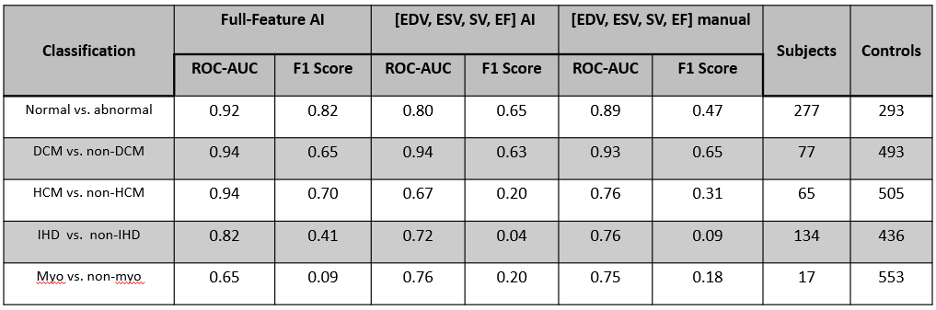
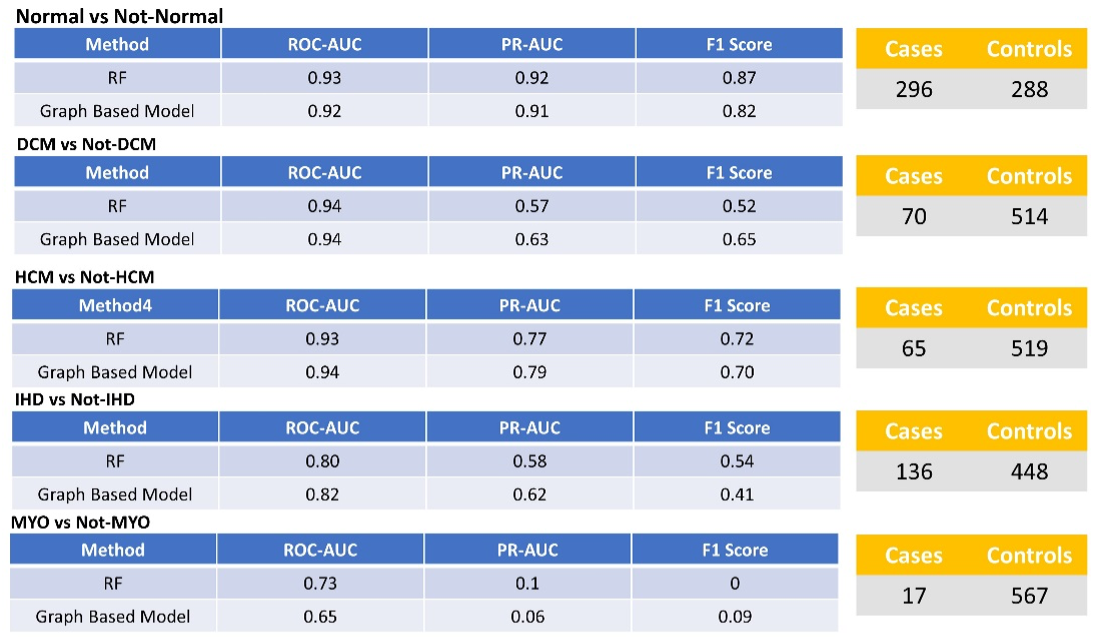
All 570 cases were successfully segmented using the fully automated algorithm. The full-feature DCN provided superior accuracy for disease identification represented by higher area under the curve (AUC) values and F1 scores compared to the partial feature DCN and manual-based DCN (Figure 3). The full-feature DCN was able to reach 0.92 AUC for the discrimination of patients from normal controls. Similar accuracy was found for the identification of patients with DCM and HCM (both AUCs 0.94). Slightly lower AUC (0.82) was found for IHD, likely due to the heterogeneity of imaging findings and limitations of the cine acquisition in this disease. The lowest AUC (0.65) was measured for myocarditis, likely due to unspecific cine features. The accuracy of disease classification was similar between the random forest and the graph based deep learning approaches (Figure 4). The random forest classifier was able to reach 0.93 AUC for the discrimination of patients from normal controls. AUCs with random forest for the identification of patients with DCM (0.94), HCM (0.93), IHD (0.80), and myocarditis (0.73) were similar to those achieved by the DCN.Conclusions
The fully automated deep learning algorithm shows high accuracy for cardiac disease classification based on cine images only. Such algorithm has the potential to improve the efficiency of the reading process, especially by identifying and filtering out patients with normal cardiac anatomy and function.Acknowledgements
No acknowledgement found.References
[1] Martin-Isla C, Campello VM, Izquierdo C, Raisi-Estabragh Z, Baeßler B, Petersen SE, Lekadir K. Image-Based Cardiac Diagnosis With Machine Learning: A Review. Front Cardiovasc Med. 2020 Jan 24;7:1. doi: 10.3389/fcvm.2020.00001. PMID: 32039241
[2] Leiner T, Rueckert D, Suinesiaputra A, Baeßler B, Nezafat R, Išgum I, Young AA. Machine learning in cardiovascular magnetic resonance: basic concepts and applications. J Cardiovasc Magn Reson. 2019 Oct 7;21(1):61. doi: 10.1186/s12968-019-0575-y. PMID: 31590664
[3] Ruijsink B, Puyol-Antón E, Oksuz I, Sinclair M, Bai W, Schnabel JA, Razavi R, King AP. Fully Automated, Quality-Controlled Cardiac Analysis From CMR: Validation and Large-Scale Application to Characterize Cardiac Function. JACC Cardiovasc Imaging. 2020 Mar;13(3):684-695. doi: 10.1016/j.jcmg.2019.05.030. Epub 2019 Jul 17. PMID: 31326477
[4] Chitiboi T, Georgescu B, Wetzl J, Borgohain I, Geppert C, Piechnik SK, Neubauer S, Petersen S, Sharma P. Deep Learning-based Strain Quantification from CINE Cardiac MRI. ISMRM 2020.
[5] Veličković P, Cucurull G, Casanova A, Romero A, Lio P, Bengio Y. Graph attention networks. arXiv preprint arXiv:1710.10903. 2017 Oct 30.
Figures