1649
Inversion Recovery Based Magnetization Transfer Mapping in the Human Myocardium In the presence of Incomplete Bound Pool Saturation at 3T
Sebastian Weingärtner1, Ömer Burak Demirel2, Qian Tao1, Joao Tourais1, and Mehmet Akcakaya2
1Department of Imaging Physics, Delft University of Technology, Delft, Netherlands, 2Department of Electrical and Computer Engineering and Center for Magnetic Resonance Research, University of Minnesota, Minneapolis, MN, United States
1Department of Imaging Physics, Delft University of Technology, Delft, Netherlands, 2Department of Electrical and Computer Engineering and Center for Magnetic Resonance Research, University of Minnesota, Minneapolis, MN, United States
Synopsis
Quantitative imaging of magnetization transfer (MT) may enable non-contrast assessment of myocardial scar and fibrosis. However, its application at 3T has so far been limited. In this work we investigate an inversion recovery based method for joint quantification of T1 and MT maps. A numerical binary spin-bath model is used to account for incomplete bound pool saturation in the presence of limited preparation durations. In vivo images were obtained with high visual map quality for both T1 and MT quantification, and comparable, low CoV across the two parameters (T1: 5.5+-0.6% and MT: 5.8+-0.9%).
Introduction
Information about the bound pool of water molecules obtained by imaging the magnetization transfer (MT) effect has demonstrated potential value in a number of clinical conditions. In cardiac MRI, MT imaging has shown promise to detect myocardial fibrosis without the use of an exogenous contrast agent. Multiple techniques have recently been proposed to obtain (semi-)quantitative MT information in the myocardium at 1.5T and have demonstrated good agreement with LGE imaging [1,2]. In these techniques magnetization contrast is commonly induced by the application of off-resonance pulses to saturate the bound pool. However, at high field strengths long preparation trains are often limited by the SAR, which in turn may limit the bound pool saturation and the dynamic range in MT mapping. Inversion recovery based MT imaging has previously been proposed to increase the dynamic range in MT mapping [3]. In this work we sought to study the feasibility of inversion recovery based MT mapping at 3T. Mixed free and MT saturated recovery was imaged using a combined saturation/inversion recovery sequence. To allow MT quantification in the presence of limited preparation times, numerical MT models were used to simulate incomplete bound pool saturation.Methods
A saturation pulse prepared heart-rate independent inversion recovery (SAPPHIRE [4]) sequence, was modified to incorporate MT saturated recovery after the inversion pulse, as shown in Figure 1. In this sequence the first image is acquired following MT preparation only. In successive heart-beats varying saturation/inversion times were used with a period of free T1 recovery following the saturation pulse, and MT saturated recovery following the inversion. A binary spin-bath (BSB) model with fixed bound pool properties was numerically simulated to capture the magnetization evolution after the inversion pulse, in the presence of a partially saturated bound pool [5]. A boud pool saturation rate of p = 1.7 Hz was assumed based on literature values [6]. This allowed for the extraction of a single MT parameter α jointly capturing bound pool properties, including the pool size and the exchange rate.In vivo imaging was performed using mixed MT contrast and conventional SAPPHIRE. Common sequence parameters were: FOV 300x300mm2, In-plane resolution 1.9x1.9mm2, slice-thickness 5mm, flip-angle 70deg, TE=1.13ms, bandwidth 1010Hz/px, breath-hold duration ~15s.Groupwise image registration was performed to correct for inter- and intra-breath-hold motion [7]. The numerical signal model was used in a voxel-wise four parameter fit to obtain joint T1 and MT maps. In-vivo images were acquired in three healthy volunteers (2 male, 1 female, 38±22 y/o) on a 3T scanner (Magnetom Prisma, Siemens Heathineers, Erlangen Germany). Coefficient of variability (CoV) maps were obtained based on numerically estimated gradients of the fit model and the fit residual [8]. T1 and MT parameters and the estimated CoV estimates were quantitatively evaluated in the septum using manually drawn ROIs.Results
The acquisition and processing pipeline for the proposed method is illustrated in Figure 2. Baseline images depict excellent inversion contrast as well as MT related contrast in the fully relaxed images and those with long inversion times (Figure 2), yielding T1 and MT maps of visually high quality. The resulting T1 maps depict a visually homogeneous myocardium and a sharp blood myocardial interface. MT maps show a low MT effect in the blood pool with α values close to 1. Substantially stronger MT effects are observed in the myocardium resulting in lower α values. Maps obtained in three subjects along with the CoV maps are displayed in Figure 3. Consistently high map quality is obtained for both parameters, and visually homogeneous quantification throughout the myocardium can be observed. CoV maps show largely homogenous variability with a trend of slightly higher variability in the lateral area. Quantitative evaluation of the septal ROIs shows average T1 times of 1480+-49ms and α 56.2+-4.8%. The average CoV was 5.5+-0.6% and 5.8+-0.9% for T1 and α, respectively.Discussion
Our results indicate that inversion recovery based MT mapping yields parameter maps of visually high image quality. A numerical model with four degrees of freedom was used to compensate for underestimation of MT effects due to incomplete bound pool saturation. However, fixed bound pool properties were assumed in this work. While alteration of bound pool properties would likely be reflected in the single MT parameter, enhanced models are required if a disentanglement of the factors contributing to MT (e.g. pool size, or bound pool relaxation times) is desired.Joint processing yields spatially co-registered T1 and MT maps in the proposed method. Native T1 times have also been reported as a potential marker for myocardial scar [9]. Thus, joint evaluation alongside MT parameters may increase diagnostic confidence and provide a promising path towards a non-contrast alternative to LGE imaging.Conclusion
SAPPHIRE based MT mapping may be a promising method to enable quantification of MT information in the myocardium at 3T. Visually high map quality of co-registered T1 and MT maps is obtained. The method presents a promising candidate for evaluation of myocardial scar and fibrosis without the need for contrast agents.Acknowledgements
S.W. acknowledges funding from the 4TU Precision Medicine program, an NWO Start-up STU.019.024, and ZonMW OffRoad 04510011910073. M.A.acknowledges funding from the NIH R01HL153146, NIH P41EB027061, NIH R21EB028369References
- Chong Duan, Yanjie Zhu, Jihye Jang, Jennifer Rodriguez, Ulf Neisius, Ahmed SFahmy, Reza Nezafat. Non-contrast myocardial infarct scar assessment using ahybrid native T 1 and magnetization transfer imaging sequence at 1.5T. Magn ResonMed. 2019;81(5):3192-3201. doi: 10.1002/mrm.27636.
- Karina López, Radhouene Neji, Aurelien Bustin, Imran Rashid, Reza Hajhosseiny,Shaihan J Malik, Rui Pedro A G Teixeira, Reza Razavi, Claudia Prieto, Sébastien Roujol,René M Botnar. Quantitative magnetization transfer imaging for non-contrastenhanced detection of myocardial fibrosis. Magn Reson Med. 2021;85(4):2069-2083.doi: 10.1002/mrm.28577.
- Silvia Mangia, Federico De Martino, Timo Liimatainen, Michael Garw ood, ShalomMichaeli. Magnetization transfer using inversion recovery during off-resonanceirradiation. Magn Reson Imaging. 2011;29(10):1346-50. doi:10.1016/j.mri.2011.04.002.
- Sebastian Weingärtner, Mehmet Akçakaya, Tamer Basha, Kraig V Kissinger, BethGoddu, Sophie Berg, Warren J Manning, Reza Nezafat. Combined saturation/inversion recovery sequences for improved evaluation of scar and diffuse fibrosis in patients with arrhythmia or heart rate variability. Magn Reson Med.2014;71(3):1024-34. doi: 10.1002/mrm.24761.
- R M Henkelman, X Huang, Q S Xiang, G J Stanisz, S D Swanson, M J Bronskill. Quantitative interpretation of magnetization transfer. Magn Reson Med. 1993 Jun;29(6):759-66. doi: 10.1002/mrm.1910290607.
- Gunther Helms, Gisela E Hagberg. In vivo quantification of the bound pool T1 in human white matter using the binary spin-bath model of progressive magnetization transfer saturation. Phys Med Biol. 2009 Dec 7;54(23):N529-40. doi: 10.1088/0031-9155/54/23/N01.
- Qian Tao, Pieternel van der Tol, Floris F Berendsen, Elisabeth H M Paiman, Hildo JLamb, Rob J van der Geest. Robust motion correction for myocardial T 1 andextracellular volume mapping by principle component analysis-based groupw iseimage registration. J Magn Reson Imaging. 2018;47(5):1397-1405. doi:10.1002/jmri.25863.
- Peter Kellman, Andrew E Arai, Hui Xue. T1 and extracellular volume mapping in the heart: estimation of error maps and the influence of noise on precision. J Cardiovasc Magn Reson. 2013 Jun 21;15(1):56. doi: 10.1186/1532-429X-15-56
- Dan Liu, Alessandra Borlotti, Dafne Viliani, Michael Jerosch-Herold, Mohammad Alkhalil, Giovanni Luigi De Maria, Gregor Fahrni, Sam Dawkins, Rohan Wijesurendra, Jane Francis, Vanessa Ferreira, Stefan Piechnik, Matthew D Robson, Adrian Banning, Robin Choudhury, Stefan Neubauer, Keith Channon, Rajesh Kharbanda, Erica Dall'Armellina. CMR Native T1 Mapping Allows Differentiation of Reversible Versus Irreversible Myocardial Damage in ST-Segment-Elevation Myocardial Infarction: An OxAMI Study (Oxford Acute Myocardial Infarction). Circ Cardiovasc Imaging. 2017 Aug;10(8):e005986. doi: 10.1161/CIRCIMAGING.116.005986.
Figures
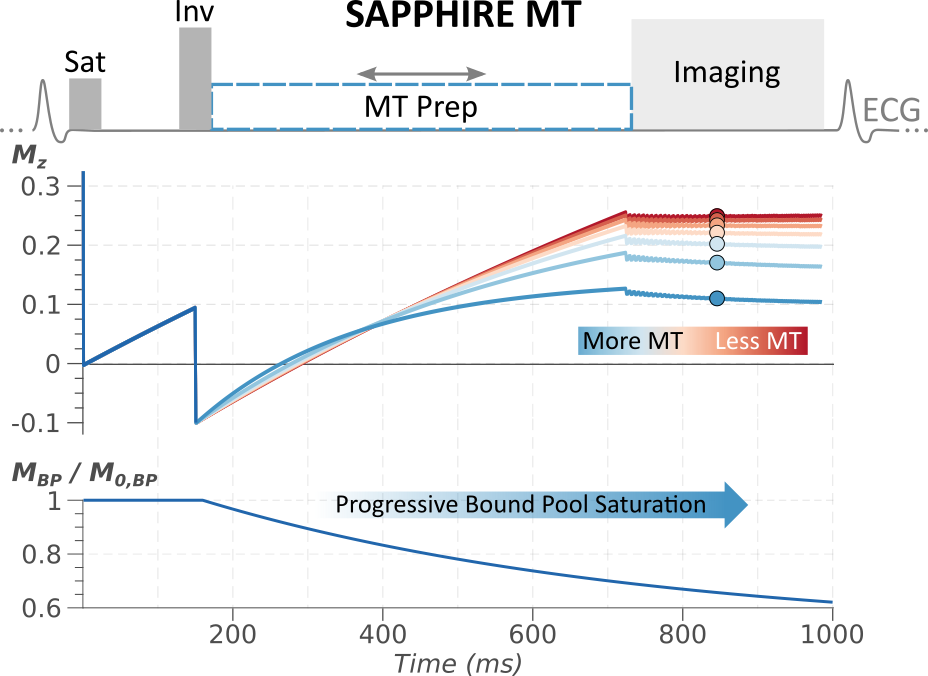
(a) Proposed mixed free relaxation/MT prepared SAPPHIRE sequence. The free pool magnetization is saturated at the detection for the R-wave followed by a period of free-relaxation. After a variable delay magnetization inversion is performed and subsequently MT saturated recovery is achieved using an MT preparation. Mz denotes the longitudinal magnetization of the free pool throughout the sequence scheme, for varying degrees of MT effects. MBP / M0,BP shows the progressive saturation of the bound pool during the application of the MT preparation.
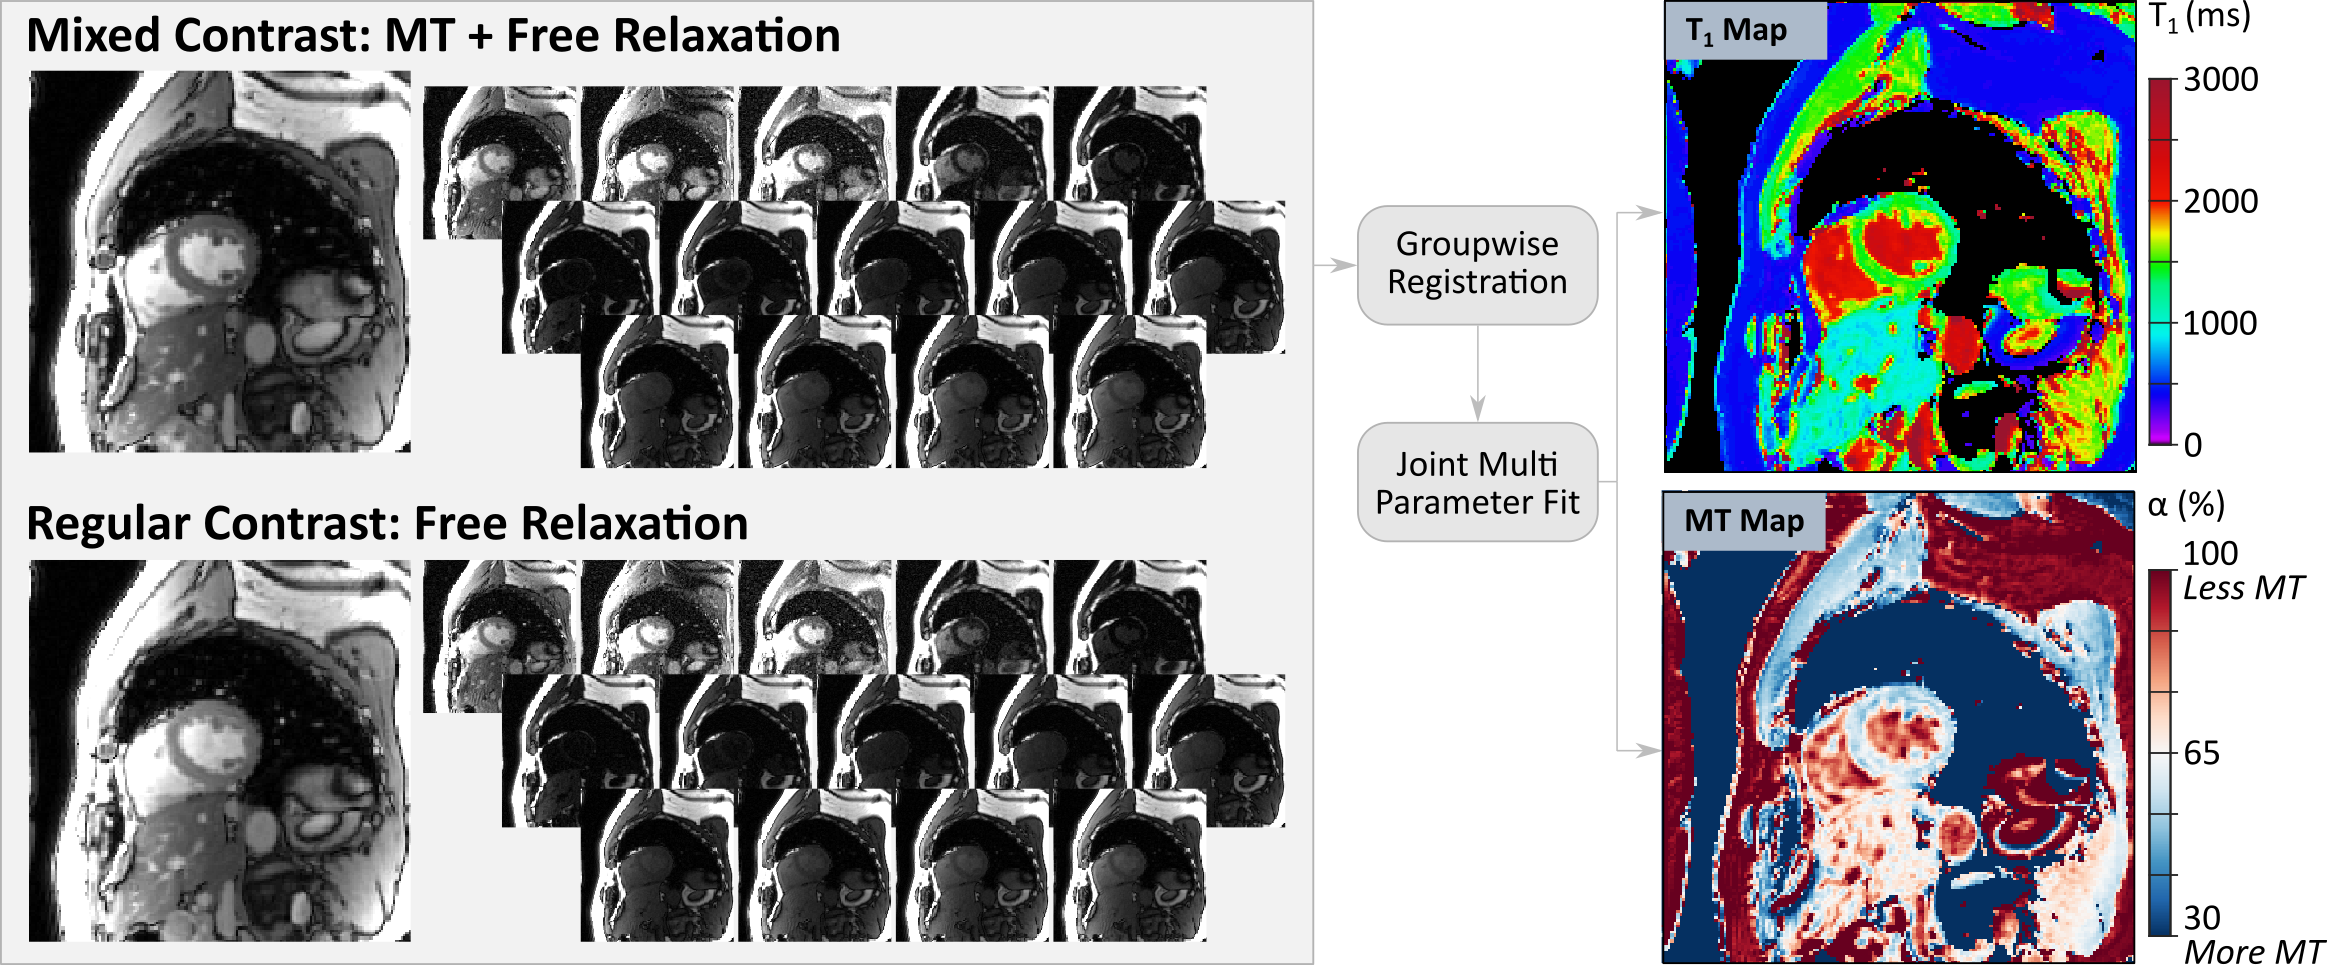
T1 and MT quantification in the proposed scheme is performed based on conventional and mixed contrast baseline images. Groupwise registration and multi-parameter fitting yield spatially coregistered T1 and α maps. Both parameter maps display a visually homogeneous myocardial signal with clear delineation against the blood pool.
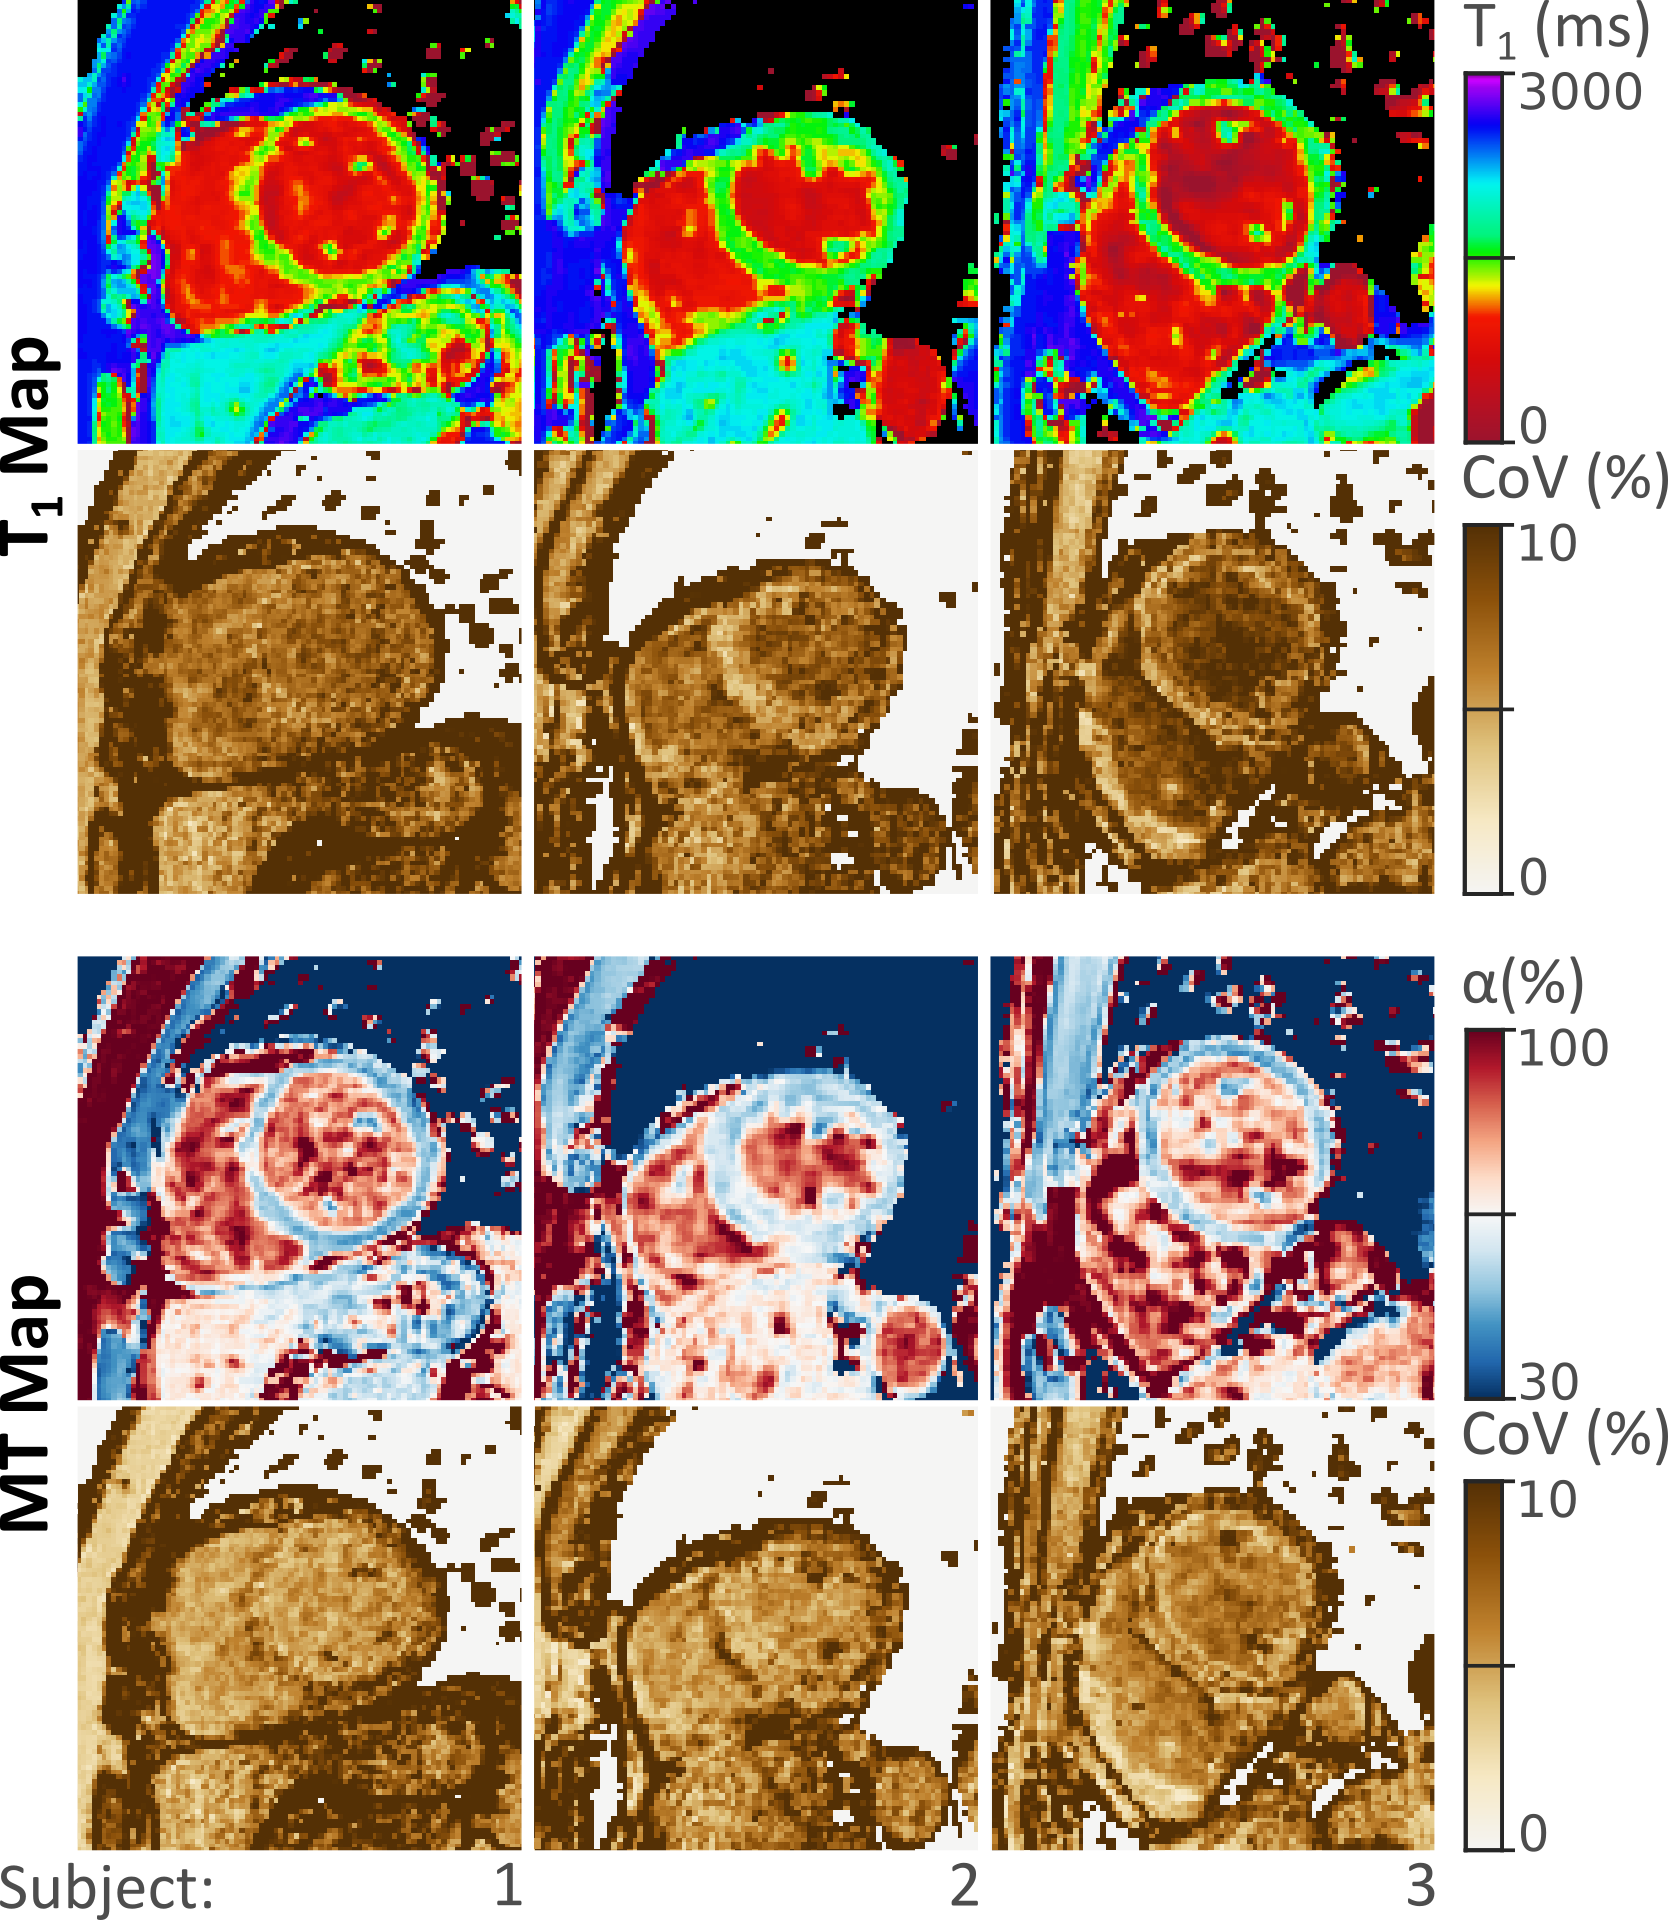
Jointly acquired parameter maps in 3 healthy subjects, along with corresponding coefficient of variability (CoV) maps. Both T1 and MT maps display homogeneous myocardial signals and largely constant variability throughout the myocardium. High α values in the blood pool indicate low MT effect, while marked MT is observed in the myocardial tissue.
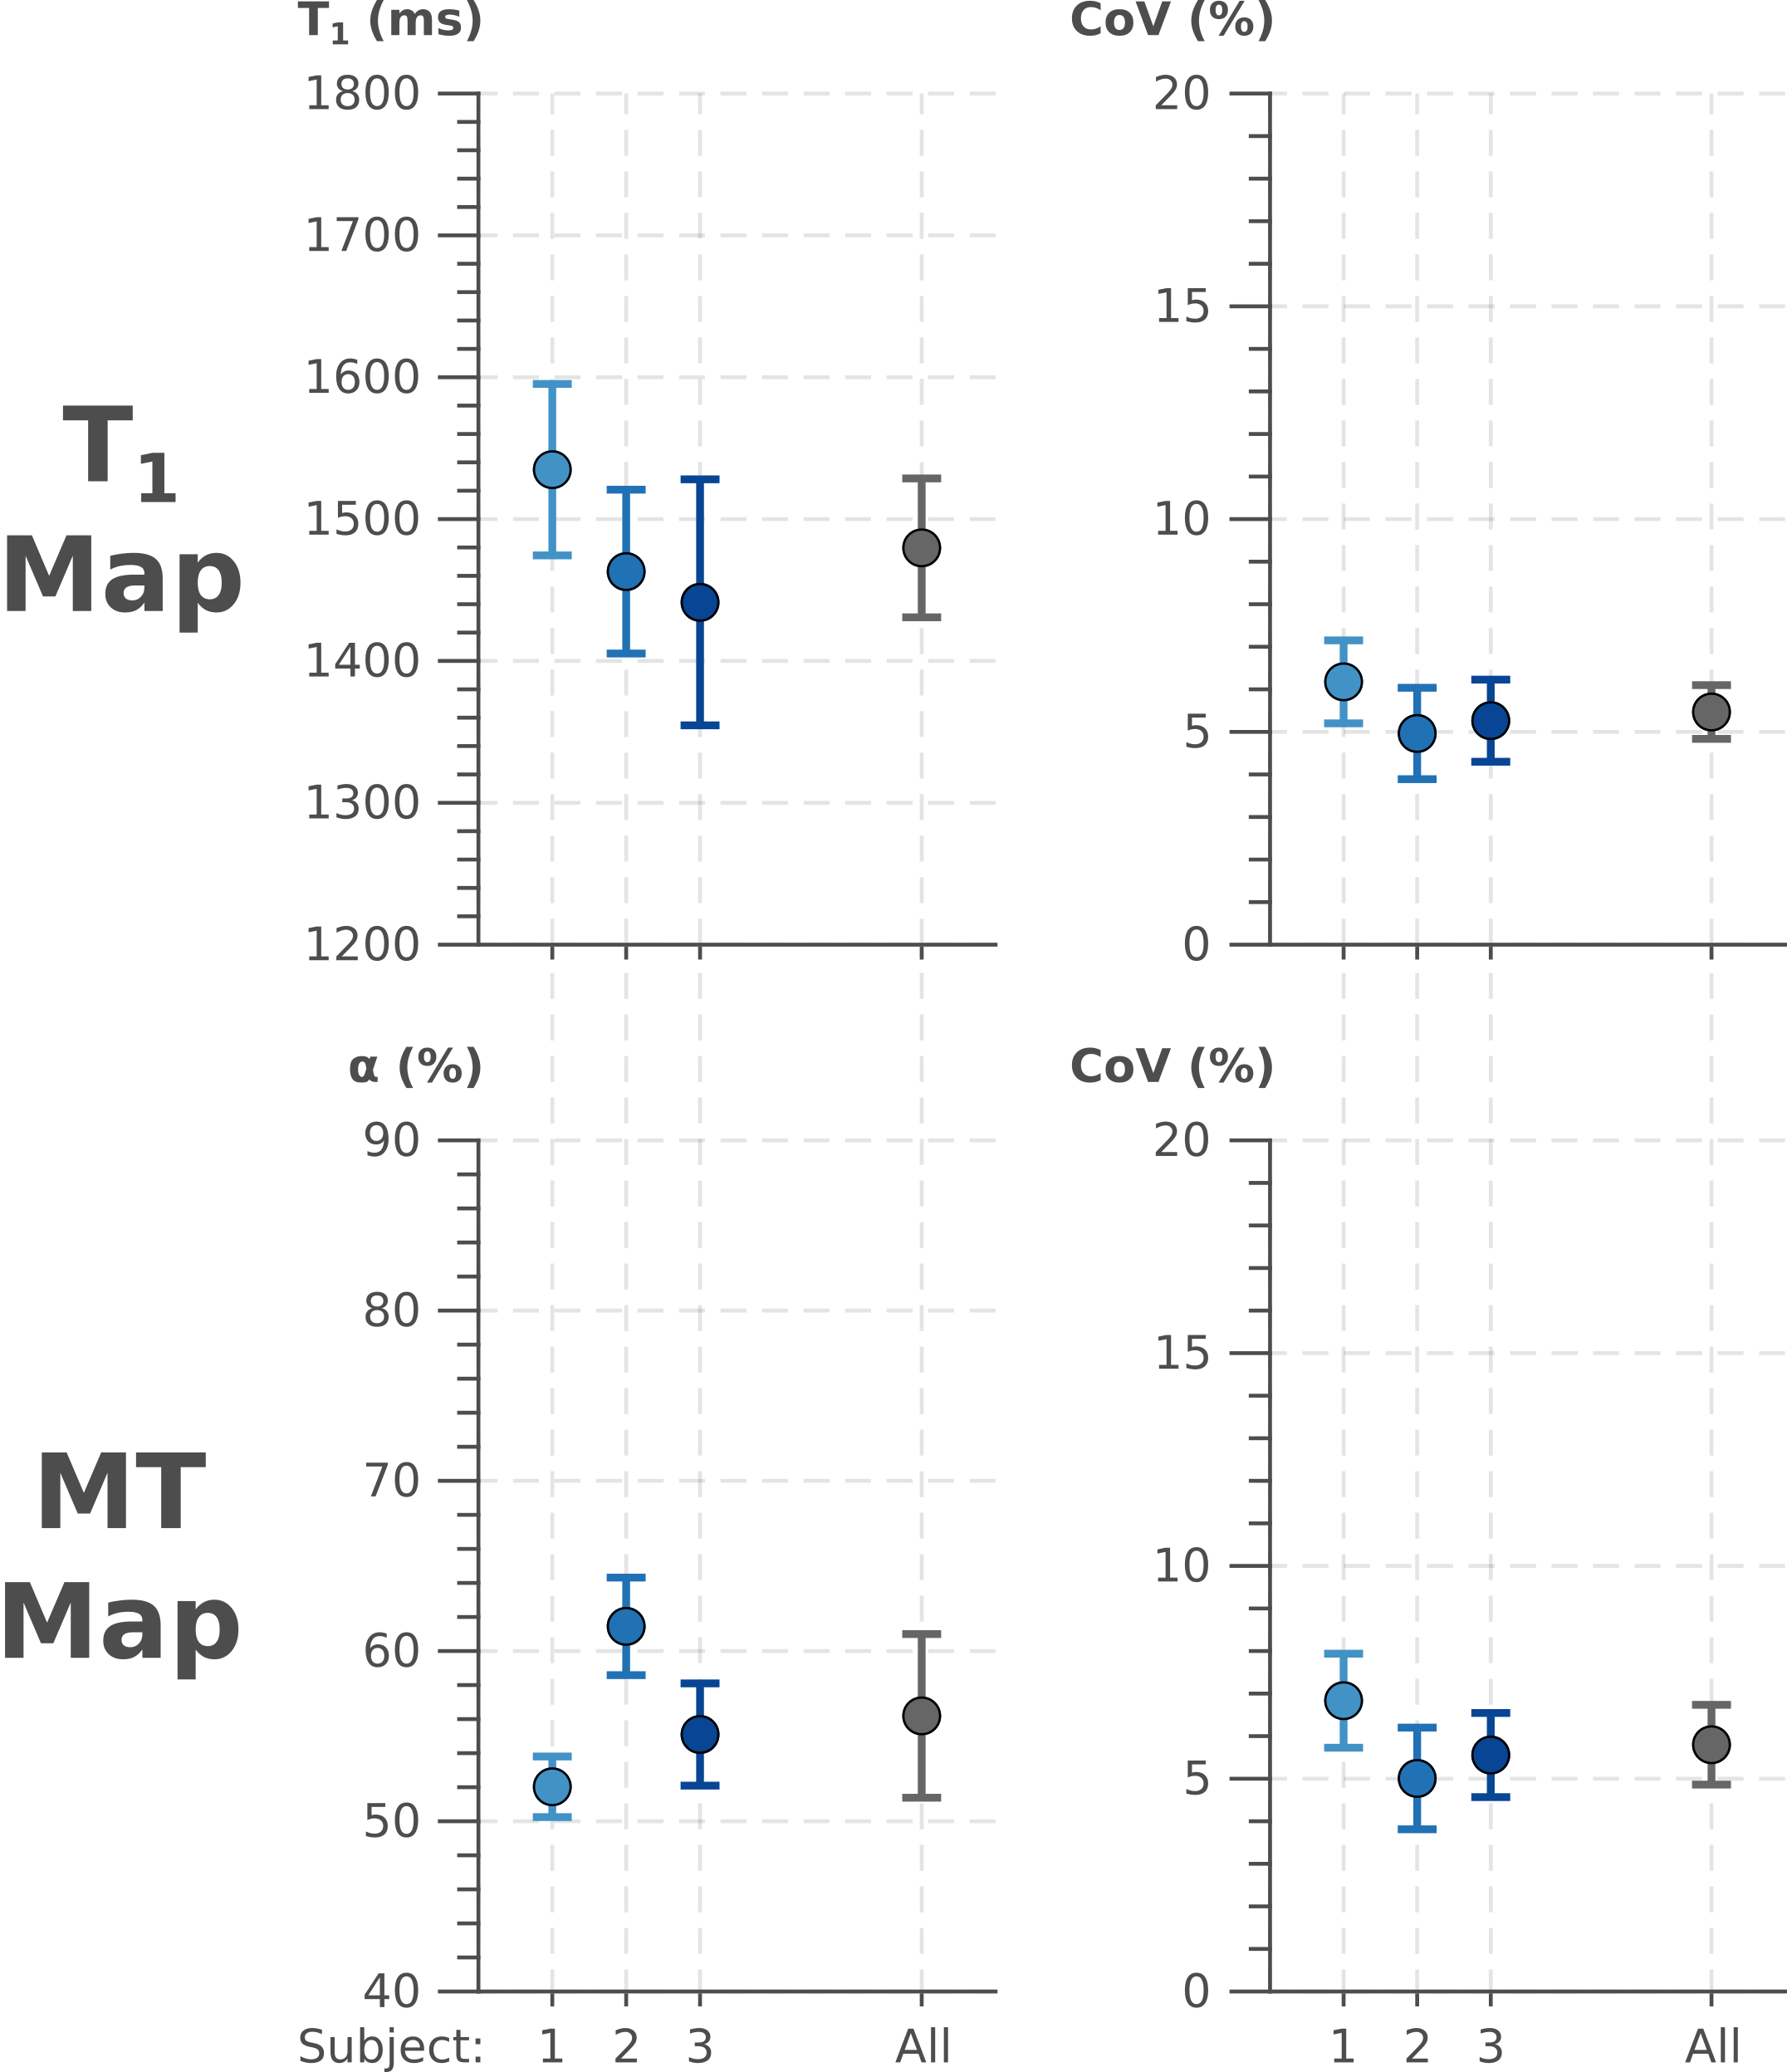
Quantitative analysis of T1 and MT values in the septal ROI of the three subjects. T1 times are in good agreement with previous reports. Both, T1 and α show very comparable CoV values.
DOI: https://doi.org/10.58530/2022/1649