1641
Myelin-sensitive microstructure modeling of white matter using diffusion-T1-T2-relaxation MRI1Clinical Sciences Lund, Medical Radiation Physics, Lund University, Lund, Sweden, 2Skåne University Hospital, Lund, Sweden, 3Clincial Sciences Lund, Diagnostic Radiology, Lund University, Lund, Sweden, 4Brigham and Women's Hospital, Harvard Medical School, Boston, MA, United States
Synopsis
White matter pathology is characterized by demyelination and axonal loss. Diffusion MRI and relaxometry cannot separate these processes because they are primarily sensitive to axons and myelin, respectively. We used diffusion-T1-T2-relaxation MRI with tensor-valued encoding to support a twelve-parameter microstructure model including myelin. Results yielded brain parameter maps and values of the axonal and myelin volume fractions and the g-ratio that were in accordance with previous results from histology. The proposed approach can theoretically disambiguate between demyelination and axonal loss and could thus become a valuable tool for assessing disease severity and treatment response in pathologies that affect white matter.
Introduction
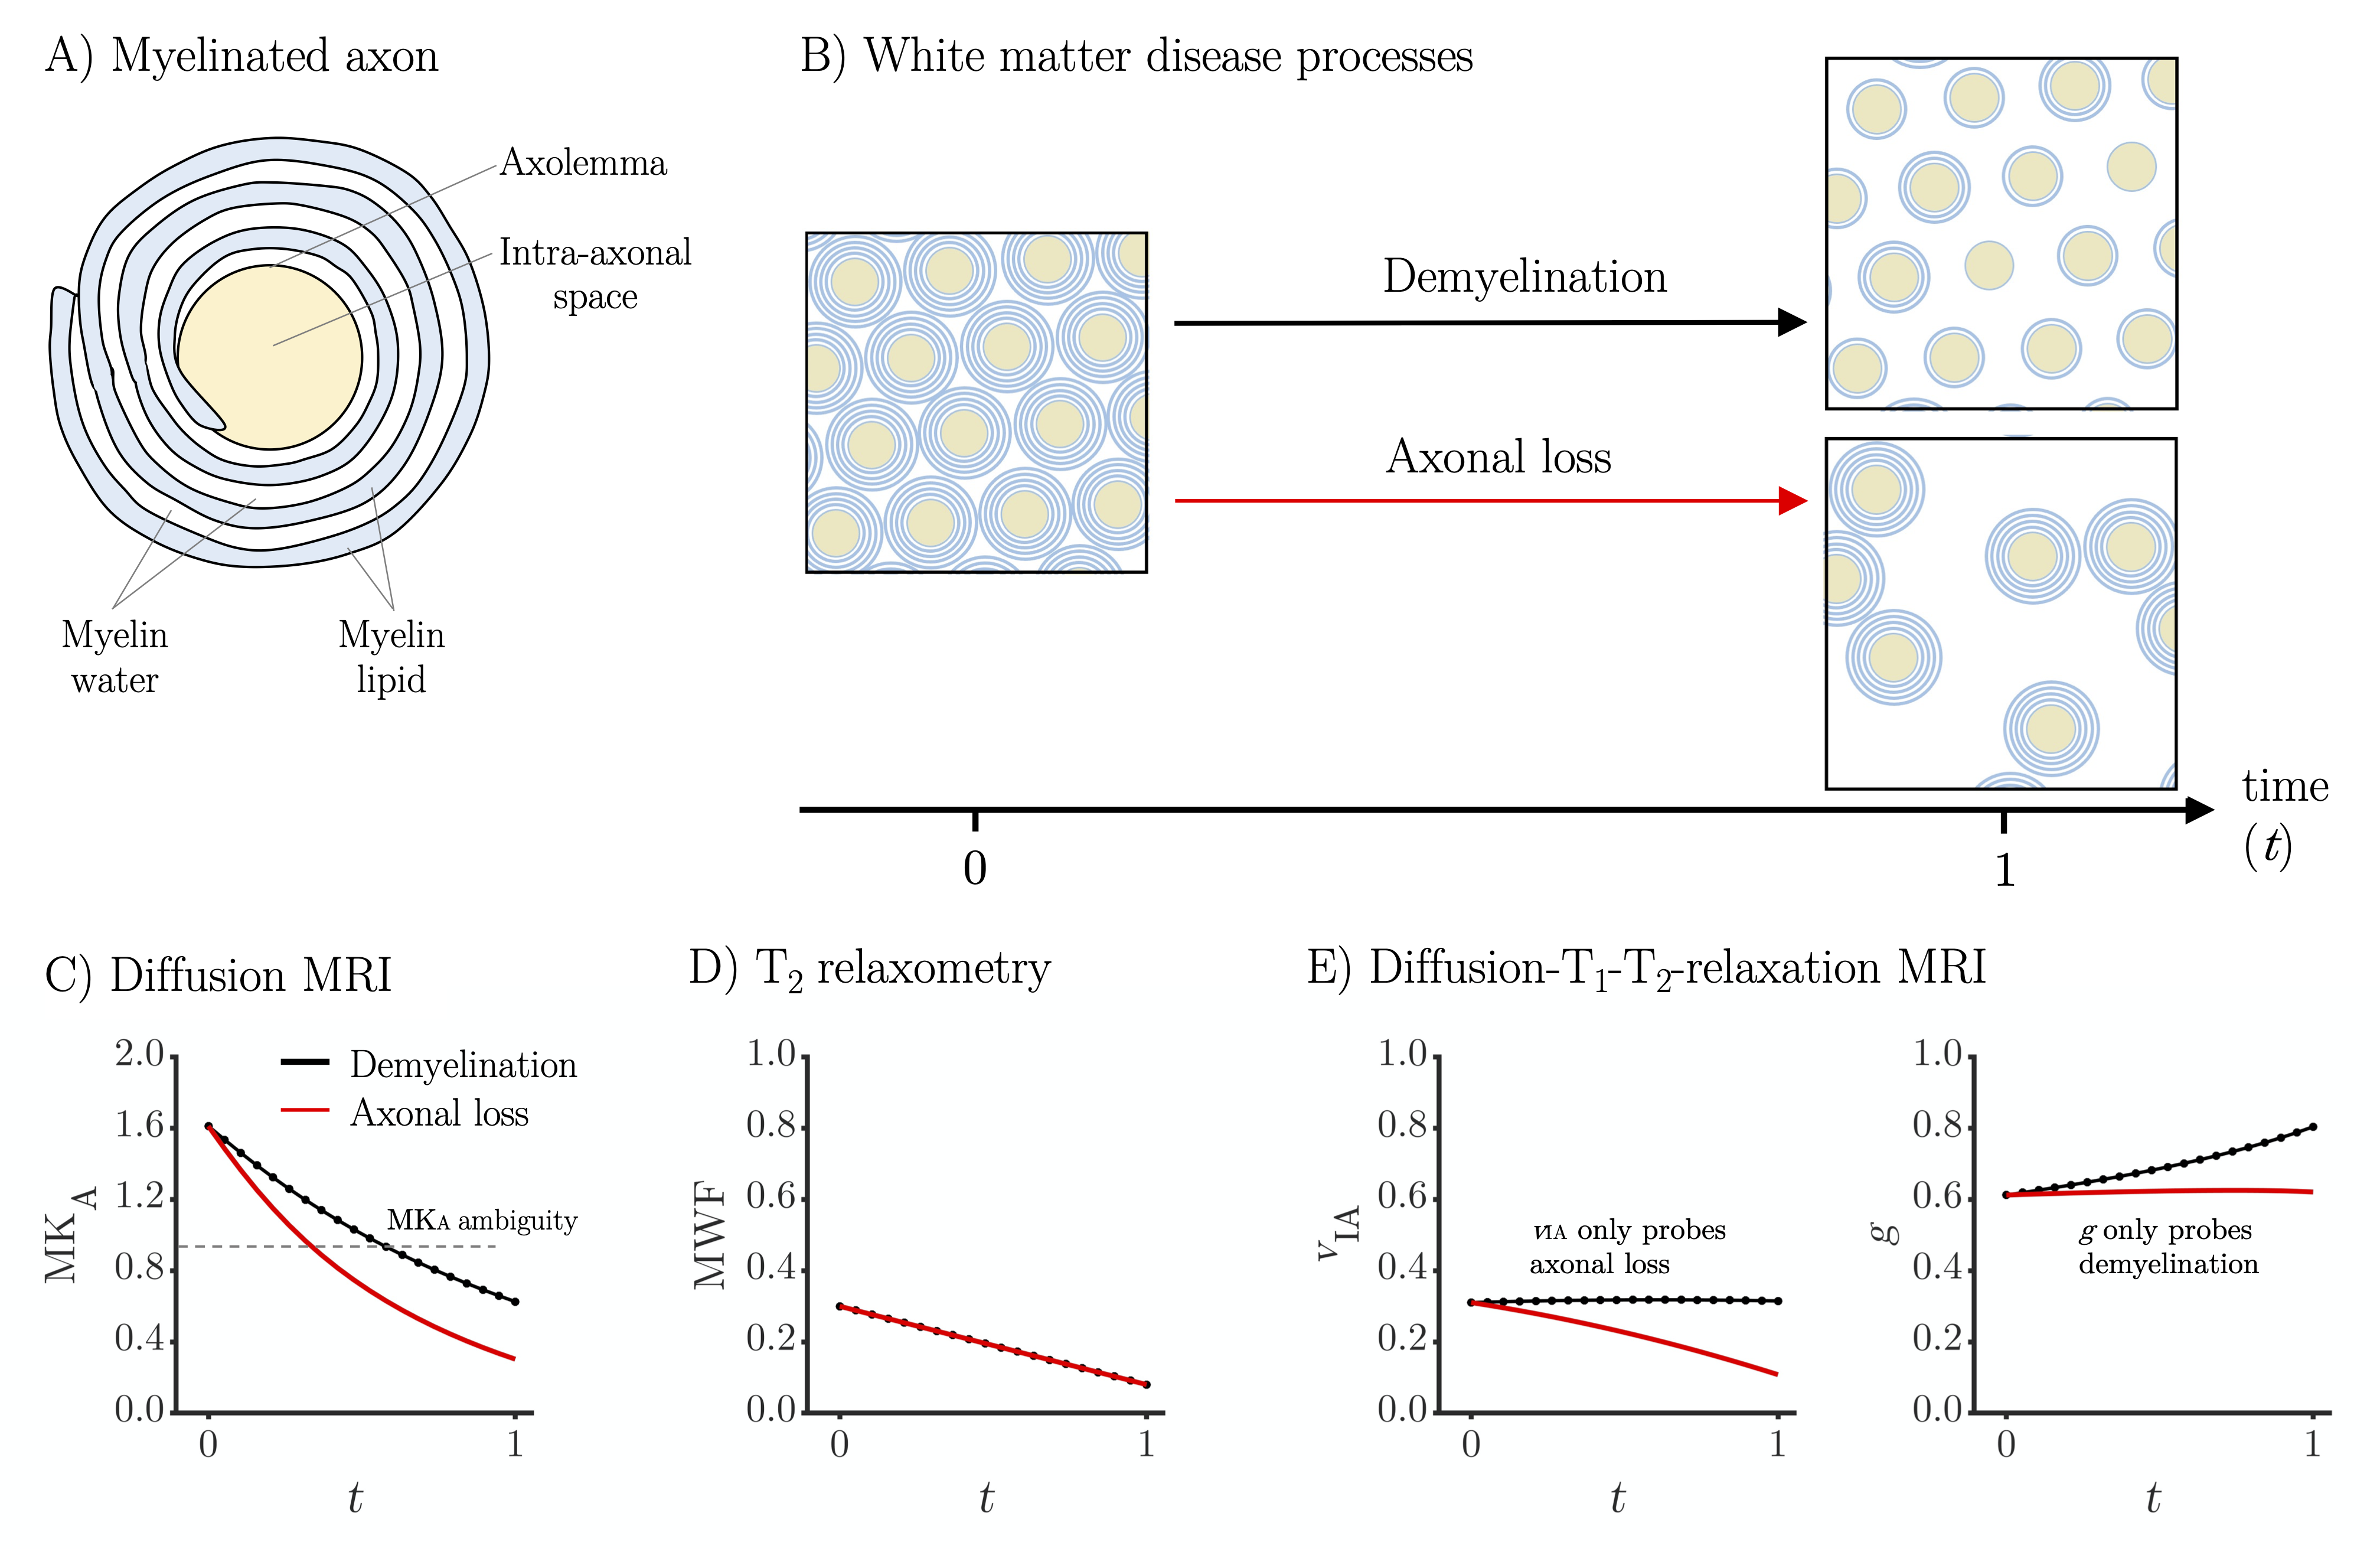
Myelinated axons are composed of two distinct components with approximately equal volume fractions: the intra-axonal space surrounded by axolemma and the myelin sheath (Figure 1A).1-4 Pathologies that affect white matter are characterized by damage to these components in the form of axonal loss and/or demyelination (Figure 1B).5-7 An imaging technique that separates these processes would be clinically valuable in conditions such as multiple sclerosis, where axonal loss is associated with higher disease severity and irreversible neurological disability.6 Diffusion MRI is sensitive to axons by their diffusion anisotropy8,9 but insensitive to myelin due to the long echo times (TE) and the short T2 of myelin-associated protons.3,10 Thus, demyelination can mimic axonal loss by increasing MRI-visible extracellular water with low diffusion anisotropy (Figure 1C). T2-relaxometry is sensitive to the myelin water fraction10,11 but insensitive to axons and thus to axonal loss (Figure 1D). In this work, we addressed this problem by combining diffusion MRI with T1- and T2-relaxometry12 to probe both axons and myelin (Figure 1E).Methods
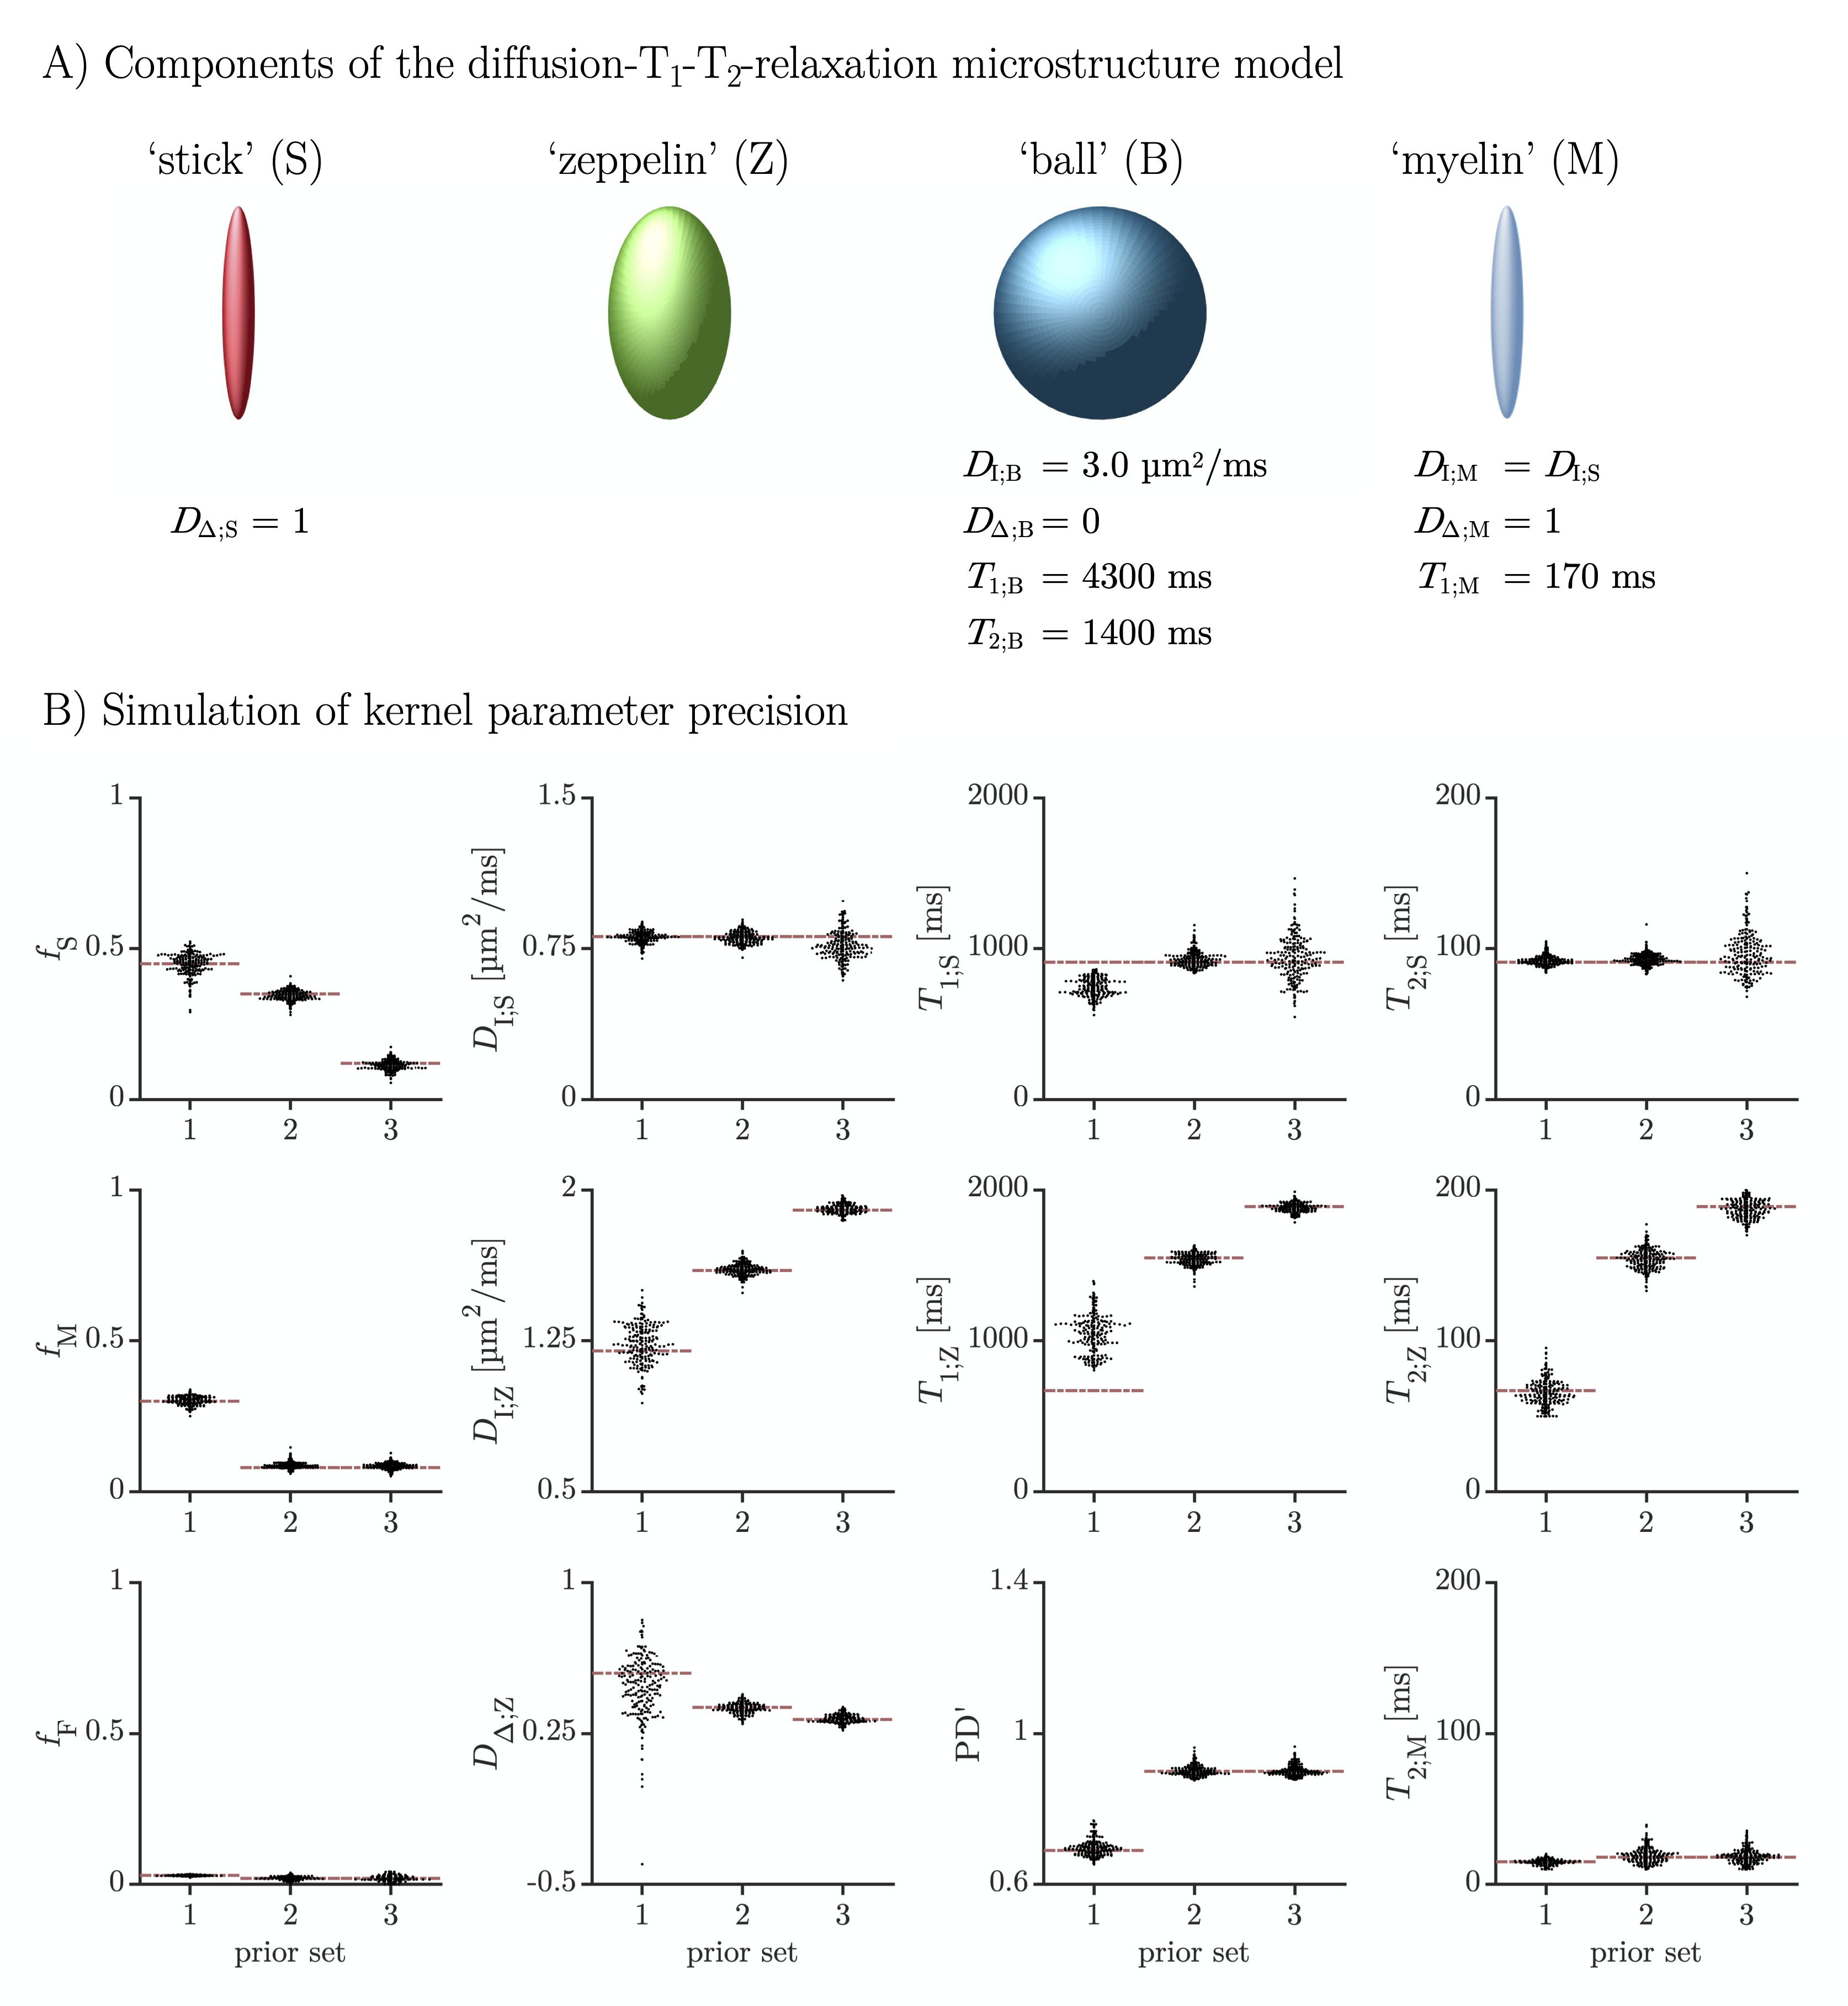
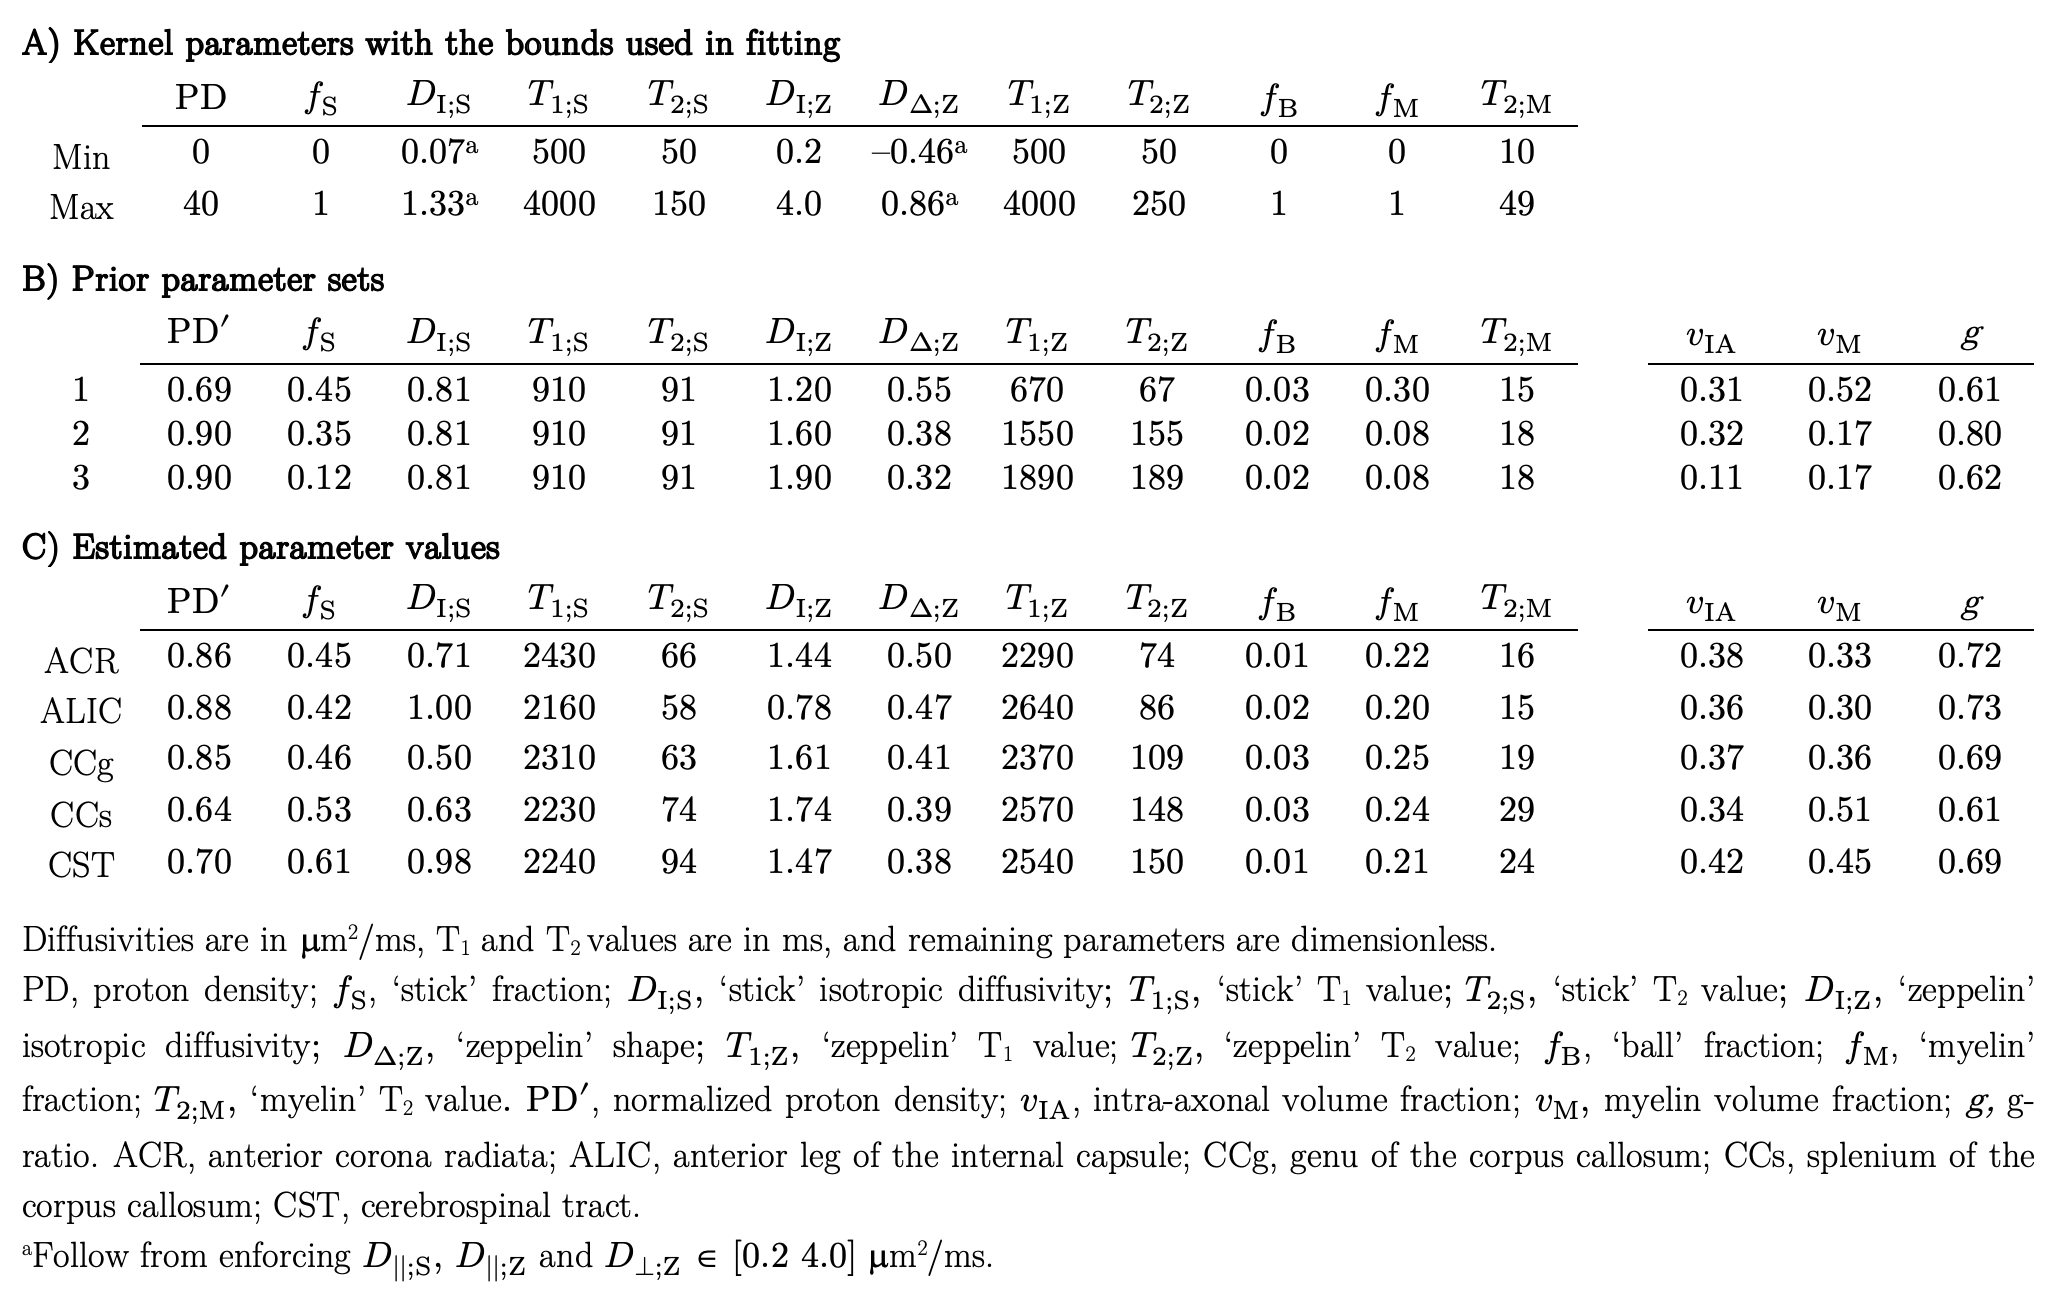
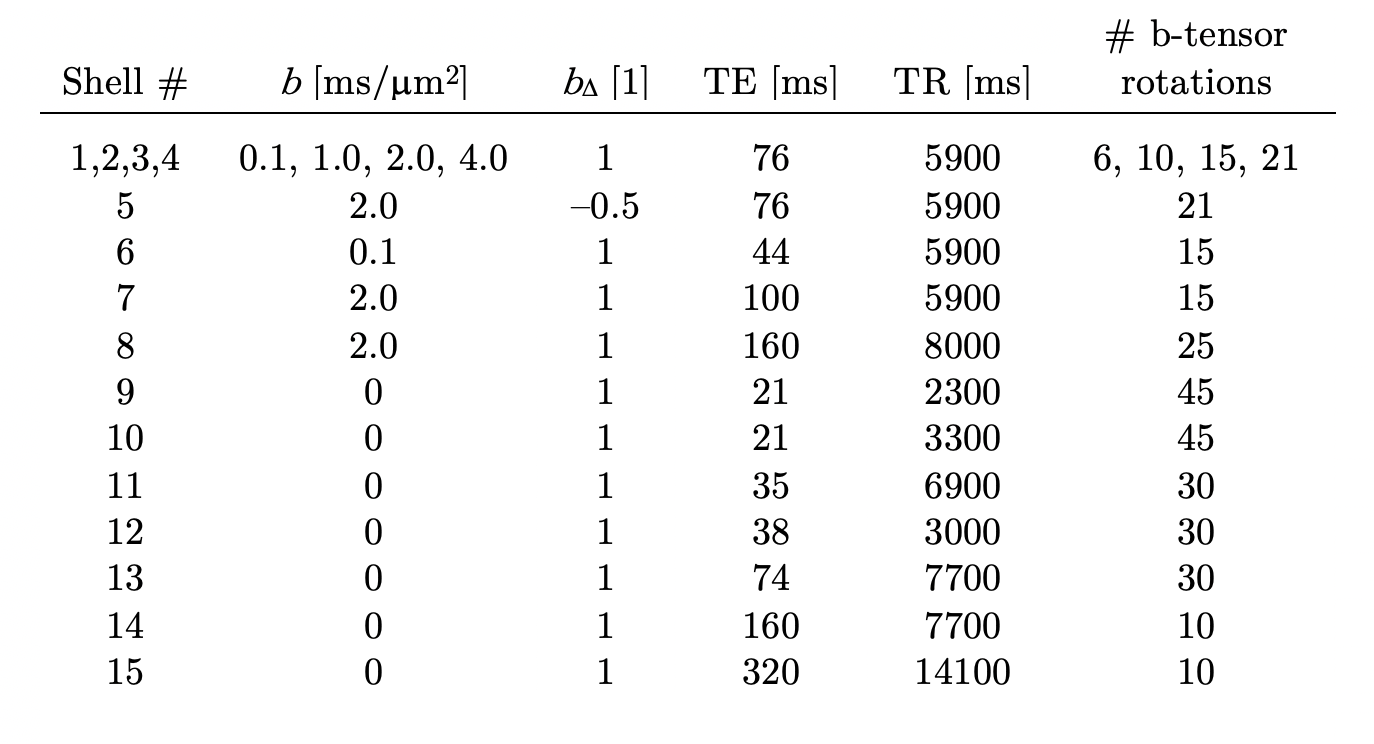
A diffusion-T1-T2-relaxation microstructure model based on the work in Lampinen, et al.13 was used to describe white matter. It featured four components: a ‘stick’ (S) with completely anisotropic diffusion, a ‘zeppelin’ (Z) with less anisotropic diffusion, a ‘ball’ (B) with fixed isotropic diffusion, and ‘myelin’ (M) with diffusion properties equal to those of the ‘stick’ (Figure 2A). The T1 and T2 values were free for the ‘stick’ and ‘zeppelin’ and the T2 value was free for ‘myelin’. In total, the model included twelve free parameters describing the microstructure kernel (Table 1A). The orientation distribution function was described by a five-parameter truncated spherical harmonic series. The acquisition protocol used multiple b-values (b), shapes of the b-tensor (bΔ), b-tensor rotations, echo times (TE), and repetition times (TR; Table 2). The protocol was optimized using Cramer-Rao Lower Bounds14 with the prior parameter sets defined in Table 1B. The resulting kernel parameter precision was assessed in a simulation. Data were acquired from one healthy volunteer on a MAGNETOM Prisma 3T system (Siemens Healthcare, Erlangen, Germany) using the Table 2 protocol for a prototype diffusion-weighted spin-echo sequence.15 The acquisition time was 30 minutes for whole-brain imaging using 2.5 mm3 voxels and GRAPPA factor 2. Data were corrected for subject motion and eddy currents,16 EPI distortions,17 and Gibbs ringing.18 Gaussian smoothing was applied using a kernel with a standard deviation of 0.5 times the voxel size. Model fitting was performed using least-squares minimization with the parameter bounds in Table 1A and two random initial guesses. MRI-visible proton density (PD) was estimated by correcting the S0 parameter for receive (fR) and transmit (fT) bias fields, according to S0 = PD·fR·sin(fT·α)·sin(fT·π/2)2,19 using fT from B1-mapping, fR ≈ fT from PrescanNormalize and a nominal flip angle α = π/2. Post-fitting, the PD parameter was normalized against cerebrospinal fluid, according to PD' = PD/PDCSF. Together with the signal fractions of ‘sticks’ (fS) and ‘myelin’ (fM), this yielded estimates of the volume fractions of intra-axonal space, vIA = fS·PD', myelin water, vMW = fM·PD', and myelin lipid, vML = 1 - PD', as well as the g-ratio, g = (vIA/vM)1/2, where vM = vMW + vML.Results
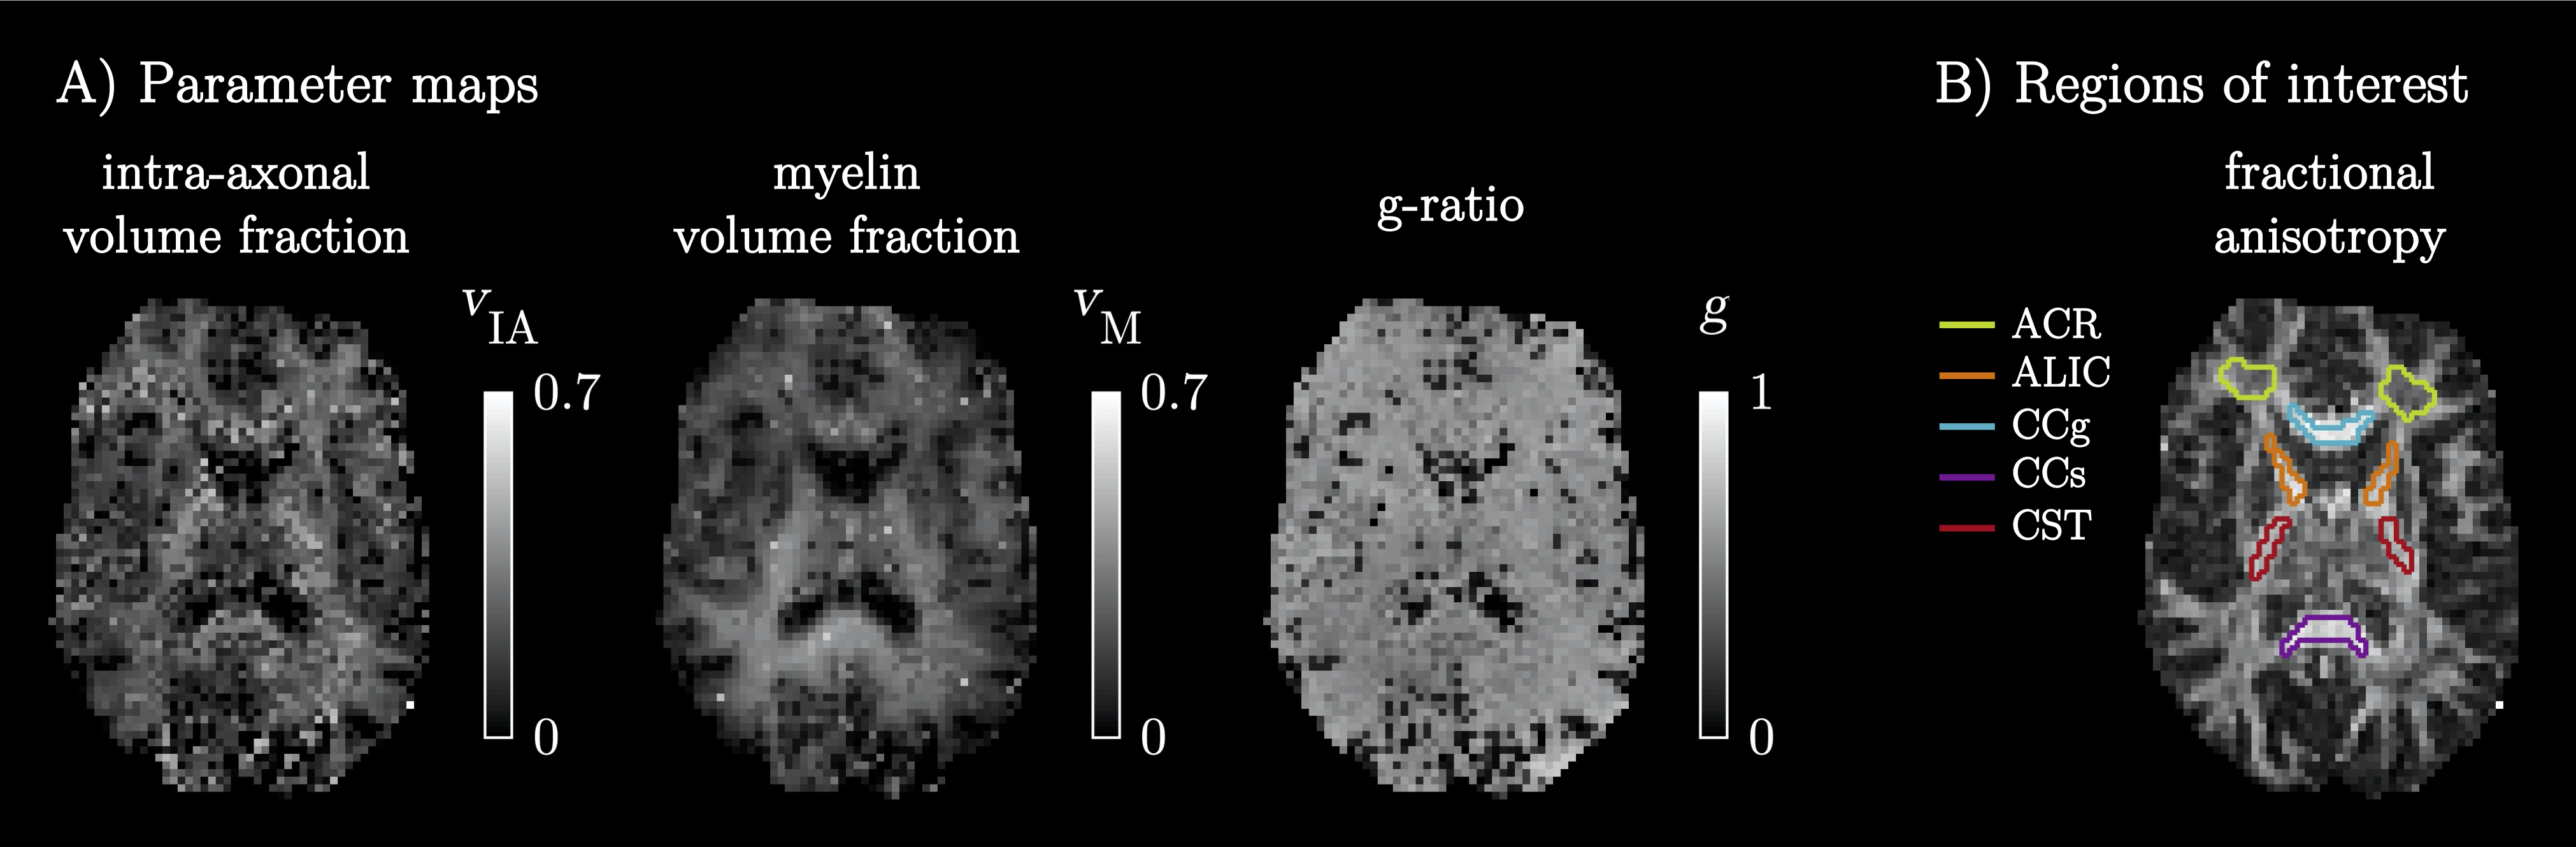
The simulations generally indicated high parameter precision (Figure 2B). Lower precision was seen for the ‘zeppelin’ parameters in the absence of pronounced ‘stick-zeppelin’ T2-differences (Table 1B, set 1) and for the ‘stick’ parameters when the ‘stick’ signal fraction was small (Table 1B, set 3). Brain parameter maps were noisy but featured a plausible contrast (Figure 3A). Parameter estimates from regions of interest in white matter (Figure 3B) indicated similar intra-axonal and myelin volume fractions between 0.3 and 0.5 and a g-ratio between 0.6 and 0.7 (Table 1C).Discussion
We used diffusion-T1-T2-relaxation MRI to estimate the volume fractions of axons and myelin in the living human brain. The estimated values (Table 1C) were consistent with histology from rodents and macaque,1-4 and the corresponding g-ratios were consistent with previous results3 and with wiring optimization theory.20,21 By combining diffusion MRI with relaxometry, the approach has the potential to disambiguate between demyelination and axonal loss (Figure 1E), which is generally not possible using either technique individually (Figure 1C and 1D).Conclusions
We show that diffusion-relaxation MRI can, in principle, estimate the fractions, diffusivities and relaxivities of four independent tissue components: intra-axonal space, extra-axonal space, free water and myelin, without the need for strong model constraints. The approach may disambiguate between demyelination and axonal loss and could be clinically valuable for assessing disease severity and treatment response in pathologies that affect white matter.Acknowledgements
We thank Siemens Healthcare for providing access to the pulse sequence programming environment.References
1. Jelescu IO, Zurek M, Winters KV, Veraart J, Rajaratnam A et al. In vivo quantification of demyelination and recovery using compartment-specific diffusion MRI metrics validated by electron microscopy. Neuroimage 2016;132:104-114.
2. Perge JA, Koch K, Miller R, Sterling P & Balasubramanian V. How the optic nerve allocates space, energy capacity, and information. J. Neurosci. 2009;29:7917-7928.
3. Stikov N, Campbell JS, Stroh T, Lavelée M, Frey S et al. In vivo histology of the myelin g-ratio with magnetic resonance imaging. Neuroimage 2015;118:397-405.
4. Xu J, Li H, Harkins KD, Jiang X, Xie J et al. Mapping mean axon diameter and axonal volume fraction by MRI using temporal diffusion spectroscopy. Neuroimage 2014;103:10-19.
5. Swieten Jv, Hout JVD, Ketel BV, Hijdra A, Wokke J et al. Periventricular lesions in the white matter on magnetic resonance imaging in the elderly: a morphometric correlation with arteriolosclerosis and dilated perivascular spaces. Brain 1991;114:761-774.
6. Ferguson B, Matyszak MK, Esiri MM & Perry VH. Axonal damage in acute multiple sclerosis lesions. Brain: a journal of neurology 1997;120:393-399.
7. Takase H, Washida K, Hayakawa K, Arai K, Wang X et al. Oligodendrogenesis after traumatic brain injury. Behav. Brain Res. 2018;340:205-211.
8. Beaulieu C. The basis of anisotropic water diffusion in the nervous system–a technical review. NMR Biomed. 2002;15:435-455.
9. Lampinen B, Szczepankiewicz F, Novén M, van Westen D, Hansson O et al. Searching for the neurite density with diffusion MRI: Challenges for biophysical modeling. Hum. Brain Mapp. 2019;40:2529-2545.
10. Mackay A, Whittall K, Adler J, Li D, Paty D et al. In vivo visualization of myelin water in brain by magnetic resonance. Magn. Reson. Med. 1994;31:673-677.
11. Whittall KP, Mackay AL, Graeb DA, Nugent RA, Li DK et al. In vivo measurement of T2 distributions and water contents in normal human brain. Magn. Reson. Med. 1997;37:34-43.
12. de Almeida Martins JP & Topgaard D. Multidimensional correlation of nuclear relaxation rates and diffusion tensors for model-free investigations of heterogeneous anisotropic porous materials. Sci. Rep. 2018;8:2488.
13. Lampinen B, Szczepankiewicz F, Mårtensson J, van Westen D, Hansson O et al. Towards unconstrained compartment modeling in white matter using diffusion‐relaxation MRI with tensor‐valued diffusion encoding. Magn. Reson. Med. 2020;84:1605-1623.
14. Alexander DC. A general framework for experiment design in diffusion MRI and its application in measuring direct tissue-microstructure features. Magn. Reson. Med. 2008;60:439-448.
15. Szczepankiewicz F, Sjölund J, Ståhlberg F, Lätt J & Nilsson M. Tensor-valued diffusion encoding for diffusional variance decomposition (DIVIDE): Technical feasibility in clinical MRI systems. PLoS One 2019;14:e0214238.
16. Nilsson M, Szczepankiewicz F, van Westen D & Hansson O. Extrapolation-Based References Improve Motion and Eddy-Current Correction of High B-Value DWI Data: Application in Parkinson’s Disease Dementia. PLoS One 2015;10:e0141825.
17. Andersson JL, Skare S & Ashburner J. How to correct susceptibility distortions in spin-echo echo-planar images: application to diffusion tensor imaging. Neuroimage 2003;20:870-888.
18. Kellner E, Dhital B, Kiselev VG & Reisert M. Gibbs‐ringing artifact removal based on local subvoxel‐shifts. Magn. Reson. Med. 2016;76:1574-1581.
19. Helms G, Dathe H & Dechent P. Quantitative FLASH MRI at 3T using a rational approximation of the Ernst equation. Magnetic Resonance in Medicine: An Official Journal of the International Society for Magnetic Resonance in Medicine 2008;59:667-672.
20. Rushton W. A theory of the effects of fibre size in medullated nerve. The Journal of physiology 1951;115:101-122.
21. Chomiak T & Hu B. What is the optimal value of the g-ratio for myelinated fibers in the rat CNS? A theoretical approach. PLoS One 2009;4:e7754.
22. Rooney WD, Johnson G, Li X, Cohen ER, Kim SG et al. Magnetic field and tissue dependencies of human brain longitudinal 1H2O relaxation in vivo. Magn. Reson. Med. 2007;57:308-318.
23. Weigel M & Hennig J. Contrast behavior and relaxation effects of conventional and hyperecho‐turbo spin echo sequences at 1.5 and 3 T. Magn. Reson. Med. 2006;55:826-835.
24.
Eriksson S, Lasič S, Nilsson M, Westin C-F & Topgaard D. NMR
diffusion-encoding with axial symmetry and variable anisotropy: Distinguishing
between prolate and oblate microscopic diffusion tensors with unknown
orientation distribution. The Journal of chemical physics 2015;142:104201.
Figures