1640
In vivo myelin water imaging at 0.55T1Department of Biomedical Engineering, University of Basel, Basel, Switzerland, 2Division of Radioligical Physics, Department of Radiology, University of Basel Hospital, Basel, Switzerland
Synopsis
Myelin water fraction (MWF) imaging is an important tool to investigate demyelination in WM. When using GRE sequences, the method suffers from T2* effects, leading to a non-exponential behaviour. This can potentially influence the calculation of MWF. At low fields susceptibility effects are less and the assumption of biexponential T2-decay is more accurate. Here, the feasibility of MWF at 0.55 T, using biexponential fitting was demonstrated.
Introduction
Myelin is a concentric accumulation of lipid bilayers, encapsulating the axons of nerve cells of vertebrates in order to speed up signal transmission. In between these layers there is tightly enclosed water, which leads to special magnetic properties. This is especially visible in highly myelinated regions of the central nervous system, like white matter (WM). The myelin water exhibits a shorter $$$T_2$$$ than the intra- and extracellular water of the axon, leading to a biexponential behaviour of WM, which was first observed by Vasilescu et al.1 and has been investigated extensively since then.This can be used to do myelin water fraction (MWF) imaging, which provides a useful tool to investigate demyelination in degenerative diseases like multiple sclerosis2,3. While this is preferably done with spin-echo sequences to avoid $$$T_2^*$$$ decay, there are numerous approaches to do this with gradient-echo sequences4-7.It has been shown that a 3D multigradient-echo (mGRE) approach is feasible for MWF imaging in clinically relevant scan time6. However, susceptibility effects lead to a $$$T_2^*$$$ decay which usually can not be described as an exponential, making the biexponential model less adequate.
At low field strengths susceptibility effects are generally weaker and,therefore, the deviation of $$$T_2^*$$$ from $$$T_2$$$ is lower. Here, a biexponential model could be more appropriate than at higher field strengths, possibly leading to overall better fit results and, therefore, more accurate MWF values. In this work, the 3D mGRE approach is tested at $$$0.55\,\mathrm{T}$$$.
Methods
MRI: Imaging was performed at $$$0.55\,\mathrm{T}$$$, using a 3D multi-echo GRE sequence with monopolar readout. The brain scan was done on a healthy volunteer with a field-of-view of $$$256$$$, a base resolution of $$$128$$$, $$$75\,\%$$$ phase resolution and a slice thickness of $$$1.5\,\mathrm{mm}$$$ with $$$50\,\%$$$ slice oversampling. Interpolation was turned on, yielding an imaging matrix of $$$256\times192\times48$$$ with an in-plane resolution of $$$1\,\mathrm{mm}$$$ and a slice thickness of $$$1.5\,\mathrm{mm}$$$. A flip angle of $$$\alpha = 10°$$$ was used. In total, $$$7$$$ measurements were done, each with a $$$\mathrm{TR}$$$ of $$$100\,\mathrm{ms}$$$. Echos were equidistantly distributed in each measurement with an echo spacing of $$$7\,\mathrm{ms}$$$. The first measurement contained twelve echos, starting at $$$\mathrm{TE}_1 = 3\,\mathrm{ms}$$$ and ending at $$$\mathrm{TE}_{78} = 80\,\mathrm{ms}$$$, while the following measurements all contained eleven echos. In these the first echo was set $$$1\,\mathrm{ms}$$$ later than in the preceding measurement. In total $$$78$$$ echos between $$$3\,\mathrm{ms}$$$ and $$$80\,\mathrm{ms}$$$ with an echo spacing of $$$1\,\mathrm{ms}$$$ were recorded.Scanning took $$$3:29\,\mathrm{min}$$$ per measurement, amounting to approximately $$$25\,\mathrm{min}$$$ in total.
Data analysis: A tissue preserving median filter with kernel size $$$5$$$ was applied to the obtained data. A biexponential fit was then done for each voxel in the whole brain. Since the fit was unstable for the fast $$$T_2$$$ component in some regions, mainly in boarder regions to grey matter (GM) and GM itself, the $$$T_2$$$ value from a stable WM region was taken and used as a constant parameter for a second fit where only the long component was fit with two free parameters (amplitude and $$$T_2$$$), while $$$T_2$$$ was held constant for the fast component, ensuring a more stable fit for its amplitude.
The MWF was calculated from the amplitudes of the fast and slow component $$$A_\mathrm{fast}$$$ and $$$A_\mathrm{slow}$$$ as
$$\mathrm{MWF} = \frac{A_\mathrm{fast}}{A_\mathrm{fast} + A_\mathrm{slow}}$$
Results/Discussion
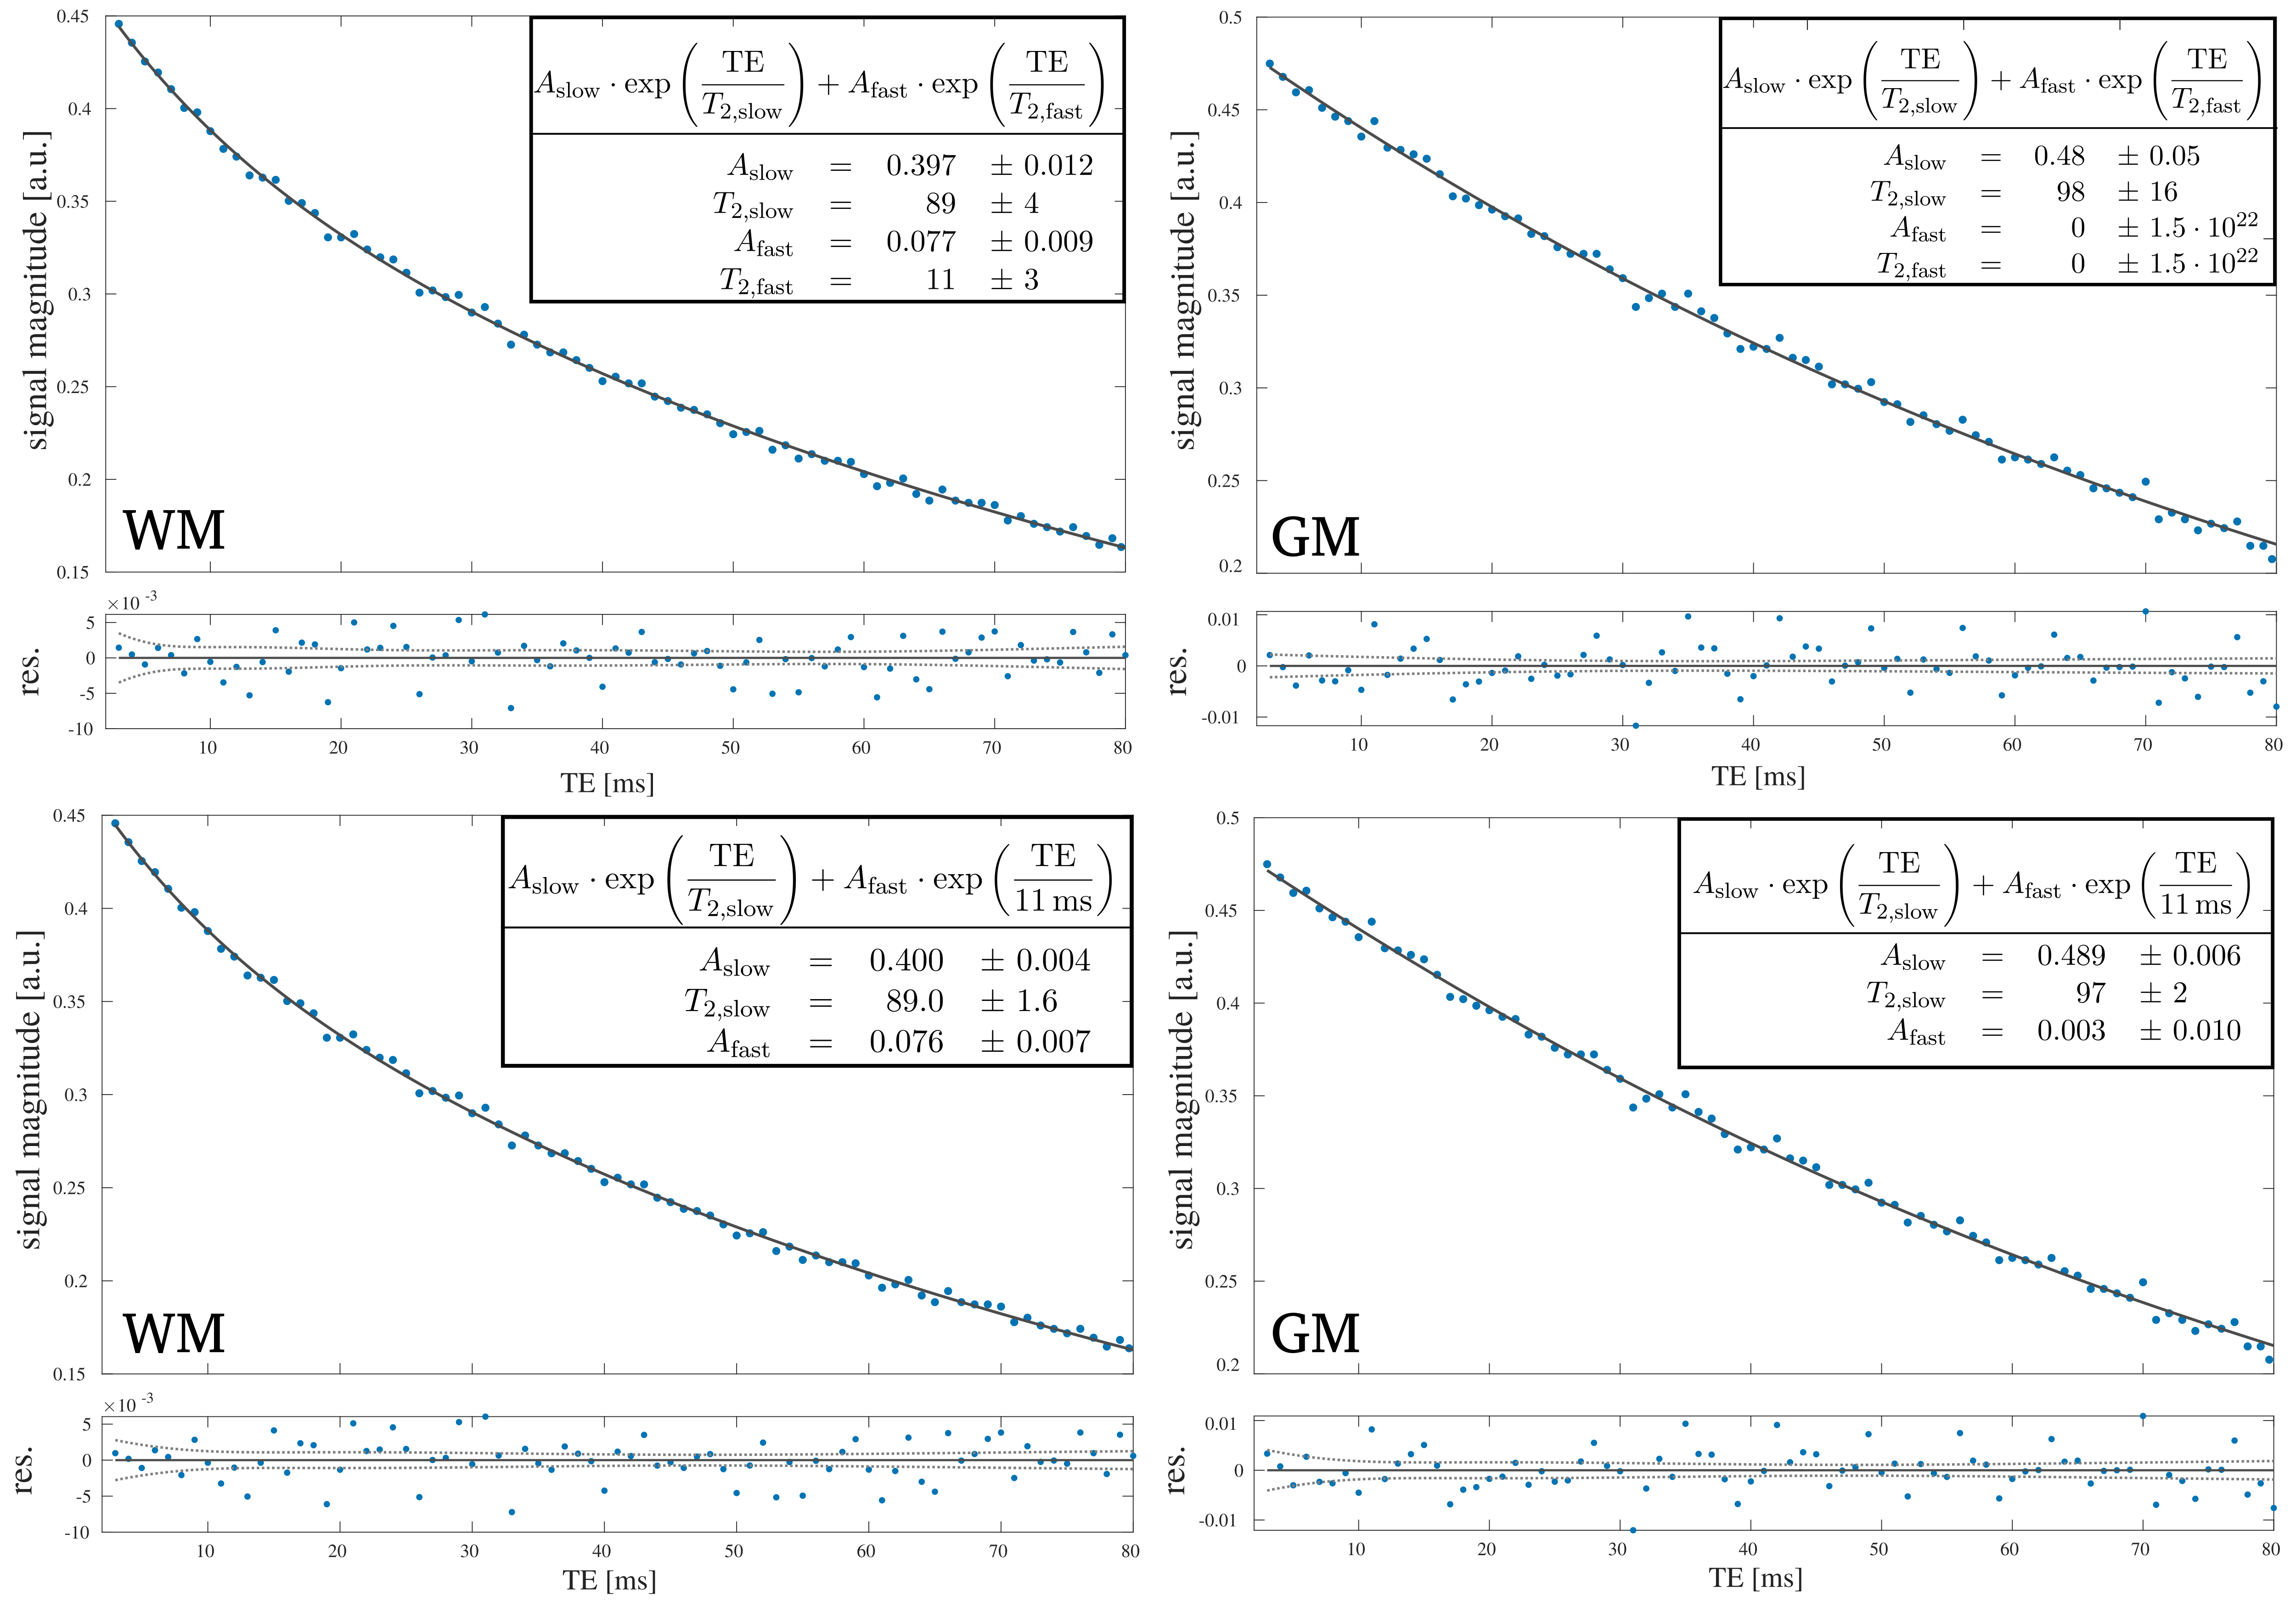
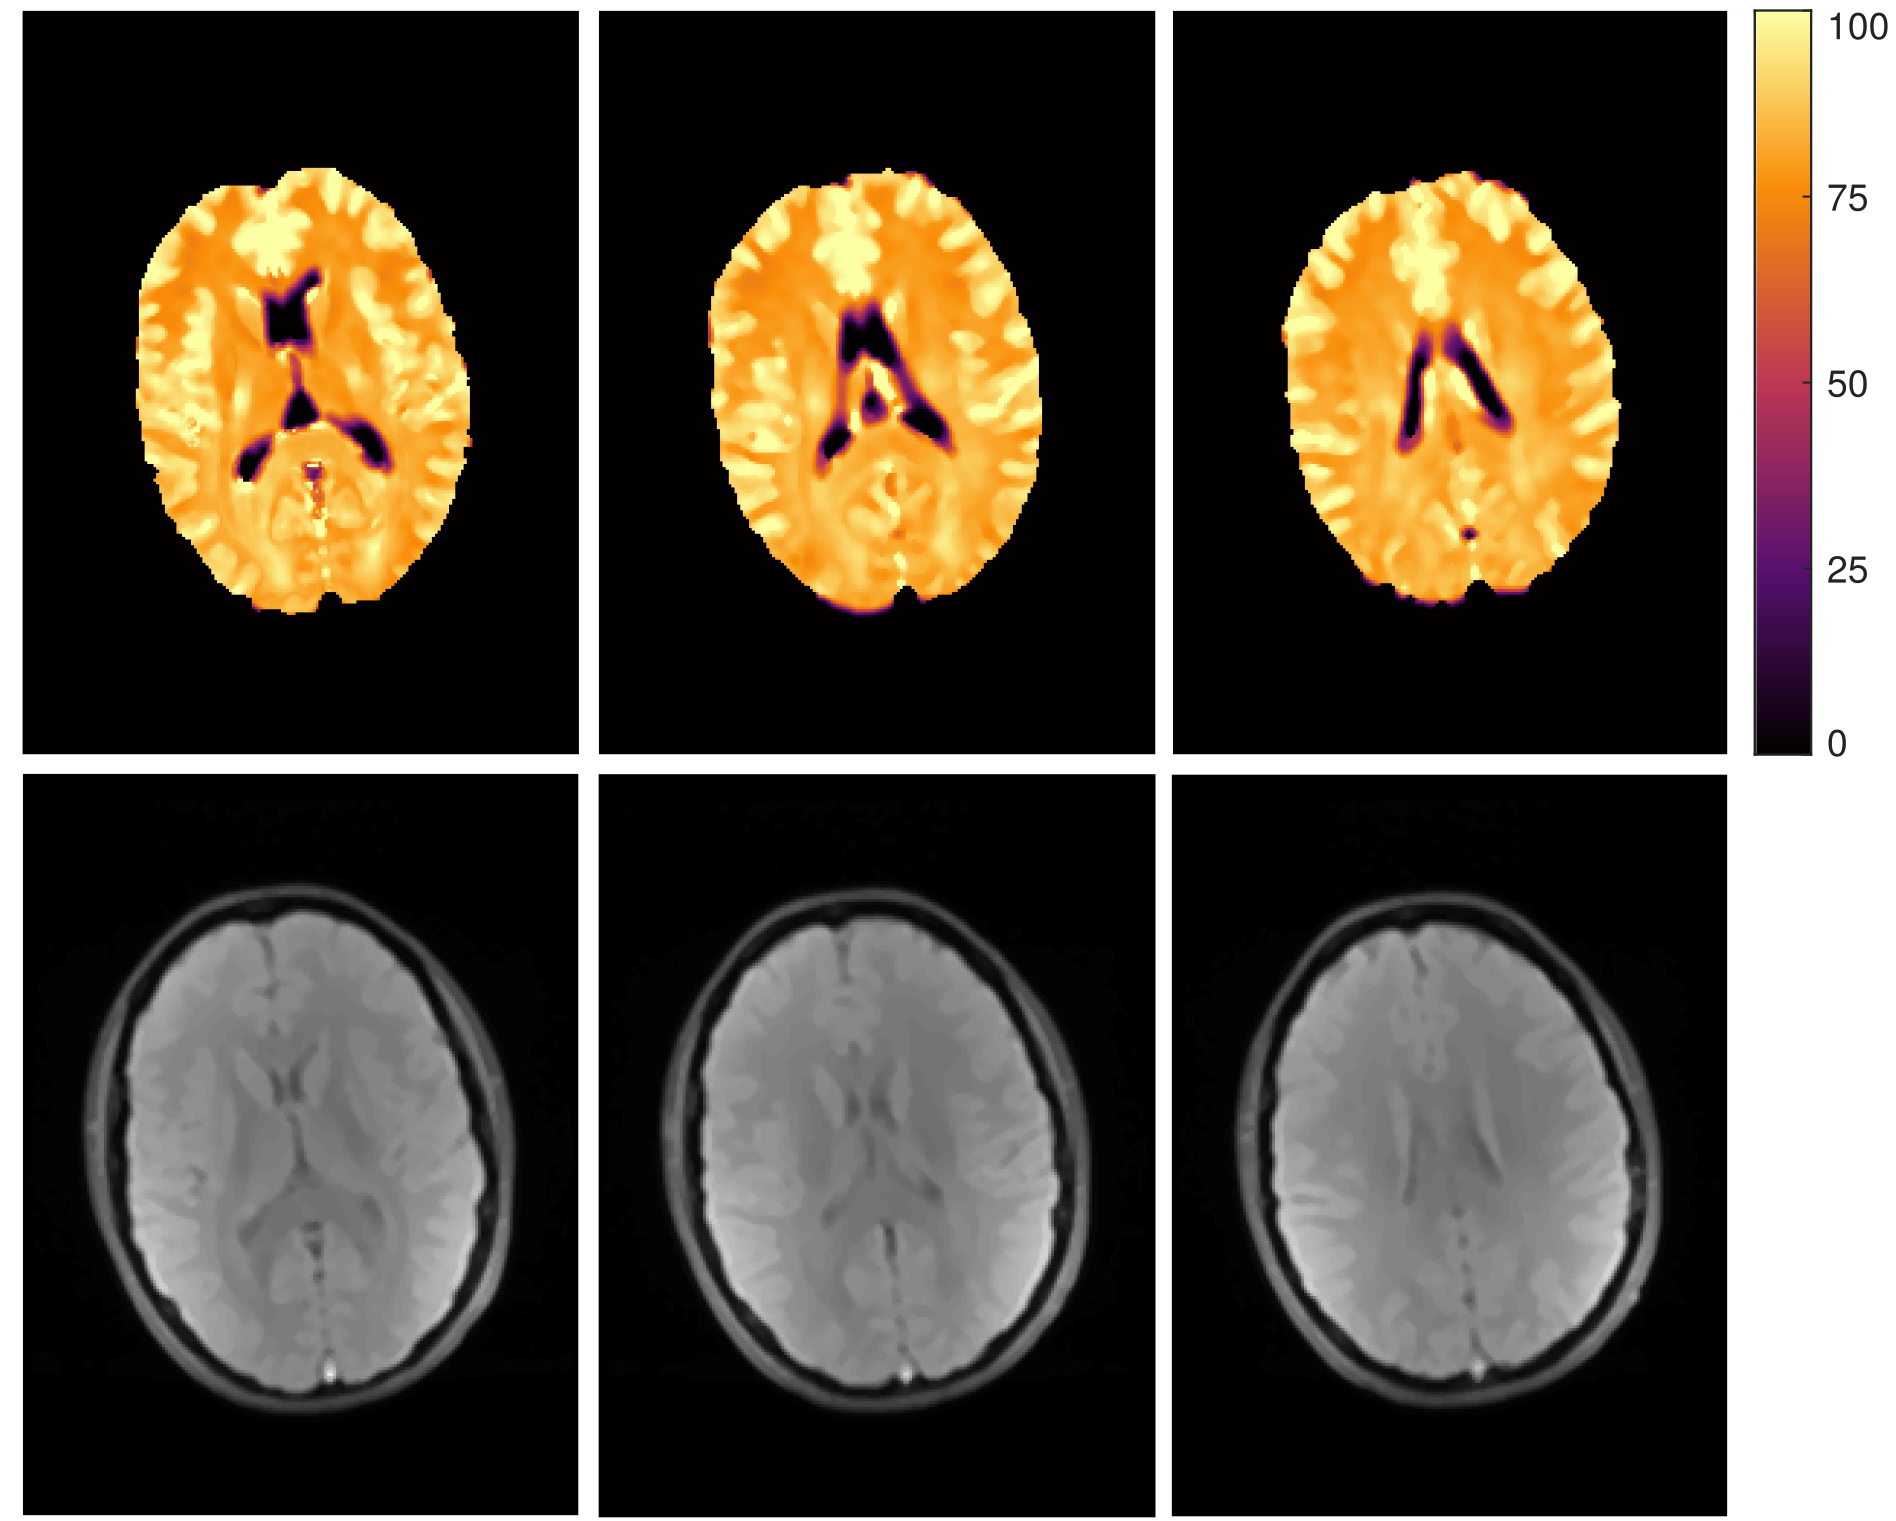
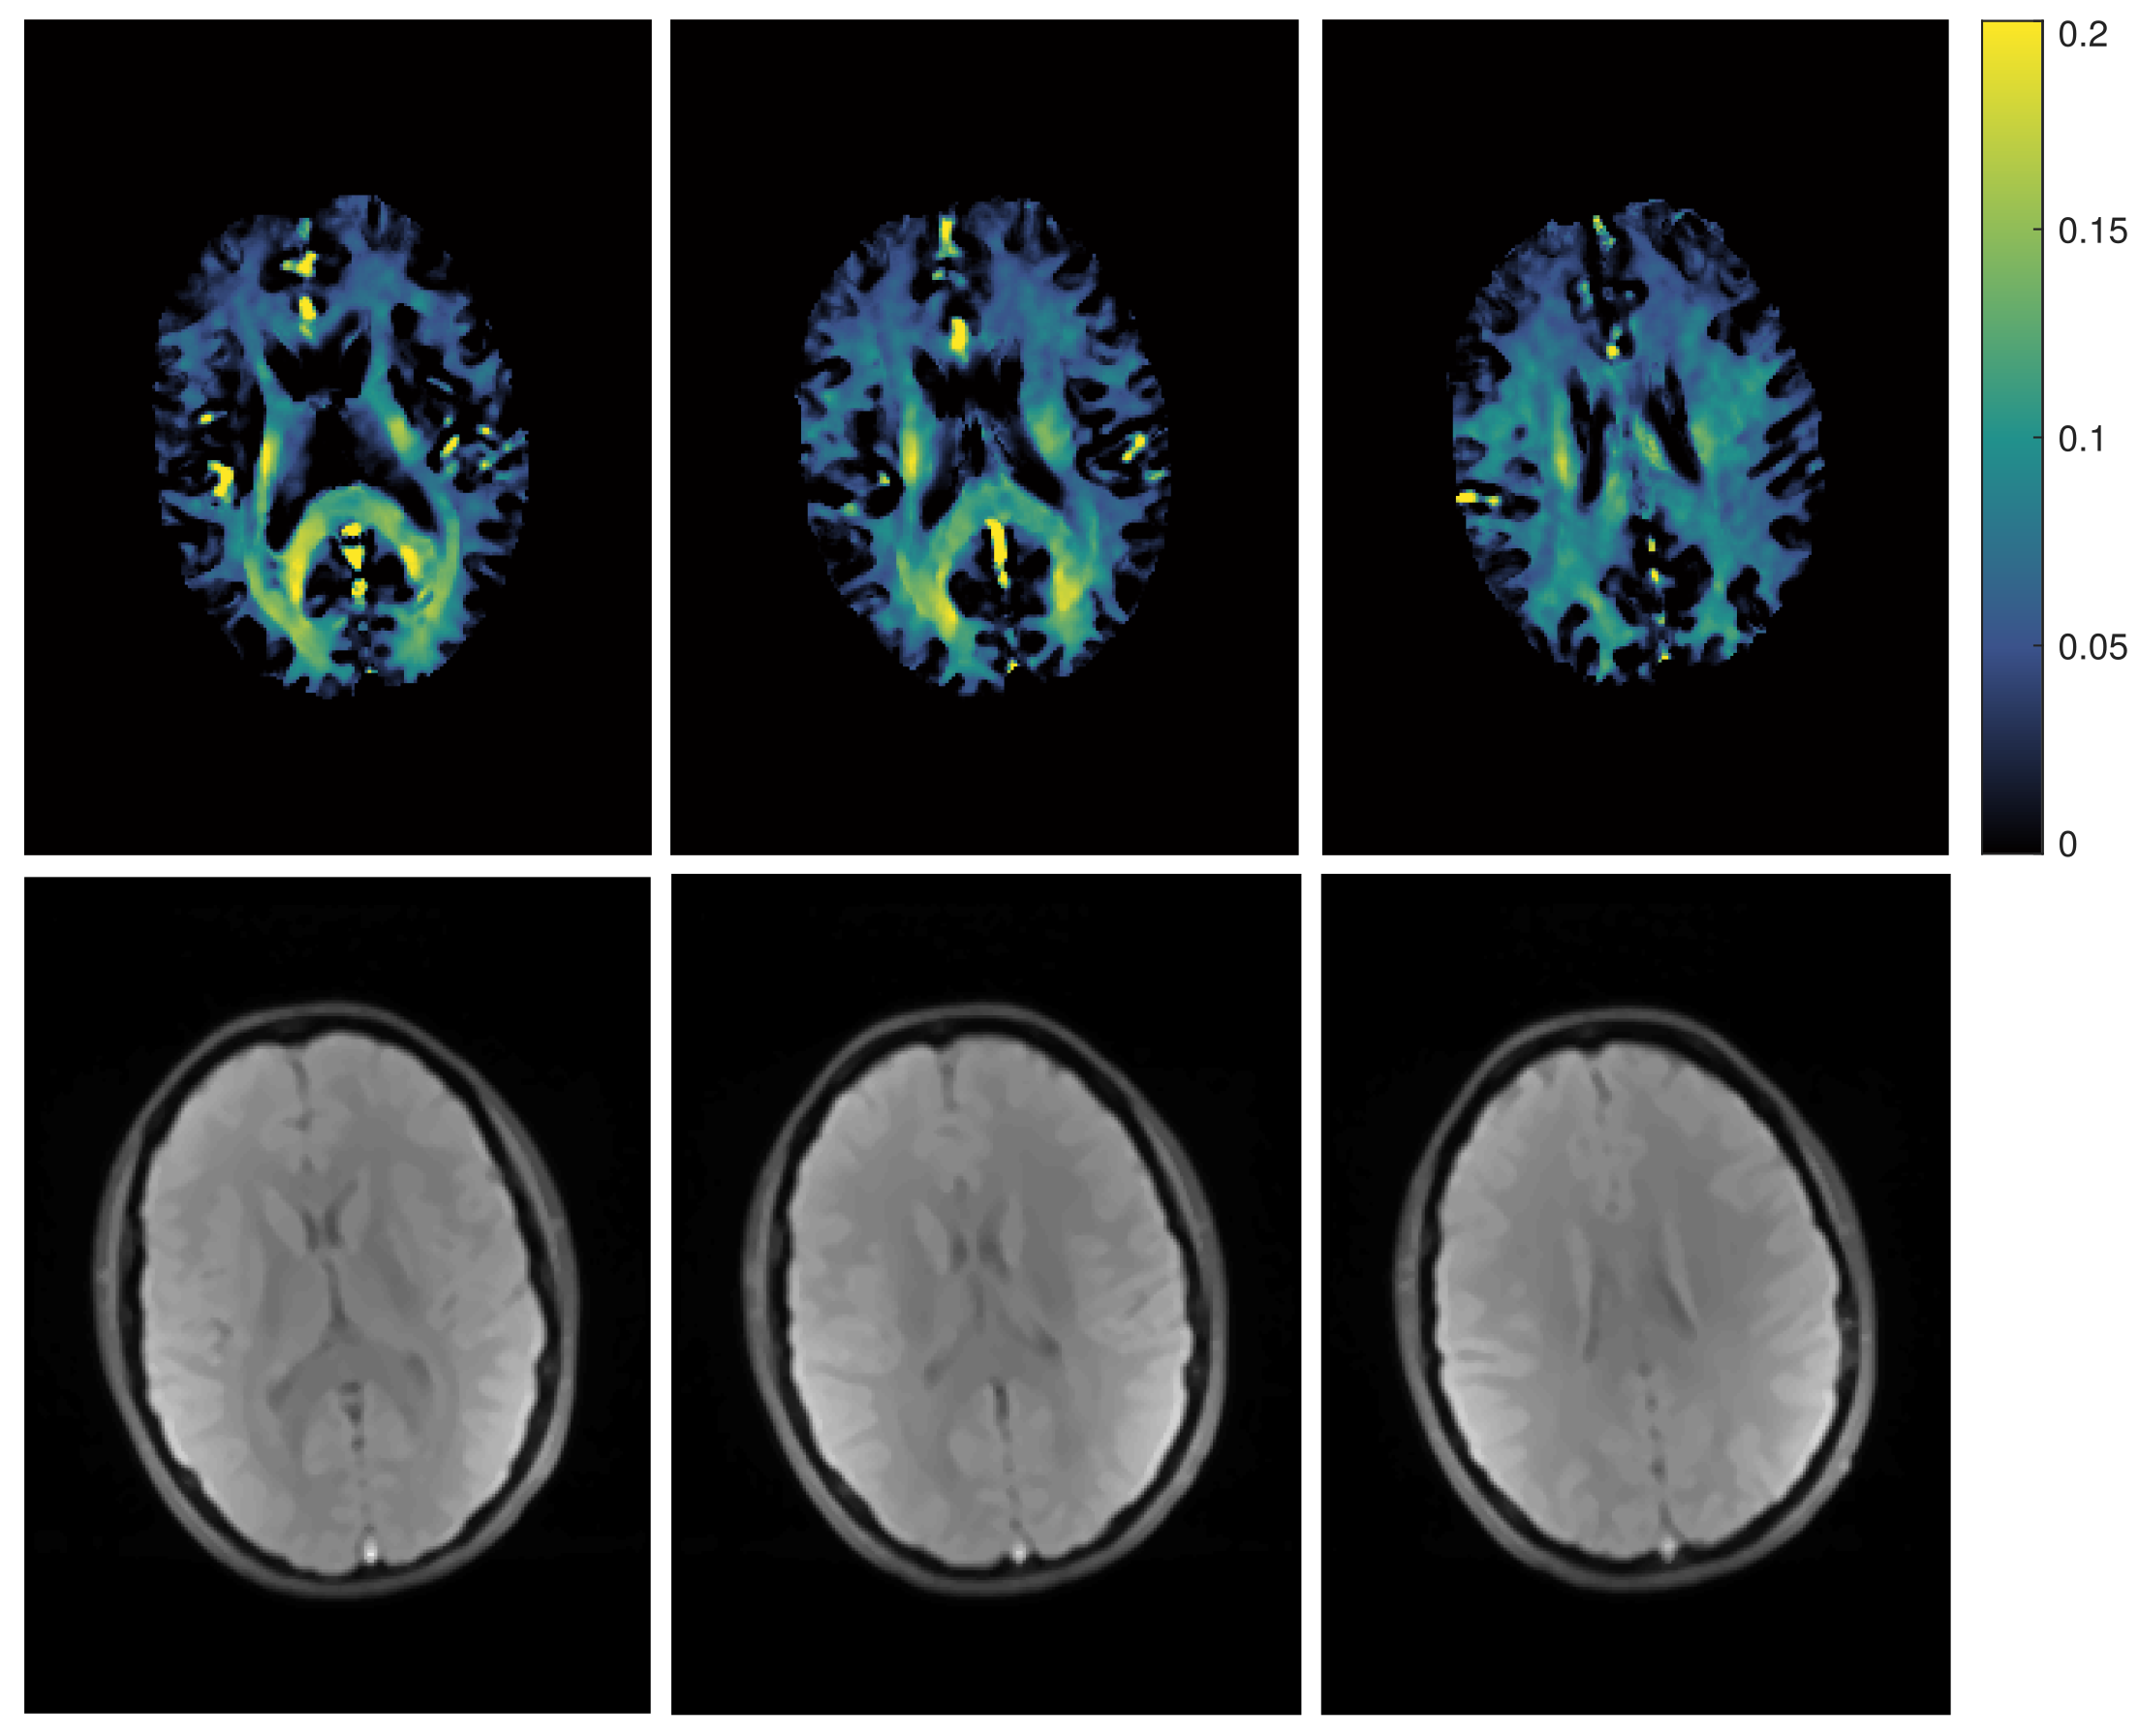
Fig. 1 shows representative fits for single voxels in WM and GM. While both fits are similarly good for WM, fixing of the fast $$$T_2$$$ component helps to improve the GM fit substantially. Since GM exhibits no biexponential behaviour, a biexponential fit can lead to problems as seen in the fit where both $$$T_2$$$ parameters were free and the parameters for the second component do not converge correctly. Here, fixing of the fast $$$T_2$$$ component leads to a converging fit where the amplitude of this component is correctly fit to zero and the fit provides more reliable $$$T_2$$$ values. Especially in border regions between WM and GM this can help to differentiate between the two tissue types, without the need for additional segmentation of WM and GM.In Fig. 2 $$$T_2$$$ map of the slow component for three representative slices are shown. $$$T_2$$$ values of WM and GM are consistent over the whole brain. In regions of deep WM values amount to $$$(80\pm 2)\,\mathrm{ms}$$$. In GM the $$$T_2$$$ is slightly higher with $$$(96\pm 2)\,\mathrm{ms}$$$. Fig. 3 shows the calculated MWF for the same slices. Overall, these are similar to previously reported values7. However, mean MWF values vary distinguishably between front $$$(0.076\pm0.007)$$$ and back $$$( 0.14\pm 0.03 )$$$ of the brain, for rasons yet to be investigated.
Conclusion
It was shown that MWF imaging at $$$0.55\,\mathrm{T}$$$ with a 3D mGRE sequence is feasible and could, generally, benefit from decreased susceptibility effects at low field strengths, due to the more appropriate assumption of a biexponential decay.Acknowledgements
This work was supported by the Swiss National Science Foundation (Grant No. 325230_182008).References
1. Vasilescu V., Katona E., Simplaceanu V., Demco, D. Water compartments in the myelinated nerve. III. Pulsed NMR result. Experientia. 1978;34:1443-1444.
2. Mackay A., Whittall K., Adler J., Li D., Paty D., Graeb D. In vivo visualization of myelin water in brain by magnetic resonance. Magn Reson Med. 1994;31:673-677.
3. Laule C., Leung E., Li D. K., Traboulsee A. L., Paty D. W., MacKay A. L., Moore G. R. Myelin water imaging in multiple sclerosis: quantitative correlations with histopathology. Multiple Sclerosis Journal. 2006;12:747-753.
4. Du Y. P., Chu R., Hwang D., Brown M. S., Kleinschmidt-DeMasters B. K., Singel D., Simon J. H. Fast multislice mapping of the myelin water fraction using multicompartment analysis of T decay at 3T: A preliminary postmortem study. Magn Reson Medicine. 2007;58:865-870.
5. Hwang D., Kim D. H., Du Y. P. In vivo multi-slice mapping of myelin water content using T2* decay. NeuroImage. 2010;52:198-204.
6. Lenz C., Klarhöfer M., Scheffler K. Feasibility of in vivo myelin water imaging using 3D multigradient-echo pulse sequences. Magn Reson Med. 2012;68;523-528.
7. Song J. E., Kim D. H. Improved Multi-echo Gradient-echo based Myelin Water Fraction Mapping using Dimensionality Reduction. IEEE Transactions on Medical Imaging. 2021
Figures