1638
7T multi-pool CEST MRI in multiple sclerosis patients1Neuroradiology, University Hospital Erlangen, Erlangen, Germany, 2High-field Magnetic Resonance Center, Max Planck Institute for Biological Cybernetics, Tübingen, Germany
Synopsis
Differentiation of active multiple sclerosis lesions from non-active ones is done in the clinical environment by using contrast enhanced T1 images. CEST MRI has shown to yield correlations with Gadolinium contrast enhancement in tumors and other pathological tissue. In this work, we are trying to gain more insight in the metabolic information regarding the brain of patients suffering from multiple sclerosis.
Introduction
Chemical exchange saturation transfer (CEST) imaging offers insight into low concentrated molecules inside the human body, especially the brain. Multiple sclerosis (MS) is an inflammatory disease of the central nervous system, decreasing the concentration of myelin around the axons until finally leading to the loss of the central axons. It is crucial to detect lesions and classify the MS-type as early as possible, in order to optimize treatment.1,2Interestingly, CEST MRI at 7T has shown to yield correlations with Gadolinium (Gd) contrast enhancement in tumours.3 In this work, we are testing the same CEST approach in patients suffering from multiple sclerosis.
Methods
Data were acquired from 3 patients (Relapsing Remitting Multiple Sclerosis RRMS: 1 male & 1 female, Radiologic Isolated Syndrom RIS: 1 male), after written informed consent and under approval of the local ethics committee, at a MAGNETOM Terra 7 Tesla scanner (Siemens Healthcare GmbH, Erlangen, Germany) with an 32ch Rx and 8ch Tx head coil.Homogeneous Gaussian pre-saturation was realized using the MIMOSA scheme (120 pulses, tp=15 ms, duty cycle DC=60.56%) at two B1 levels of 0.72μT and 1.00μT.4 Image readout was a centric 3D snapshot GRE5 (TE=1770ms, TR=3700ms, FA=6°, FOV=230x186.875x21mm, matrix size 104x128x18). GRAPPA 2 was applied in the first phase encoding direction.6 For the measurement, 56 frequency offsets were distributed non-equidistantly between -100 and 100 ppm, finer between -5 and 5 ppm. A normalization image was acquired at an offset frequency of -300 ppm. Total acquisition time for both B1 was 13min 24s.
The evaluation of CEST data was done according to 7,8 including motion correction, normalization, denoising and B0/B1 correction. Then, voxel-wise fitting of Z-spectra using a 5-pool Lorentzian model (water, amide, relayed Nuclear Overhauser Effect NOE, amine, semi solid Magnetization Transfer ssMT) yields the CEST-pool parameters (amplitude, width, spectral position) examined in this work.
Results
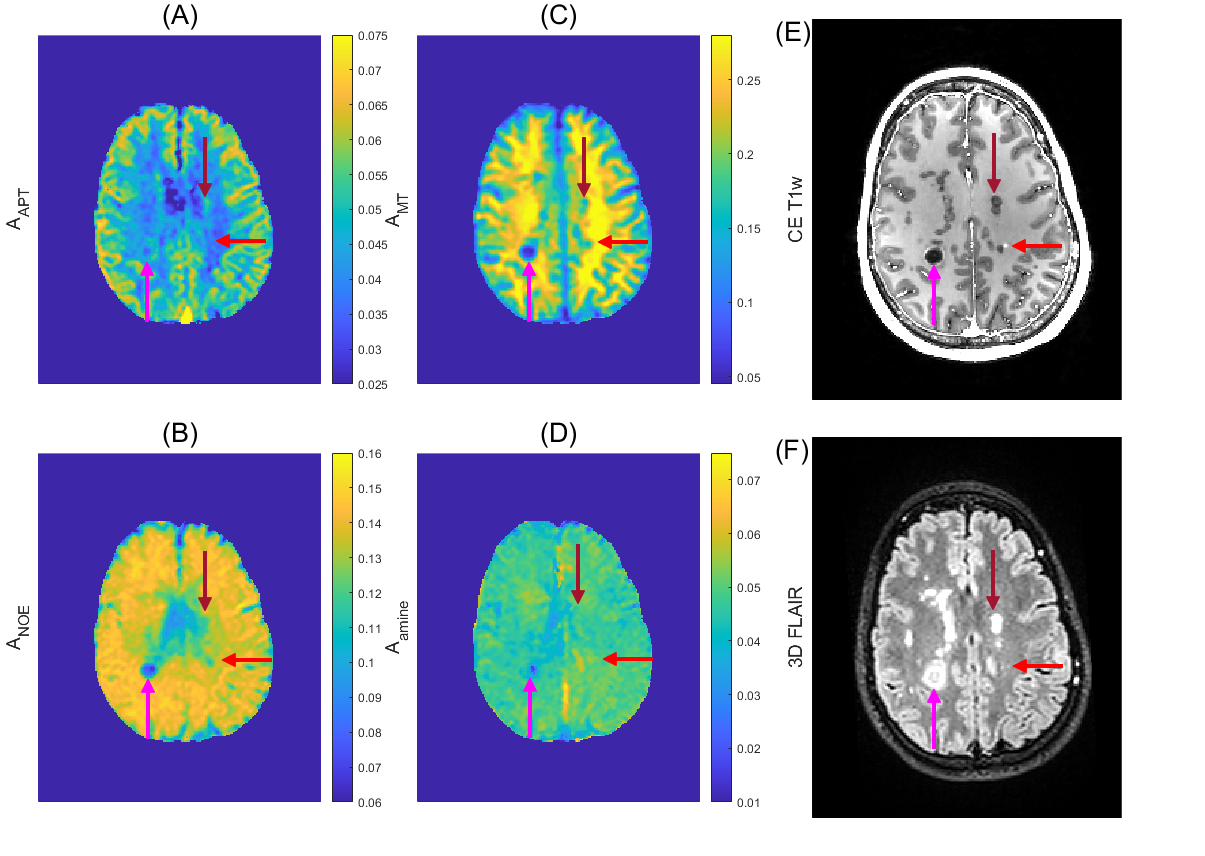
The four CEST amplitudes, a contrast enhanced T1w image as well as a 3D FLAIR of a female patient with RRMS are shown in Figure 1. Regions of interest (ROI’s) were drawn by a trained neuroradiologist to capture a variety of inactive (old), active lesions and appropriate reference tissue. The mean and standard deviation of these ROI’s was calculated for the CEST amplitudes amide, NOE, (ss)MT and Amine in Figure 2, specified by column. Each row denoted by a letter refers to one patient, (A) refers to the patient from Figure 1.Our main hypothesis, that gadolinium enhancement of active MS lesions can also be seen with 7T amide CEST, could not be clearly verified. Some active lesions are hyper-intense in amide CEST (Figure 1, pink arrow), others are isointense (Fig 1, red arrow), and in patient 2 (Figure 2B) the Gd-hyper-intense regions is even hypo-intense in amide CEST. Most inactive lesions (FLAIR-dark parts of lesions indicated by pink and red arrow in Figure 1) also showed hypo-intensities in different CEST and MT contrasts, yet, ROI analysis (Figure 2) could also not reveal a clear pattern to distinguish active from non-active lesions in the three observed patients.
Examining the values of the lesion ROI’s at the remaining Lorentzian fit parameters – peak width and spectral position – did not yield additional insight nor information (data not shown).
Discussion
CEST imaging could potentially detect Myelin-depletion9 or change in glutamate homeostasis10 relevant for MS lesion detection. With the current low saturation amplitude multi-pool CEST experiment, MS-Lesions (>3mm diameter) were detectable in CEST parameter maps. The active lesion identified with the red arrow in Figure 1 is rather small and just one voxel of the lower resolved CEST, which might explain that it is not visible. Still, also larger Gd-bright lesions in Figure 2B were not hyper intense. Thus, the correlation of amide CEST and Gadolinium enhancement, previously seen in brain tumors3, is only given in specific lesions, but not in all (Figure 2). Direct correlations of CEST maps and clinical imaging are not confirmable.Together with high information content of CEST in general, a higher amide CEST value in active lesions – caused by a larger protein content – might originate from an acute immune reaction in that area. Likewise, a decreased amide/NOE/MT value in inactive regions – paired with a hypointensity in contrast enhanced T1 weighted imaging – refers to a direct damage of tissue, specifically depletion of myelin. This aligns well with the results of 11, where MS-Lesions were identified using NOE weighted imaging.
In the findings of 10, separation of lesion type into active and non-active (old) was shown to be possible by applying a B1 amplitude of approximately 2.0 μT (continuous wave equivalent). This B1 amplitude is more sensitive to the exchange of Glutamate, which is said to be altered in Multiple Sclerosis lesions. Thus, the changed CEST contribution might require a higher B1 amplitude to be sufficiently labeled, compared to the labeling used in the present study.
Conclusion
We tested a 7T multi-pool CEST protocol, which previously showed Gd-enhancement-like structures in brain tumors, in MS patients. While some lesions showed these, other active lesions in just three measured patients already have not shown a correlation with Gadolinium contrast enhancement. The heterogeneous outcome must be further investigated for biological or clinical correlation.Acknowledgements
No acknowledgement found.References
1. Min, Y., Kristiansen, K., Boggs, J. M., Husted, C., Zasadzinski, J. A., & Israelachvili, J. (2009). Interaction forces and adhesion of supported myelin lipid bilayers modulated by myelin basic protein. Proceedings of the National Academy of Sciences, 106(9), 3154-3159.
2. Macrez, R., Stys, P. K., Vivien, D., Lipton, S. A., & Docagne, F. (2016). Mechanisms of glutamate toxicity in multiple sclerosis: biomarker and therapeutic opportunities. The Lancet Neurology, 15(10), 1089-1102.
3. Goerke, S., Soehngen, Y., Deshmane, A., Zaiss, M., Breitling, J., Boyd, P. S., ... & Bachert, P. (2019). Relaxation‐compensated APT and rNOE CEST‐MRI of human brain tumors at 3 T. Magnetic resonance in medicine, 82(2), 622-632.
4. Liebert A, Zaiss M, Gumbrecht R, et al. Multiple interleaved mode saturation (MIMOSA) for B1+ inhomogeneity mitigation in chemical exchange saturation transfer. Magnetic Resonance in Medicine 2019;82:693–705 doi: 10.1002/mrm.27762.
5. Zaiss M, Ehses P, Scheffler K. Snapshot-CEST: Optimizing spiral-centric-reordered gradient echo acquisition for fast and robust 3D CEST MRI at 9.4 T. NMR in Biomedicine 2018;31:e3879 doi: 10.1002/nbm.3879
6. Griswold, Mark A., et al. "Generalized autocalibrating partially parallel acquisitions (GRAPPA)." Magnetic Resonance in Medicine: An Official Journal of the International Society for Magnetic Resonance in Medicine 47.6 (2002): 1202-1210.
7. Johannes Windschuh et al. “Correction of B1-inhomogeneities for Relaxation compensated CEST imaging at 7 T”. In: NMR in biomedicine 28.5 (2015), pp. 529–537.
8. Katrin Michaela Khakzar, ed. 7 tricks for 7T CEST – improving reproducibility of multi-pool evaluation. 8th InternationalWorkshop on Chemical Exchange Saturation Transfer Imaging, 2020.
9. Lee, Do-Wan, et al. "Temporal Changes in In Vivo Glutamate Signal during Demyelination and Remyelination in the Corpus Callosum: A Glutamate-Weighted Chemical Exchange Saturation Transfer Imaging Study." International Journal of Molecular Sciences 21.24 (2020): 9468.
10. Dula, A. N., Asche, E. M., Landman, B. A., Welch, E. B., Pawate, S., Sriram, S., ... & Smith, S. A. (2011). Development of chemical exchange saturation transfer at 7T. Magnetic Resonance in Medicine, 66(3), 831-838.
11. Huang, J., Xu, J., Lai, J. H., Chen, Z., Lee, C. Y., Mak, H. K., ... & Chan, K. W. (2021). Relayed nuclear Overhauser effect weighted (rNOEw) imaging identifies multiple sclerosis. NeuroImage: Clinical, 102867.
Figures