1637
The relationship between hippocampal NAA and functional connectivity within the Default Mode Network in Mild Cognitive Impairment1School of Biomedical Engineering, University of Sydney, Sydney, Australia, 2Brain and Mind Centre, University of Sydney, Sydney, Australia, 3School of Psychology, University of Sydney, Sydney, Australia, 4Healthy Brain Ageing Program, Brain and Mind Centre, University of Sydney, Sydney, Australia, 5Centre of Research Excellence to Optimise Sleep in Brain Ageing and Neurodegeneration (CogSleep CRE), Sydney, Australia, 6Sydney Imaging, University of Sydney, Sydney, Australia
Synopsis
We investigated the association between two MR markers of Mild Cognitive Impairment (MCI): N-Acetylaspartate (NAA) measured by MR Spectroscopy within the hippocampus; and functional connectivity within the Default Mode Network (DMN). We showed differential relationships between functional coupling/connectivity and NAA in MCI and controls, with an association between these measures in MCI not evident in controls. For those with MCI, we detected 20 connections within the DMN associated with NAA levels, with stronger connectivity associated with lower NAA levels. This suggests change in NAA within the hippocampus is associated with functional change within the DMN for those with MCI.
Introduction
Mild Cognitive Impairment (MCI) is an important ‘at risk’ stage prior to the onset of dementia, whereby ~45% convert to dementia over a five-year period1. MCI diagnosis can be divided into two types: Amnestic (MCI-A) and Non-Amnestic (MCI-NA), with these diagnoses based on performance on neuropsychological measures and associated with distinct progression patterns1. The MCI period may provide a critical window for early or secondary prevention of dementia, so understanding critical brain changes underpinning MCI is warranted, both from a scientific and clinical perspective.MCI is associated with reductions of N-Acetylaspartate (NAA, a proxy of neuronal integrity), as measured using MR Spectroscopy (MRS)2, and changes in functional connectivity within the default mode network (DMN)3-7. The pattern of change within the DMN in aging does not appear linear, with both instances of hyper- and hypo-connectivity3-7. NAA levels are reduced in multiple areas with the brain, including within the hippocampus, a region known to be impacted in MCI, both structurally8 and functionally9.
This study investigated the association between NAA levels within the hippocampus, as a sensitive proxy of hippocampal neuronal health, and functional connectivity within the DMN for participants with MCI.
Methods
Eighty-one participants (51 MCI, 30 controls) completed a T1-weighted anatomical scan, a resting-state functional MRI (rsfMRI) and a left hippocampal Point REsolved Spectroscopy Sequence (PRESS). Parameters for rsfMRI: TR = 3000ms, TE = 36ms, 90° flip angle, 39 axial slices covering the whole brain, 220 mm FoV, 0.4 mm interslice gap, and voxel size = 3.4×3.4×3 mm3 (matrix: 64x64; total scan time: 6.5 min). The PRESS acquisition had a voxel size of 10×15×30 mm3, TR = 2000ms, TE = 35ms, 128 averages. Participant demographic details are given in Table 1.rsfMRI Processing
The rsfMRI was pre-processed using fMRIPrep 20.2.0rc110,11, followed by bandpass filtering (0.01 to 0.08 Hz). The 36 regions definition of the DMN network in the Brainnetome Atlas12 were used to investigate the functional connectivity. DMN connectivity matrices were built using Pearson’s correlation, creating a 36×36 connectivity matrix for each individual.MRS Processing
LCModel13 was used to quantify NAA within the left hippocampus. The tissue composition of the voxel was ascertained using the Gannet CoRegStandAlone14,15 function (which uses spm12 segmentation16) and metabolite estimates were corrected for tissue visible water17-19.Hippocampal volume
To account for differing levels of atrophy within this aging cohort, left hippocampal volume and total intracranial volume were quantified using Freesurfer20 and the Desikan-Killiany atlas21. The left hippocampal volume as a proportion of total intracranial volume (i.e. left hippocampus / total intracranial volume×100) was calculated.NAA-DMN Association
The False Discovery Rate (FDR) function of the NBS Toolbox22 was used to identify connections within the DMN associated with change in NAA levels, within the MCI group and the control group separately. In the primary analysis, age, sex, and hippocampal volume were used as covariates. Additionally, a model was run with hippocampal volume as a predictor, with NAA, age and gender as covariates, to ascertain the effect of hippocampal volume (as a proxy for atrophy).MCI-Subtype Analysis
To further evaluate the edges identified by the FDR, the connectivity of each edge was corrected for the covariates of age, sex and hippocampal volume. The corrected connectivities were used in a linear model, with NAA levels, MCI subtype and the interaction between NAA levels and MCI type terms. An ANOVA was used to assess the significance of model predictors.Results
NAA-DMN Association
In the MCI group, we identified 20 connections within the DMN that were significantly associated with NAA levels in the MCI group (Figure 3), while controlling for age, sex and hippocampal volume. These connections showed an inverse relationship, i.e. increased connectivity with decreased NAA levels.The corresponding analysis within the control group did not identify any edges with an association between NAA levels and functional connectivity. In both groups (MCI and control), investigations of the effect of left hippocampal volume, while controlling for NAA, age and sex, showed no effect of volume on DMN connectivity, suggesting that links between NAA levels and DMN connectivity is specific to the NAA, rather than a result of general hippocampal atrophy.
Effect of MCI diagnosis
When investigating the effects of MCI subtype, NAA levels and the interaction between the two, there was one edge that showed a significant interaction between MCI subtype and NAA levels, the connection between the left medial frontal gyrus and right inferior parietal lobe. This is shown in Figure 4.Conclusion
These findings suggest that combining measures of neurodegeneration (like NAA levels) and changes in functional connectivity could provide a promising avenue for MRI markers that might be more sensitive to the early cognitive decline and thus provide targets for treatment to enable earlier intervention.Acknowledgements
The authors acknowledge the technical assistance and facilities provided by Sydney Imaging and the Sydney Informatics Hub, two Core Research Facilities of the University of Sydney.References
1 Gauthier, S. et al. Mild cognitive impairment. The Lancet 367, 1262-1270, doi:10.1016/s0140-6736(06)68542-5 (2006).
2 Tumati, S., Martens, S. & Aleman, A. Magnetic resonance spectroscopy in mild cognitive impairment: systematic review and meta-analysis. Neurosci Biobehav Rev 37, 2571-2586, doi:10.1016/j.neubiorev.2013.08.004 (2013).
3 Badhwar, A. et al. Resting-state network dysfunction in Alzheimer's disease: A systematic review and meta-analysis. Alzheimers Dement (Amst) 8, 73-85, doi:10.1016/j.dadm.2017.03.007 (2017).
4 Dennis, E. L. & Thompson, P. M. Functional brain connectivity using fMRI in aging and Alzheimer's disease. Neuropsychol Rev 24, 49-62, doi:10.1007/s11065-014-9249-6 (2014).
5 Eyler, L. T. et al. Resting State Abnormalities of the Default Mode Network in Mild Cognitive Impairment: A Systematic Review and Meta-Analysis. J Alzheimers Dis 70, 107-120, doi:10.3233/JAD-180847 (2019).
6 Bai, F. et al. Specifically progressive deficits of brain functional marker in amnestic type mild cognitive impairment. PLoS One 6, e24271, doi:10.1371/journal.pone.0024271 (2011).
7 Jin, M., Pelak, V. S. & Cordes, D. Aberrant default mode network in subjects with amnestic mild cognitive impairment using resting-state functional MRI. Magn Reson Imaging 30, 48-61, doi:10.1016/j.mri.2011.07.007 (2012).
8 Shi, F., Liu, B., Zhou, Y., Yu, C. & Jiang, T. Hippocampal volume and asymmetry in mild cognitive impairment and Alzheimer's disease: Meta-analyses of MRI studies. Hippocampus 19, 1055-1064, doi:10.1002/hipo.20573 (2009).
9 Dickerson, B. C. & Sperling, R. A. Functional abnormalities of the medial temporal lobe memory system in mild cognitive impairment and Alzheimer's disease: insights from functional MRI studies. Neuropsychologia 46, 1624-1635, doi:10.1016/j.neuropsychologia.2007.11.030 (2008).
10 Esteban, O. et al. fMRIPrep: a robust preprocessing pipeline for functional MRI Zenodo (2018).
11 Esteban, O. et al. fMRIPrep: a robust preprocessing pipeline for functional MRI. Nat Methods 16, 111-116, doi:10.1038/s41592-018-0235-4 (2019).
12 Fan, L. et al. The Human Brainnetome Atlas: A New Brain Atlas Based on Connectional Architecture. Cereb Cortex 26, 3508-3526, doi:10.1093/cercor/bhw157 (2016).
13 Provencher, S. W. Automatic quantitation of localizedin vivo1H spectra with LCModel. NMR in Biomedicine 14, 260-264, doi:10.1002/nbm.698 (2001).
14 Edden, R. A., Puts, N. A., Harris, A. D., Barker, P. B. & Evans, C. J. Gannet: A batch-processing tool for the quantitative analysis of gamma-aminobutyric acid-edited MR spectroscopy spectra. J Magn Reson Imaging 40, 1445-1452, doi:10.1002/jmri.24478 (2014).
15 Harris, A. D., Puts, N. A. & Edden, R. A. Tissue correction for GABA-edited MRS: Considerations of voxel composition, tissue segmentation, and tissue relaxations. J Magn Reson Imaging 42, 1431-1440, doi:10.1002/jmri.24903 (2015).
16 Ashburner, J. & Friston, K. J. Unified segmentation. NeuroImage 26, 839-851, doi:10.1016/j.neuroimage.2005.02.018 (2005).
17 Gasparovic, C., Chen, H. & Mullins, P. G. Errors in 1H‐MRS estimates of brain metabolite concentrations caused by failing to take into account tissue‐specific signal relaxation. NMR in Biomedicine 31, e3914 (2018).
18 Gasparovic, C. et al. Use of tissue water as a concentration reference for proton spectroscopic imaging. Magn Reson Med 55, 1219-1226, doi:10.1002/mrm.20901 (2006).
19 Near, J. et al. Preprocessing, analysis and quantification in single-voxel magnetic resonance spectroscopy: experts' consensus recommendations. NMR Biomed., e4257, doi:10.1002/nbm.4257 (2020).
20 Fischl, B. FreeSurfer. NeuroImage 62, 774-781, doi:10.1016/j.neuroimage.2012.01.021 (2012).
21 Desikan, R. S. et al. An automated labeling system for subdividing the human cerebral cortex on MRI scans into gyral based regions of interest. NeuroImage 31, 968-980, doi:10.1016/j.neuroimage.2006.01.021 (2006).
22 Zalesky, A., Fornito, A. & Bullmore, E. T. Network-based statistic: identifying differences in brain networks. NeuroImage 53, 1197-1207, doi:10.1016/j.neuroimage.2010.06.041 (2010).
Figures
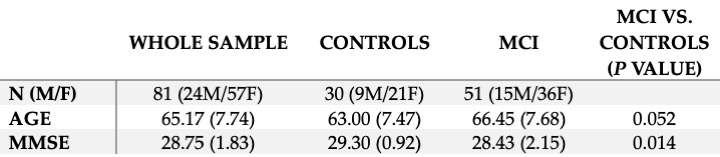
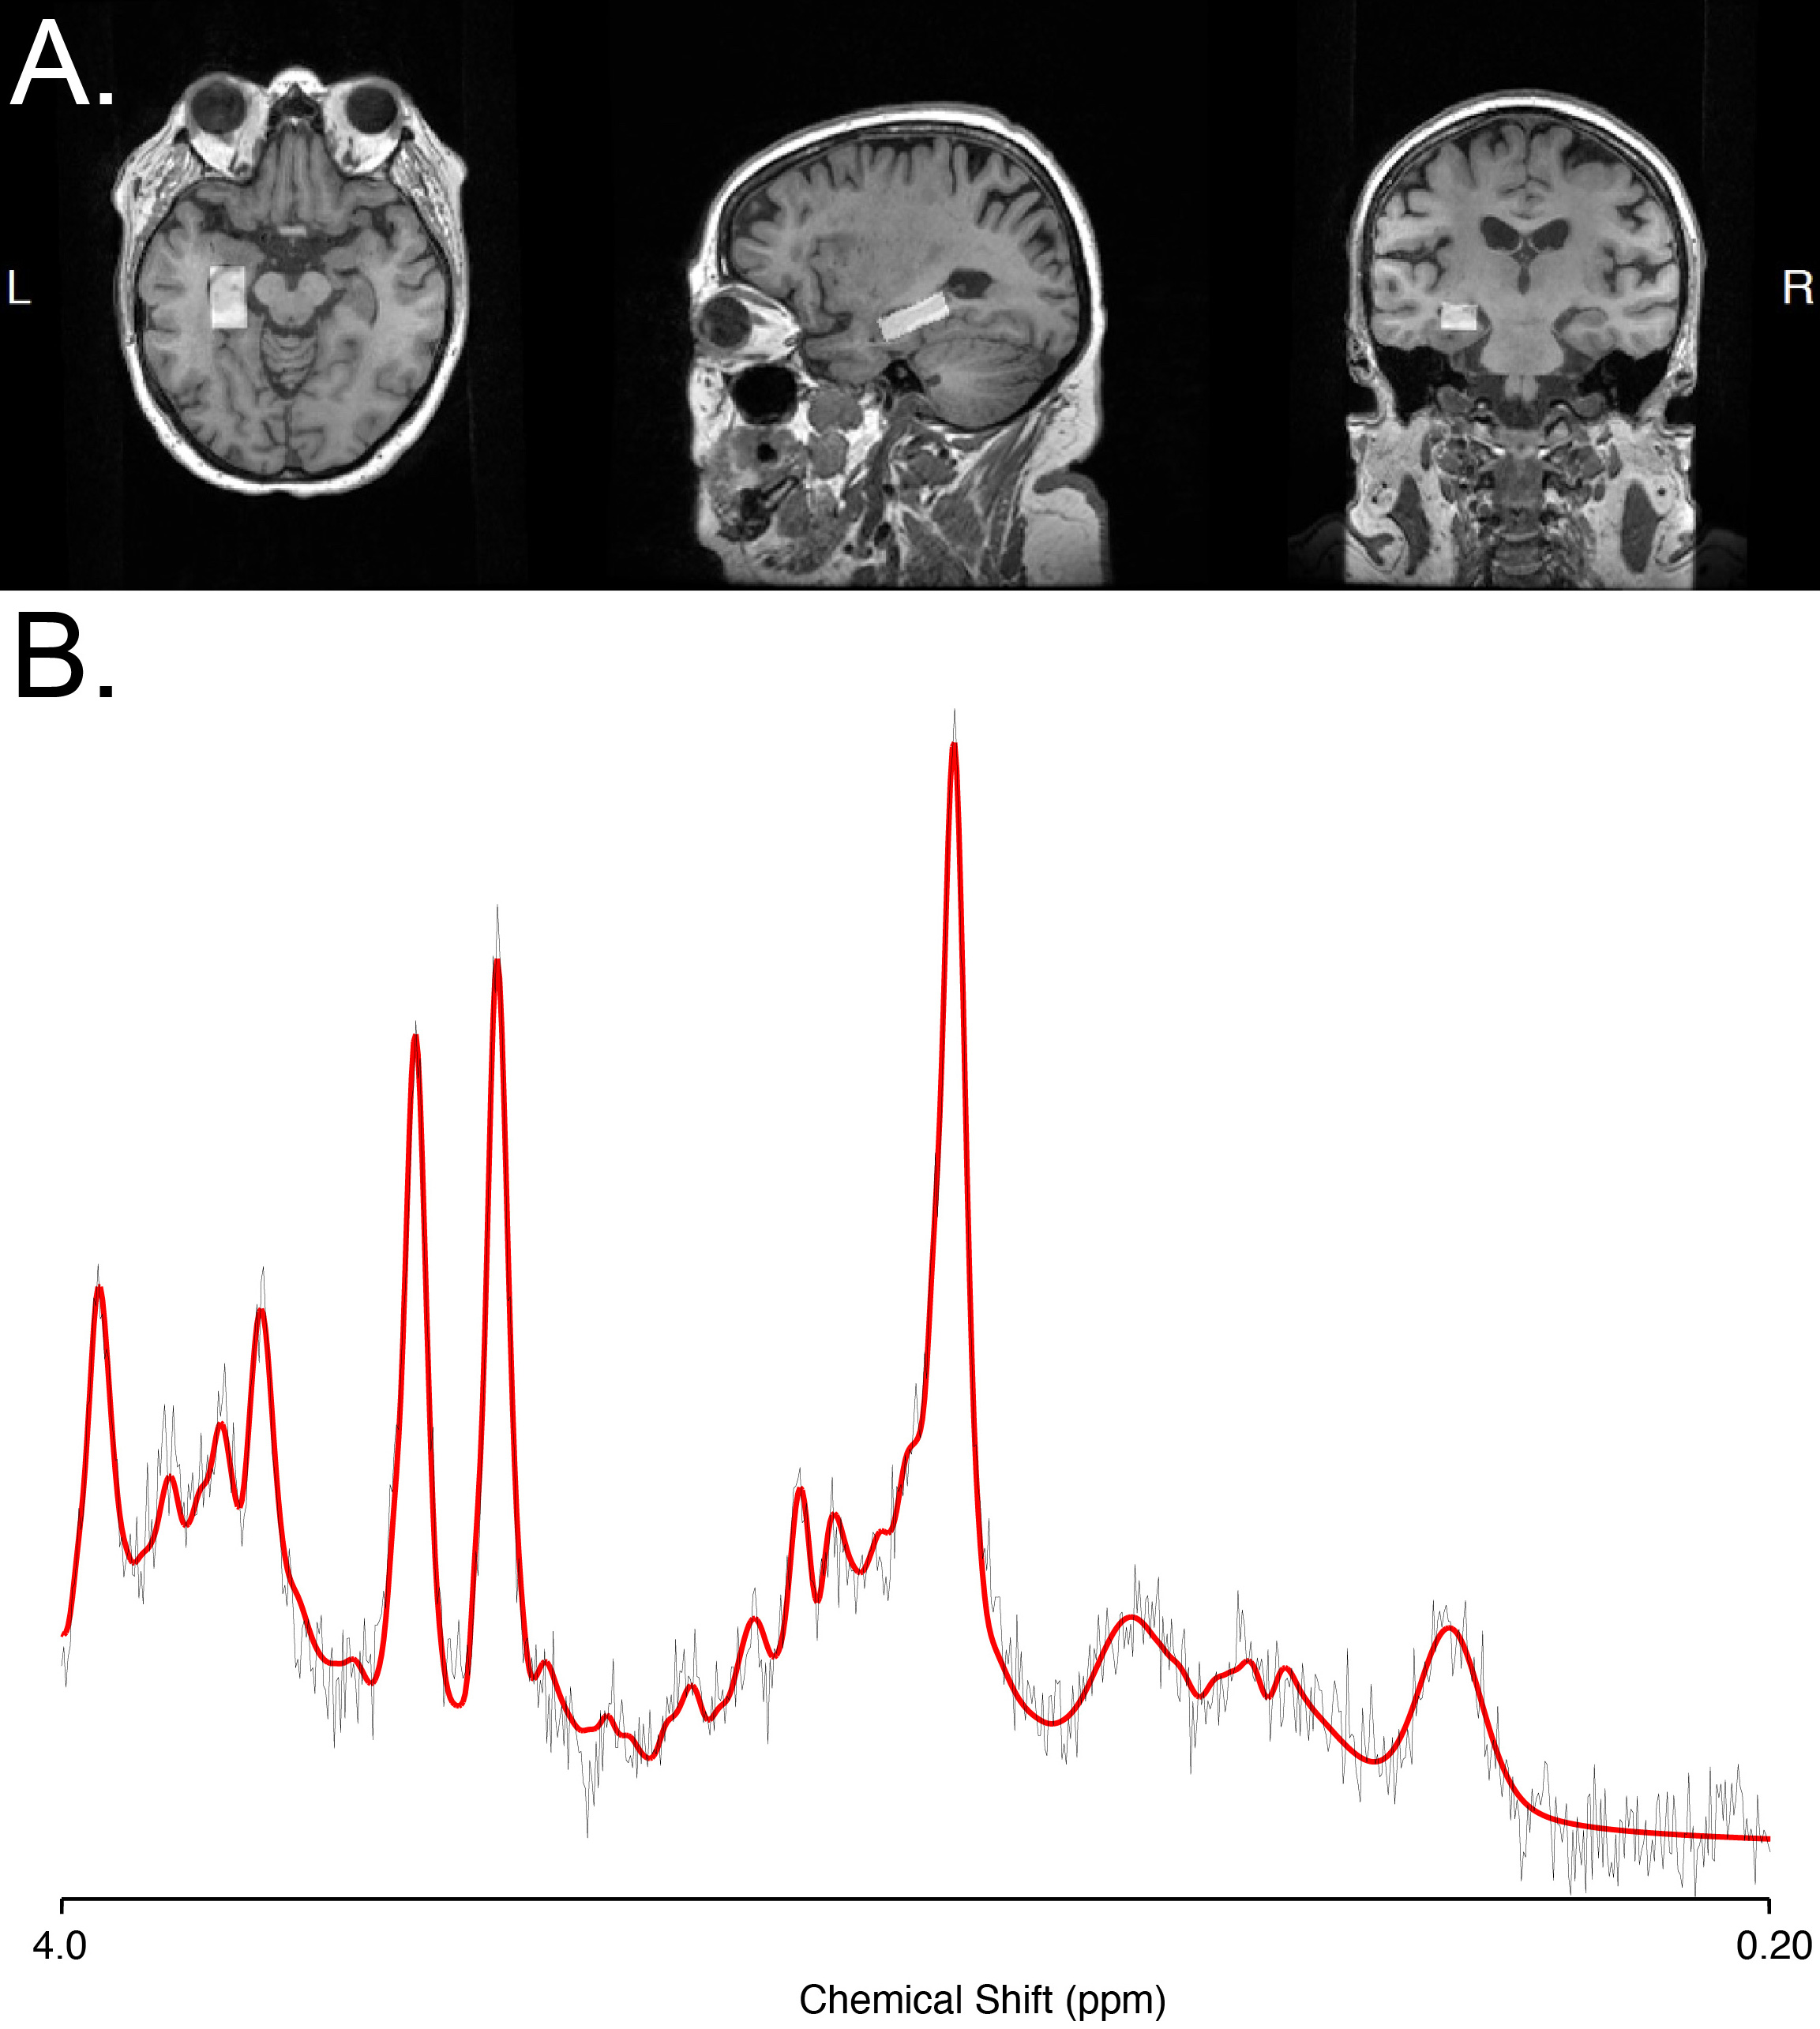
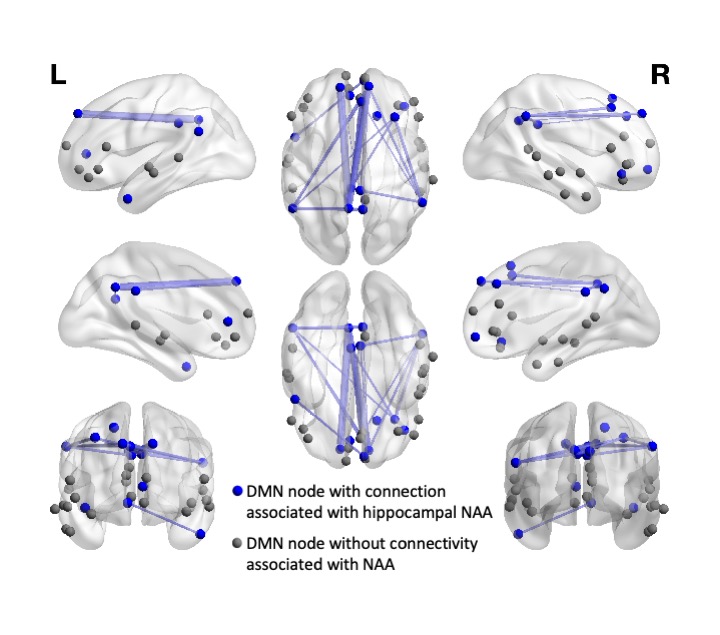
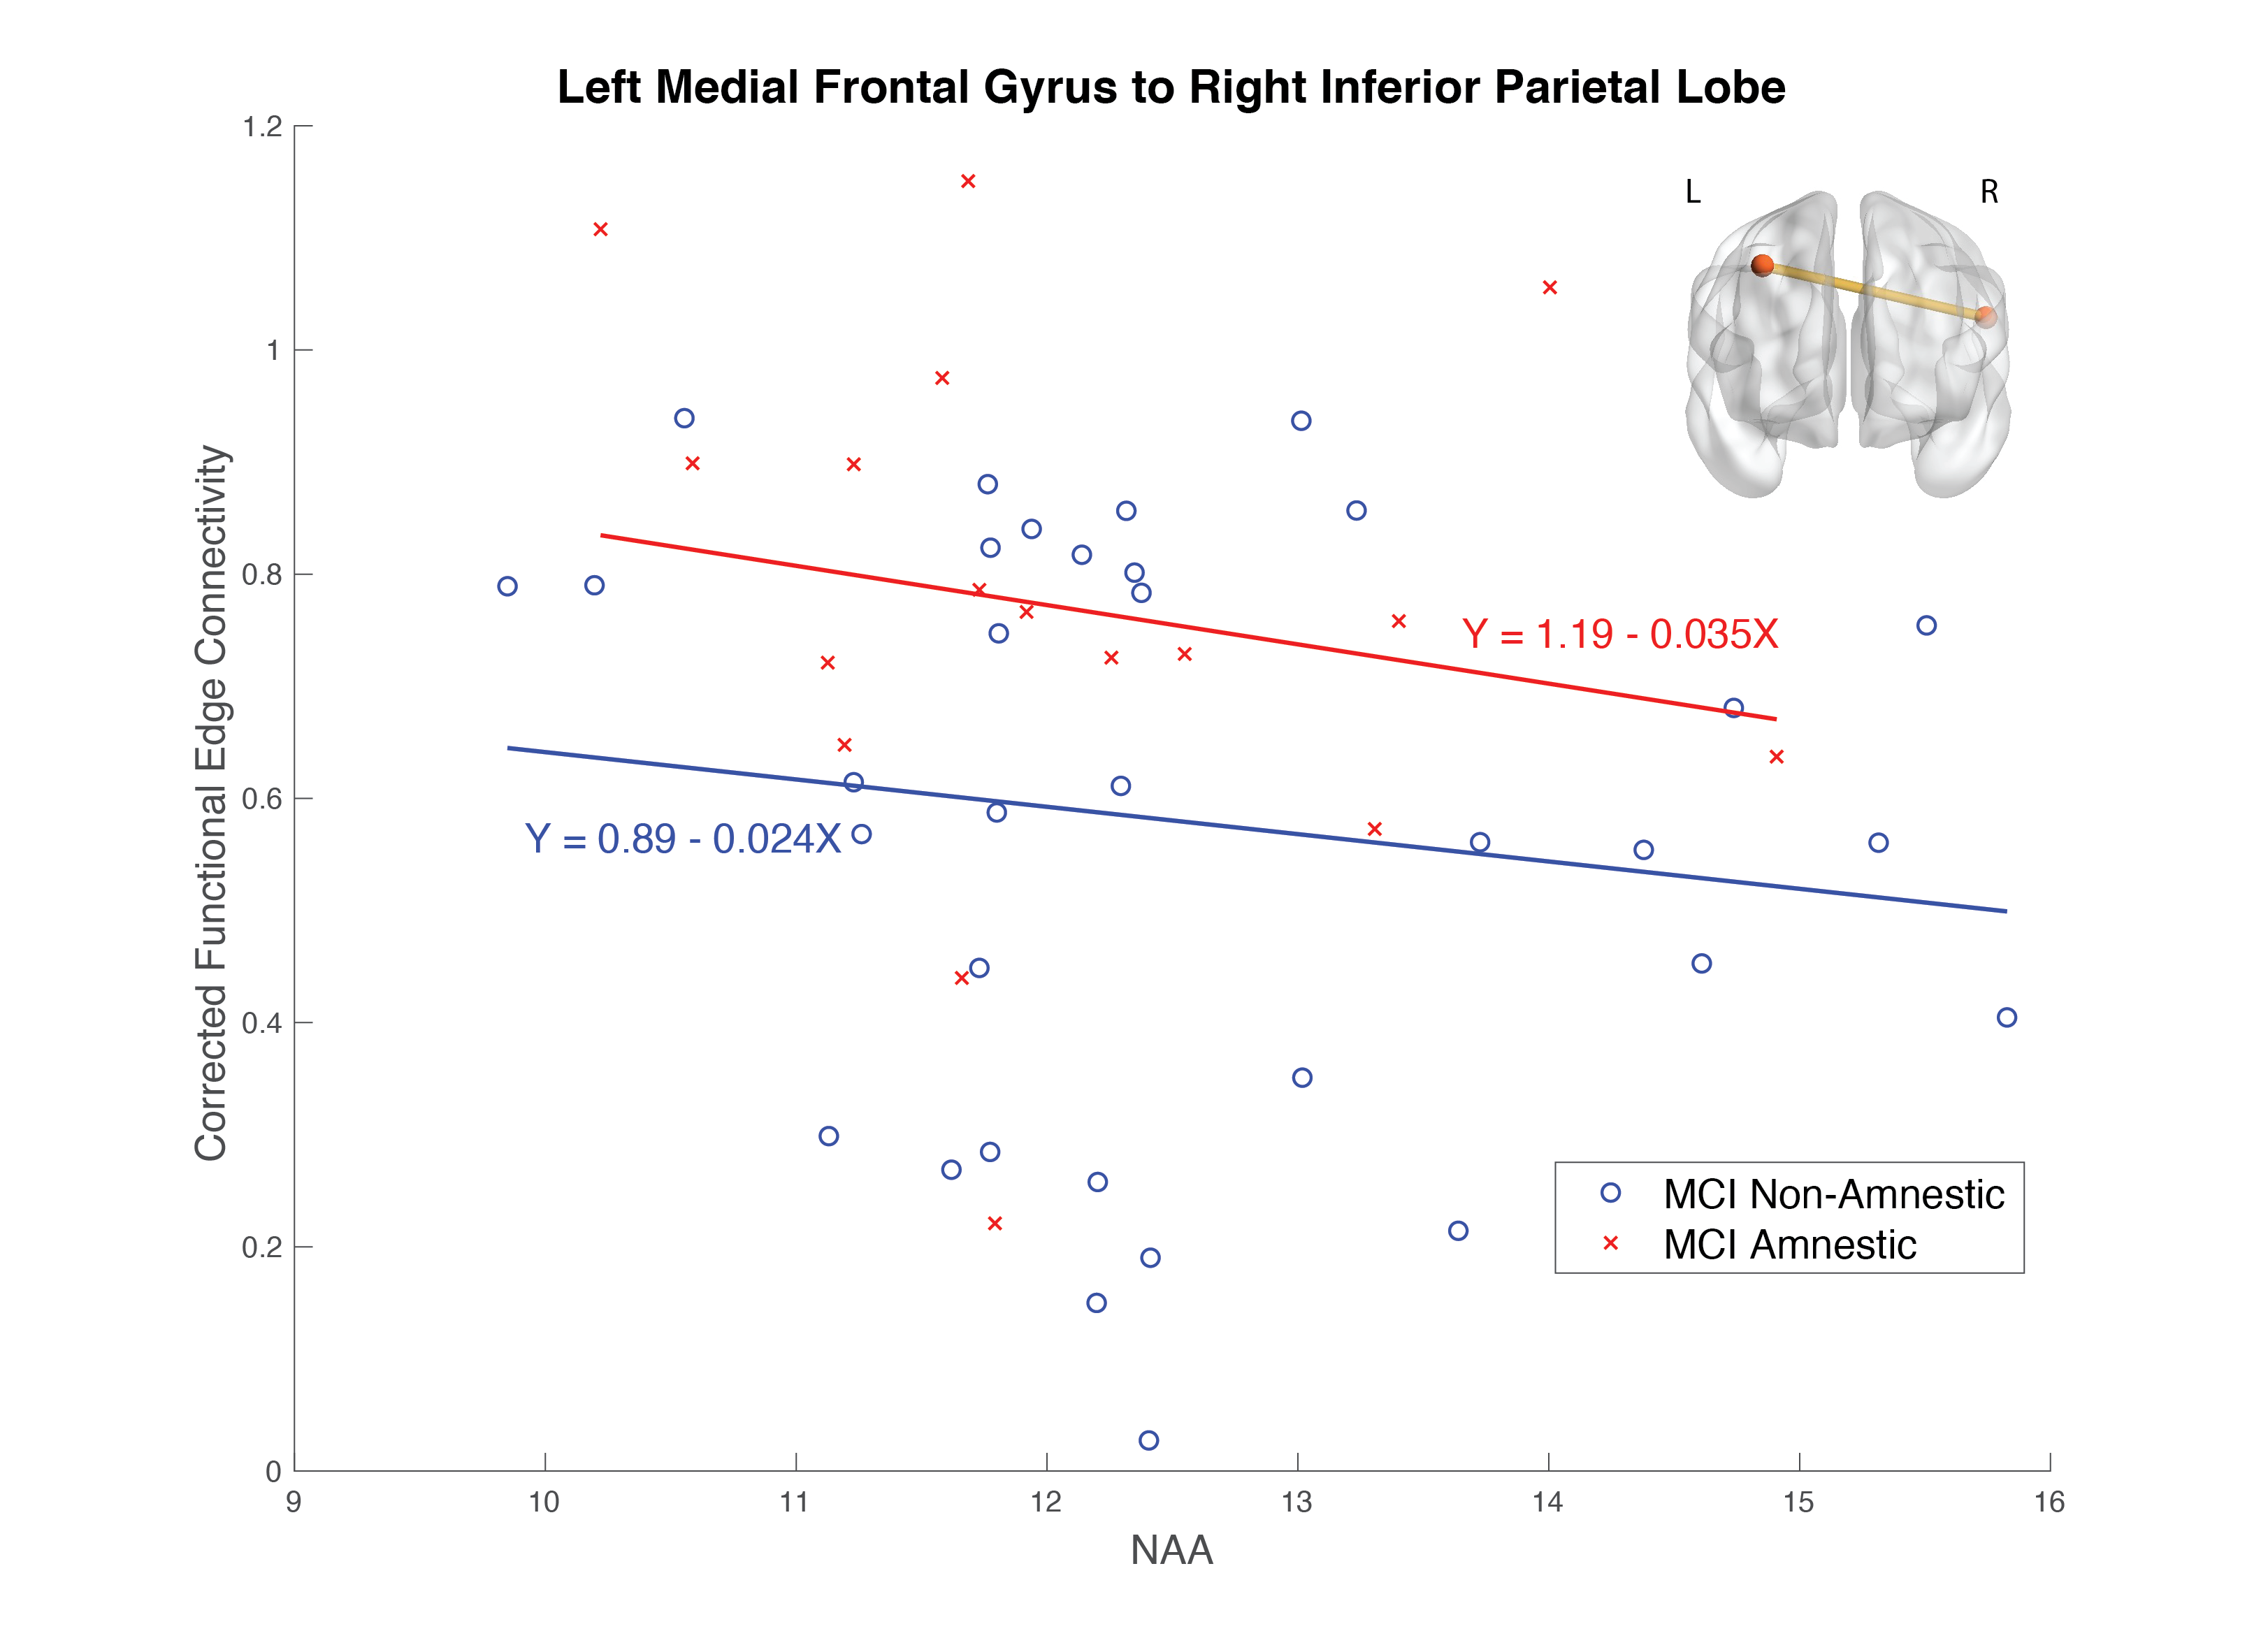
Figure 3. The association between NAA levels and functional connectivity (corrected for age, sex and hippocampal volume) by MCI subtype. MCI-Amnestic is shown in red, MCI-Non-Amnestic is in blue. This connection, between the left medial frontal gyrus and right inferior parietal lobe was the only edge which showed an interaction between NAA levels and MCI subtype (amnestic vs. non-amnestic) on functional connectivity.
Inset brain illustrates the connection between the left medial frontal gyrus to the right inferior parietal lobe.