1636
MRSI DETECTABLE CHOLINE METABOLISM AS MARKER FOR GENDER DIFFERENCES IN AGING1Goethe-University Frankfurt, Frankfurt, Germany, 2Justus-Liebig-University of Giessen, Giessen, Germany
Synopsis
Combining quantitative (mmol/l) 1H MRSI and 31P MRSI data from the brain of healthy volunteers revealed a choline component (rCho=tCho-(PCho+GPC)) which is visible with 1H MRSI but missing in 31P MRSI. This component, which may account for a fraction of mobile phospholipids, is reduced in young female (mean age 26) subjects. Lower levels would indicate a higher integrity of the membrane phospholipids in the brain of young women. A possible reason is the higher estrogen levels in this group.
Background & Purpose
Phospholipid membranes of the brain are involved in important signaling functions and cell aging processes. It has been shown that estrogens might change the fluidity and function of membrane phospholipid layers. In vivo 1H/31P MR spectroscopic imaging (MRSI) of the brain allows to quantify different compounds of the membrane lipid metabolism to investigate sex- and/or age-related differences in healthy subjects.Methods
130 healthy volunteers (33 young female, 35 old female, 32 young male and 30 old male; mean age young 26.5 y; mean age old 71 y) were included in the study. In addition to localizer scans the protocol included:- 3D T1w MRI for segmentation (MPRAGE)
- B1 mapping as described in [1]
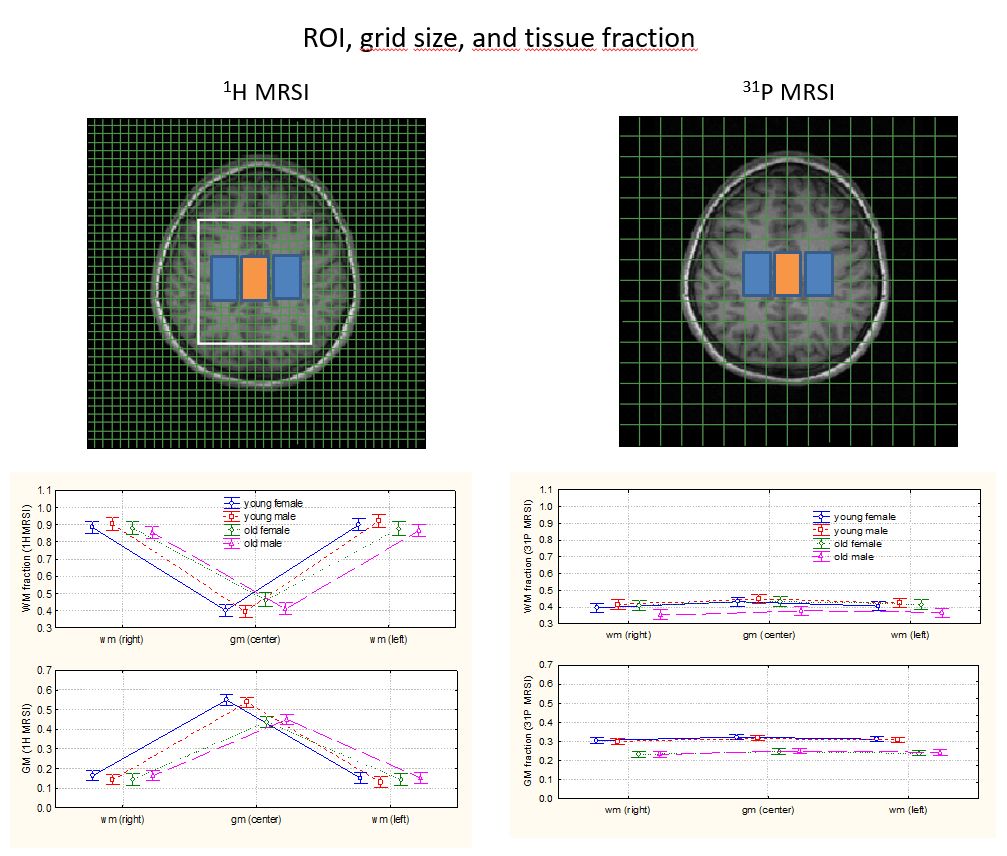
- 2D 1H MRSI at 40 ms TE (sLASER, 12 mm slice, FOV 240x240 mm2, matrix 20x20, repetiton time (TR) 2 s)
- 3D 31P MRSI (FID-CSI, FOV 240x240x200 mm3, matrix 8x8x8, flip angle 60°, TR 2 s )
- 2D 1H MRSI for detection of water (FID-CSI, 25 mm slice, FOV 240x240 mm2, matrix 16x16, flip angle 2°, TR 0.54 s)
Results
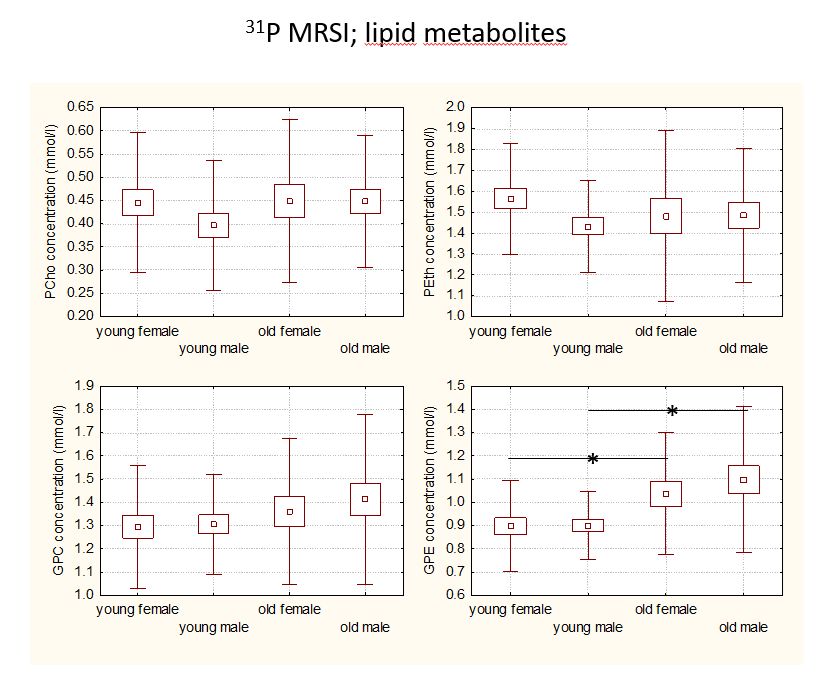
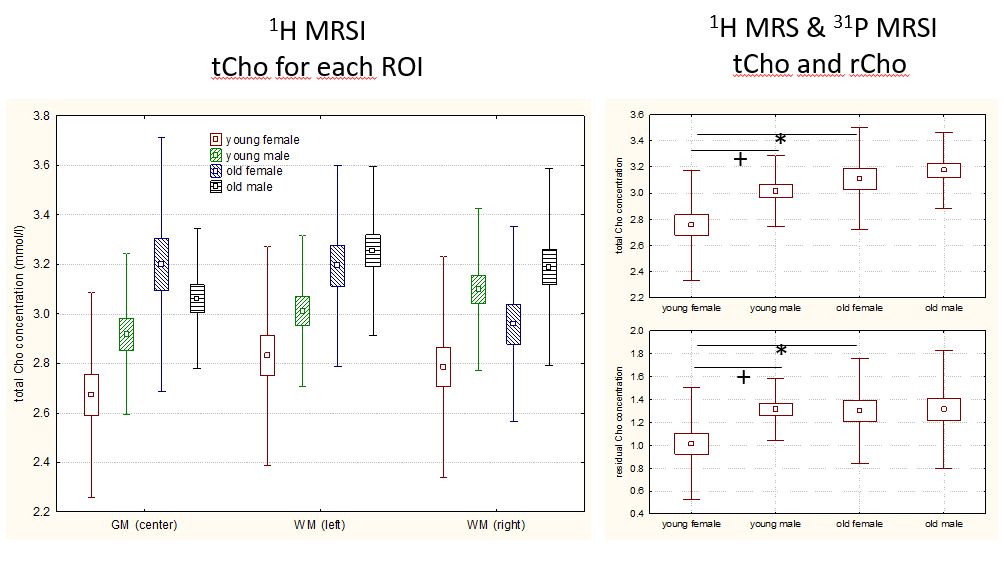
Results for 31P MRS lipid metabolites are summarized in Figure 2. There was a significant increase in GPE when comparing young to old subjects for both genders. For tCho, metabolite concentration could be analyzed in the 3 ROIs separately as shown in the left panel of Figure 3. The most prominent finding is the lowest tCho concentration for young females in all regions. As expected this finding is also valid for the averaged regions shown in the upper right panel of Figure 3. The lower right panel shows the residual choline value. In general, the sum of the phosphorylated compounds PCho and GPC was less than the tCho concentration hinting to a residual choline fraction (rCho) invisible with 31P MRS. This residual component accounts for the lower tCho concentration in young female subjects.Discussion
31P MRS reveals an increased GPE concentration with age. A shift from lipid anabolites towards higher concentrations of catabolites was already observed by Forester et al who found a significant decrease in phosphomonoesters with age [3]. Our study shows no significance for choline containing 31P metabolites. This is in contrast to the 1H MRS data, which show decreased tCho for young females. The difference endures the combination of the two measurements, thus reduced levels of a 31P MRS non-visible Cho compound are typical for young females. A missing component in the tCho signal has been observed in previous MRS studies ([4], [5]). The MR visibility of membrane phospholipids, which resonate at the frequency of the tCho signal but are generally invisible due to immobilization, has been discussed ([6], [7]) as potential mechanism. Thus, rCho would be a marker for a fraction of mobile membrane lipids.Conclusion
Increased rCho may be attributed to increased lipid mobility [6]. Thus, lower levels of rCho would indicate a higher integrity of the membrane phospholipids in the brain of young women. A possible reason is the higher estrogen levels in young women.Acknowledgements
We would like to thank Nadine Brüche for helping us in performing the MR examinations and Ralf Deichmann for calculation of B1-mapsReferences
[1] Volz S, Nöth U, Rotarska-Jagiela A, Deichmann R. A fast B1-mapping method for the correction and normalization of magnetization transfer ratio maps at 3 T. NeuroImage 2010; 49(4):3015
[2] Silaidos, C., Pilatus, U., Grewal, R., Matura, S., Lienerth, B., Pantel, J., Eckert, G. P. Sex-associated differences in mitochondrial function in human peripheral blood mononuclear cells (PBMCs) and brain. Biology of sex differences 2018; 9:34
[3] Forester et al. Age-related changes in brain energetics and phospholipid metabolism. NMR Biomedicine 2010; 23:242
[4] Michaelis T, Merboldt K, Bruhn H, Hänicke W, Frahm J. Absolute concentrations of metabolites in the adult human brain in vivo: quantification of localized proton MR spectra. Radiology 1993; 187:219
[5] Barker PB, Blackband SJ, Chatham JC, Soher BJ, Samphilipo MA, Magee CA, Hilton JD, Strandberg JD, Anderson JH. Quantitative proton spectroscopy and histology of a canine brain tumor model. Magn. Reson. Med. 1993; 30:458
[6] Hattingen et al. Combined 1H and 31P spectroscopy provides new insights into the pathobiochemistry of brain damage in multiple sclerosis; NMR Biomed., 2011; 24:536
[7] Klein, J. Membrane breakdown in acute and chronic neurodegeneration: focus on choline-containing phospholipids. Journal of neural transmission 2000; 107:1027
Figures