1635
A Magnetic Resonance Spectroscopy Method in Characterization of Blood Metabolomics for Alzheimer’s Disease
Leo Cheng1, Isabella Muti1, JianXiang Weng1, Anya Zhong1, Pia Kivisäkk2, Bradley Hyman2, and Steven Arnold2
1Massachusetts General Hospital, Charlestown, MA, United States, 2Massachusetts General Hospital, Boston, MA, United States
1Massachusetts General Hospital, Charlestown, MA, United States, 2Massachusetts General Hospital, Boston, MA, United States
Synopsis
Currently, a definitive AD diagnosis can only be achieved at autopsy, through pathology examinations of brain tissue. No non- or less-invasive examination can yet diagnose and characterize AD during the patient’s life, in turn limiting insights into potential strategies for countering AD modes of progression. Here, using HRMAS MRS, we studied human blood plasma samples obtained from AD and non-AD subjects to reveal potential AD-associated metabolomic changes measurable in blood, which may assist with AD diagnosis and, more importantly, contribute to the development of precision treatments.
Introduction
The National Institute on Aging estimates that more than 5.5 million Americans now suffer from Alzheimer’s disease (AD). The cause of AD is now considered a combination of genetic, environmental, and lifestyle factors; however, its symptoms’ initial appearance in patients’ mid-60s strongly suggests that age-associated factor(s) exist across the course of AD development. At present, a definitive AD diagnosis can be achieved only at autopsy, through pathology examinations of brain tissue.Across AD development and progression – from the presence of predisposing genetic factors and environmental stimuli to the formation of brain AD pathologies – the overall metabolic status, or metabolomics, of brain and other organs must alter in AD patients, moving from the normal homeostasis of healthy individuals to states likely to precede the formation of AD pathologies. For this reason, discovering and understanding AD-associated metabolomic changes in brain and other peripheral systems, such as in blood, may assist with AD early and definitive diagnosis and, more importantly, contribute to the development of precision treatments.
Currently, the major methodologies used in AD metabolomic investigations have been mass spectrometry (MS) and MR spectroscopy (MRS). The development of high-resolution magic angle spinning (HRMAS) MRS for intact tissue analysis further enhanced MRS capability in evaluating blood specimens. The HRMAS method is capable to produce high resolution spectra from blood samples with a volume of 1/5 of a drop of blood.
Methods
The study was approved by our local IRB. A total of 45 frozen blood plasma samples from 35 AD patients (n=16; F=7, Age 77.4±3.6; M=9, Age=78.6±8.5) and nonAD subjects (n=19; F=10, Age=60.2±7.7; M=9, Age=63.2±12.6) were obtained from our local ADRC biospecimen repository. In addition to measure each of these plasma samples individually, among the nonAD subjects, five cases provided plasma samples of three time-points (two-weeks apart) were used to test within- vs. inter-subject metabolic differences for quality assurance (QA), and the rest 30 single time-point AD and nonAD plasmas were used to generate six pooled quality control samples each containing same amount of plasma from each of the 30 samples.All 45 individual samples and 6 pooled controls were kept at -80°C. Before MRS measurements, all samples were allowed to thaw for approximately an hour on ice. After being vortexed, 10 uL of the sample was added to the rotor in addition to 2.5 uL of D2O. HRMAS MRS data were collected on a Bruker AVANCE III HD 600MHz instrument, at 4ºC, with a spinning rate of 3600 Hz, and with a rotor synchronized CPMG method. Spectra analyzed with Bruker Topspin 3.6.2 identified 36 common spectral regions among the individual samples. Statistical analyses on these regions were carried out on JMP from SAS.
Results
As an aspect of QA to ensure that the proposed blood plasma metabolomics is capable to detect inter-subject differences with the acknowledgement of bio-variations overtime within a single subject, we compared the differences of the means, the maximum variations of the means among subjects measured from the five subjects at three different time points, with the mean of the standard errors calculated for each subject according to three time points for all 36 identified spectral regions, as shown in Fig 1, which clearly shown that the former were 16.7±1.4 fold higher than the latter.Systematic QC were evaluated by comparing the means of 36 spectral regions measured from individual samples from the 35 subjects with the means of pooled plasma control samples made from them for the coorsponding regions, as shonw in Fig 2. The linear relatiuonship presented in Fig 2 demonstrate our reliable system in providing quantitative spectral data for metabolomic evaluations of blood plasma.Principal component analysis calculated from the 36 identified spectral regions measured from AD and nonAD subjects presented Principal Component 3 (PC3) with statistically significant capability (p=0.0332) in differentiating AD from nonAD subjects (ROC AUC=0.68).
Discussion & Conclusion
As the preliminary and pilot study of evaluating the ability of HRMAS MRS in the investigation of AD-associate metabolomics measurable with micro-scale human blood samples, our results presented the significant potential for pursuing further research with this approach. In addition to investigations of the implied metabolic pathways reflected by our current data, such as those presented by PC3, studies that consider further differentiations among sub-groups, such as age, gender, and other clinical characteristics are currently underway in our laboratory.Acknowledgements
This project received funding and resources from the following: National Institutes of Health grant S10OD023406, National Institutes of Health grant R21CA243255, National Institutes of Health grant R01AG070257, and the MGH A. A. Martinos Center for Biomedical Imaging.References
No reference found.Figures
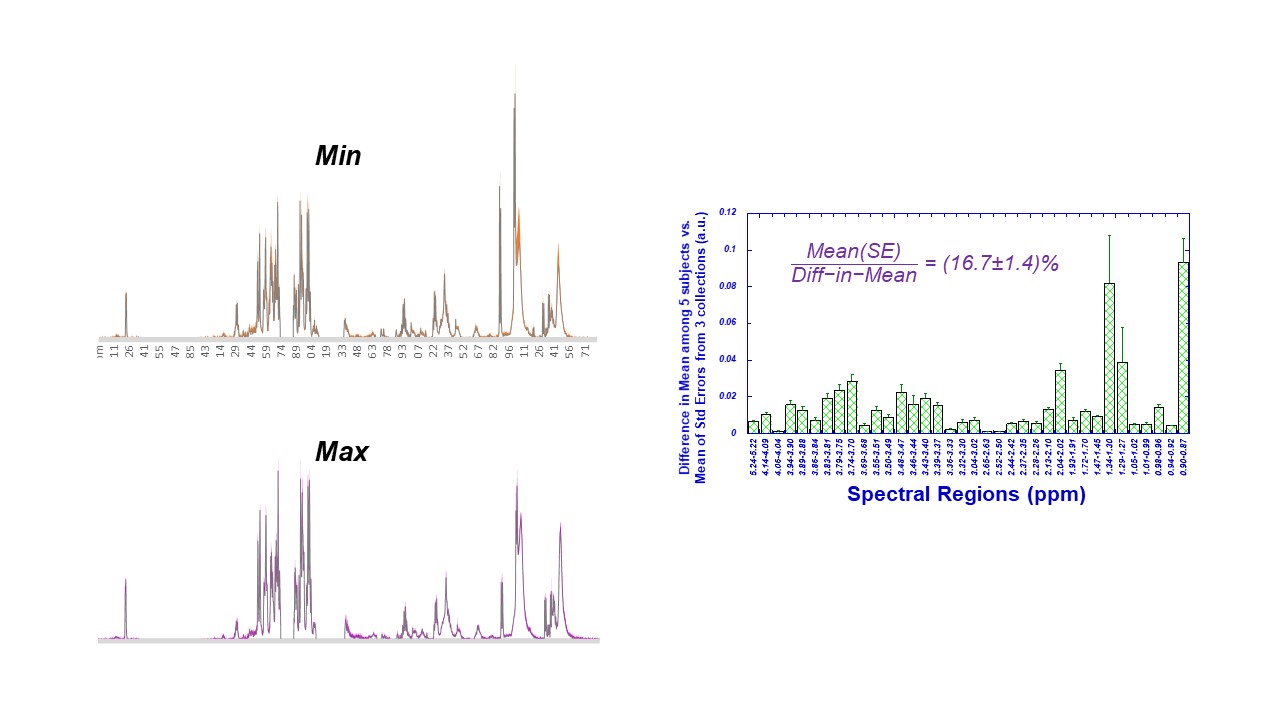
Comparisons
between the differences of the means (solid bars) and the means of standard
errors (error bar) measured from 36 spectral regions of blood plasma from five
subjects.
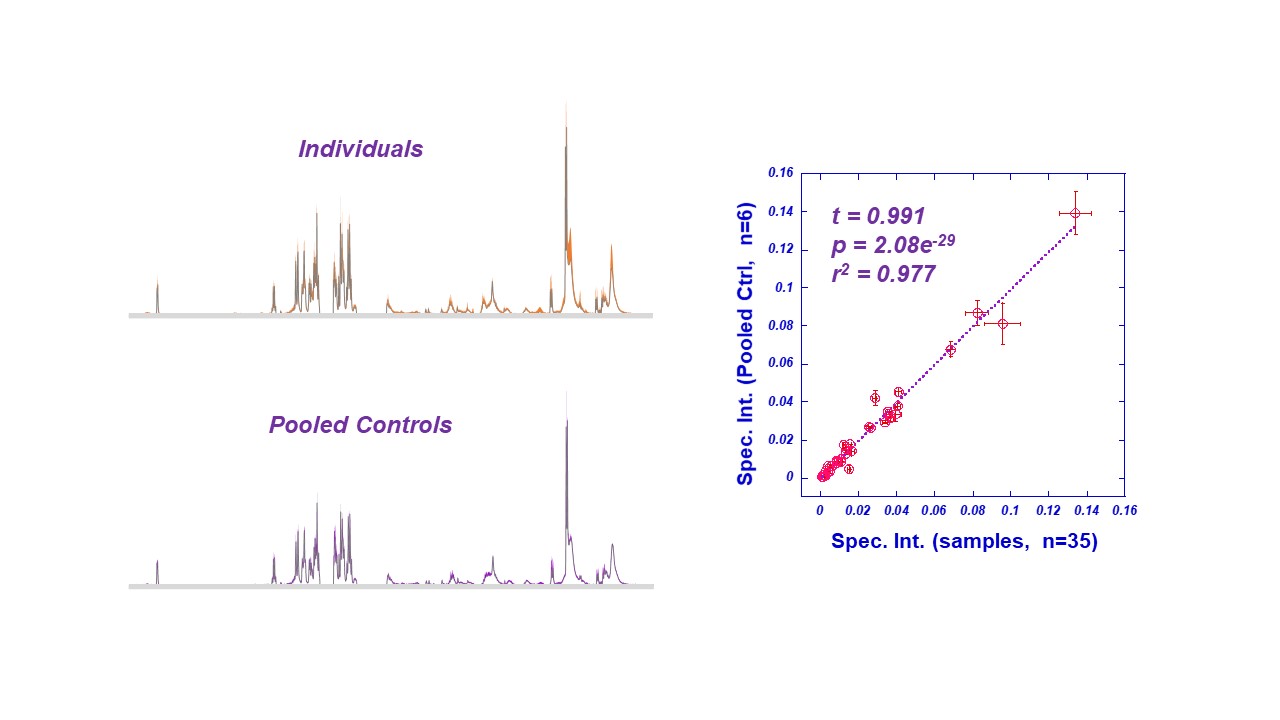
Comparisons
between the means of individual spectral intensities and the means of pooled
control samples measured from 36 spectral regions of blood plasma from AD and
nonAD subjects.
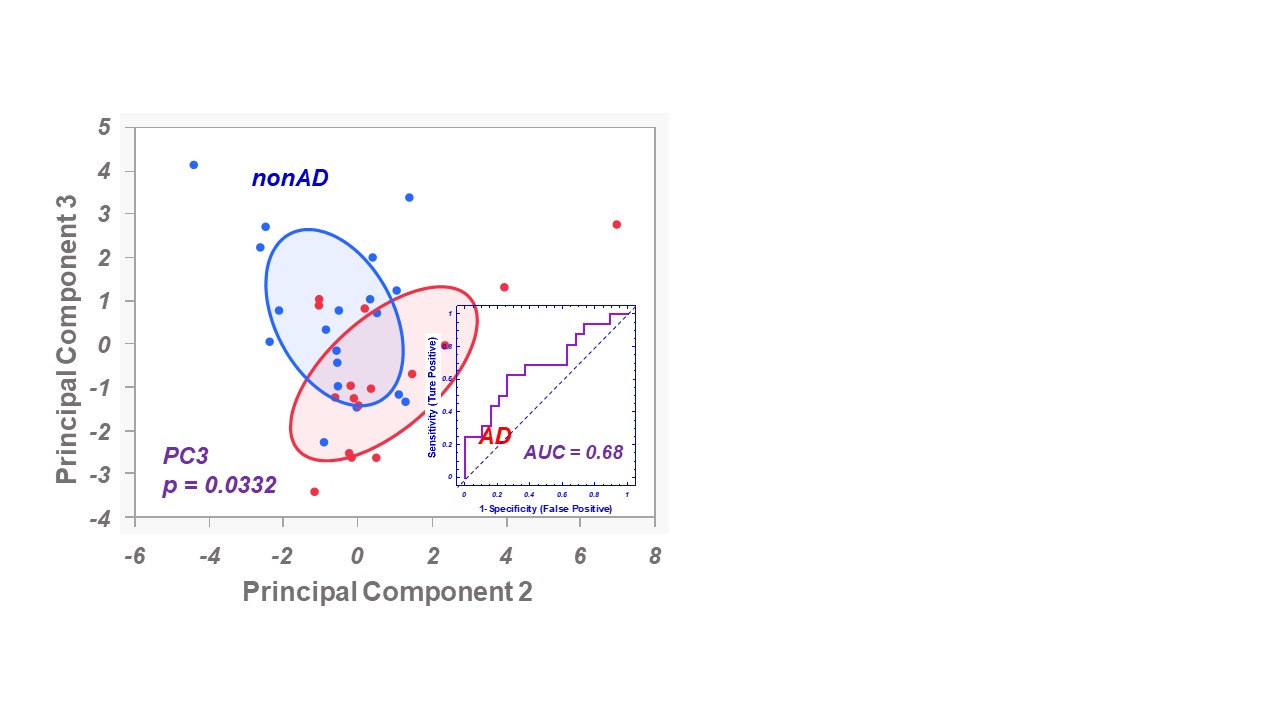
Principal
Component (PC)3 calculated from 36 spectral regions of blood plasma can
differentiate AD from nonAD subjects with statistical significance.
DOI: https://doi.org/10.58530/2022/1635