1632
In vivo CEST imaging of Glutamate and myo-Inositol for early-stage changes in Alzheimer’s 5xFAD mouse model1Radiology, Center for Advance Metabolic Imaging in Precision Medicine, Perelman School of Medicine at The University of Pennsylvania, Philadelphia, PA, United States, 2Center for Advance Metabolic Imaging in Precision Medicine, Perelman School of Medicine at The University of Pennsylvania, Philadelphia, PA, United States
Synopsis
In order to probe the metabolism of glutamate and myo-inositol for better understanding of the Alzheimer’s diseases (AD) we have employed the chemical exchange saturation transfer of glutamate (GluCEST) and myoinositol (MICEST) in a fast progressing, 5xFAD mouse model. There were significant differences observed in the GluCEST and MICEST maps of 5XFAD mice when compared to the wild-type (WT) mice for regions of interest drawn on hippocampus and thalamus, which are further supported by the spectroscopy results.
INTRODUCTION
Glutamate is an important excitatory neurotransmitter that plays a major role in brain functions such as cognition and memory both of which are affected in Alzheimer’s disease (AD)1-5. Whereas myo-Inositol on the other hand serves as brain osmolyte, and its levels are reported to be elevated in the AD mainly thought to be due to the result of functional reactive astrocytes6-8. In this study, our objective was to probe both the glutamate and myo-inositol metabolism in the aggressive transgenic 5xFAD mice9 which represents five mutant human genes associated with AD using the chemical exchange saturation transfer of glutamate (GluCEST)10-15 and myo-inositol (MICEST)16,17.METHODS
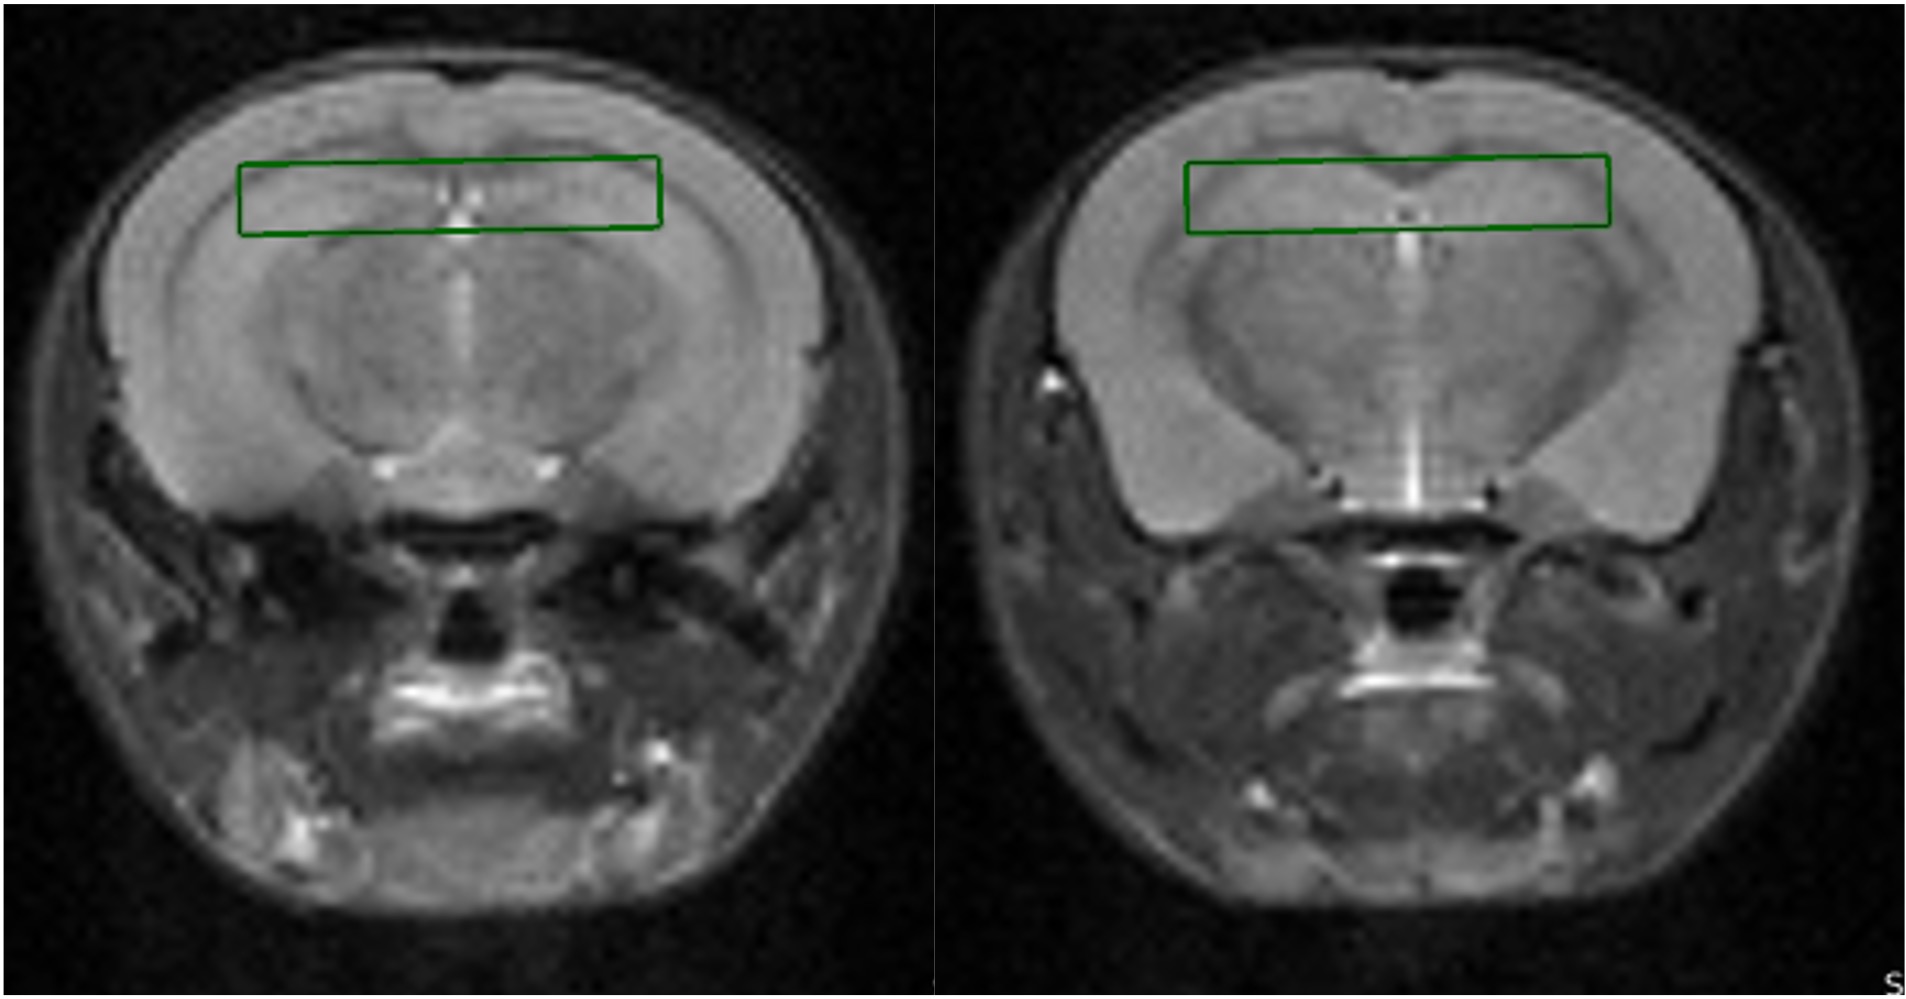
A total of 10 mice (n=5/5, wild-type/5xFAD; all female) were scanned between 6-8months old. All the mice were scanned for CEST and spectroscopy experiments on the slice covering hippocampus (located at -2.8 mm from lambda position) using the 20mm diameter volume-coil (RAPID Biomedical GmBH, Germany) at 9.4T 30 cm horizontal bore magnet interfaced to Bruker console after obtaining the approval from University of Pennsylvania IACUC committee. Imaging protocol consisted of a localizer followed by T1-FLASH, T2-MSME, GluCEST (B1rms=5.87µT; pulse-duration=1000ms (series of 200ms pulses); offsets= ±2.4 to ±3.6ppm; step-size=0.2ppm; averages=4; acquisition time = ~15 min), MICEST (B1rms=1.8µT; pulse-duration=2000ms (series of 200ms pulses); offsets= ±0 to ±1.5ppm; step-size=0.1ppm; averages=2; acquisition time = ~15 min), WASSR18 and single-voxel 1H MRS covering the hippocampus 6x1x2mm3 (TR=3000ms; TE=16ms; dummy-scans=4; acquisition time = ~13 min) as shown in Figure 1. Slice thickness was 1mm and in-plane resolution for all imaging and CEST protocols was 0.146mm x 0.146mm. Mice were anesthetized with isoflurane (1.5%) mixed in air (Air:O2 70%:30%). Body temperature of the mouse was monitored during the entire scan protocol using an anal temperature probe and maintained at 37ºC using a thermostat controlled forced hot air inside the bore of the magnet (SA Instruments Inc, New York, USA) along with the respiratory rate. Four regions of interest (ROI) consisting of left and right hippocampus and thalamus were drawn on the post-processed B0-corrected GluCEST and MICEST maps and the values are reported here. Statistical analyses were performed using a two-sample t-test assuming unequal variances. 1HMR spectra from hippocampus were analyzed with the LCModel19,20.RESULTS
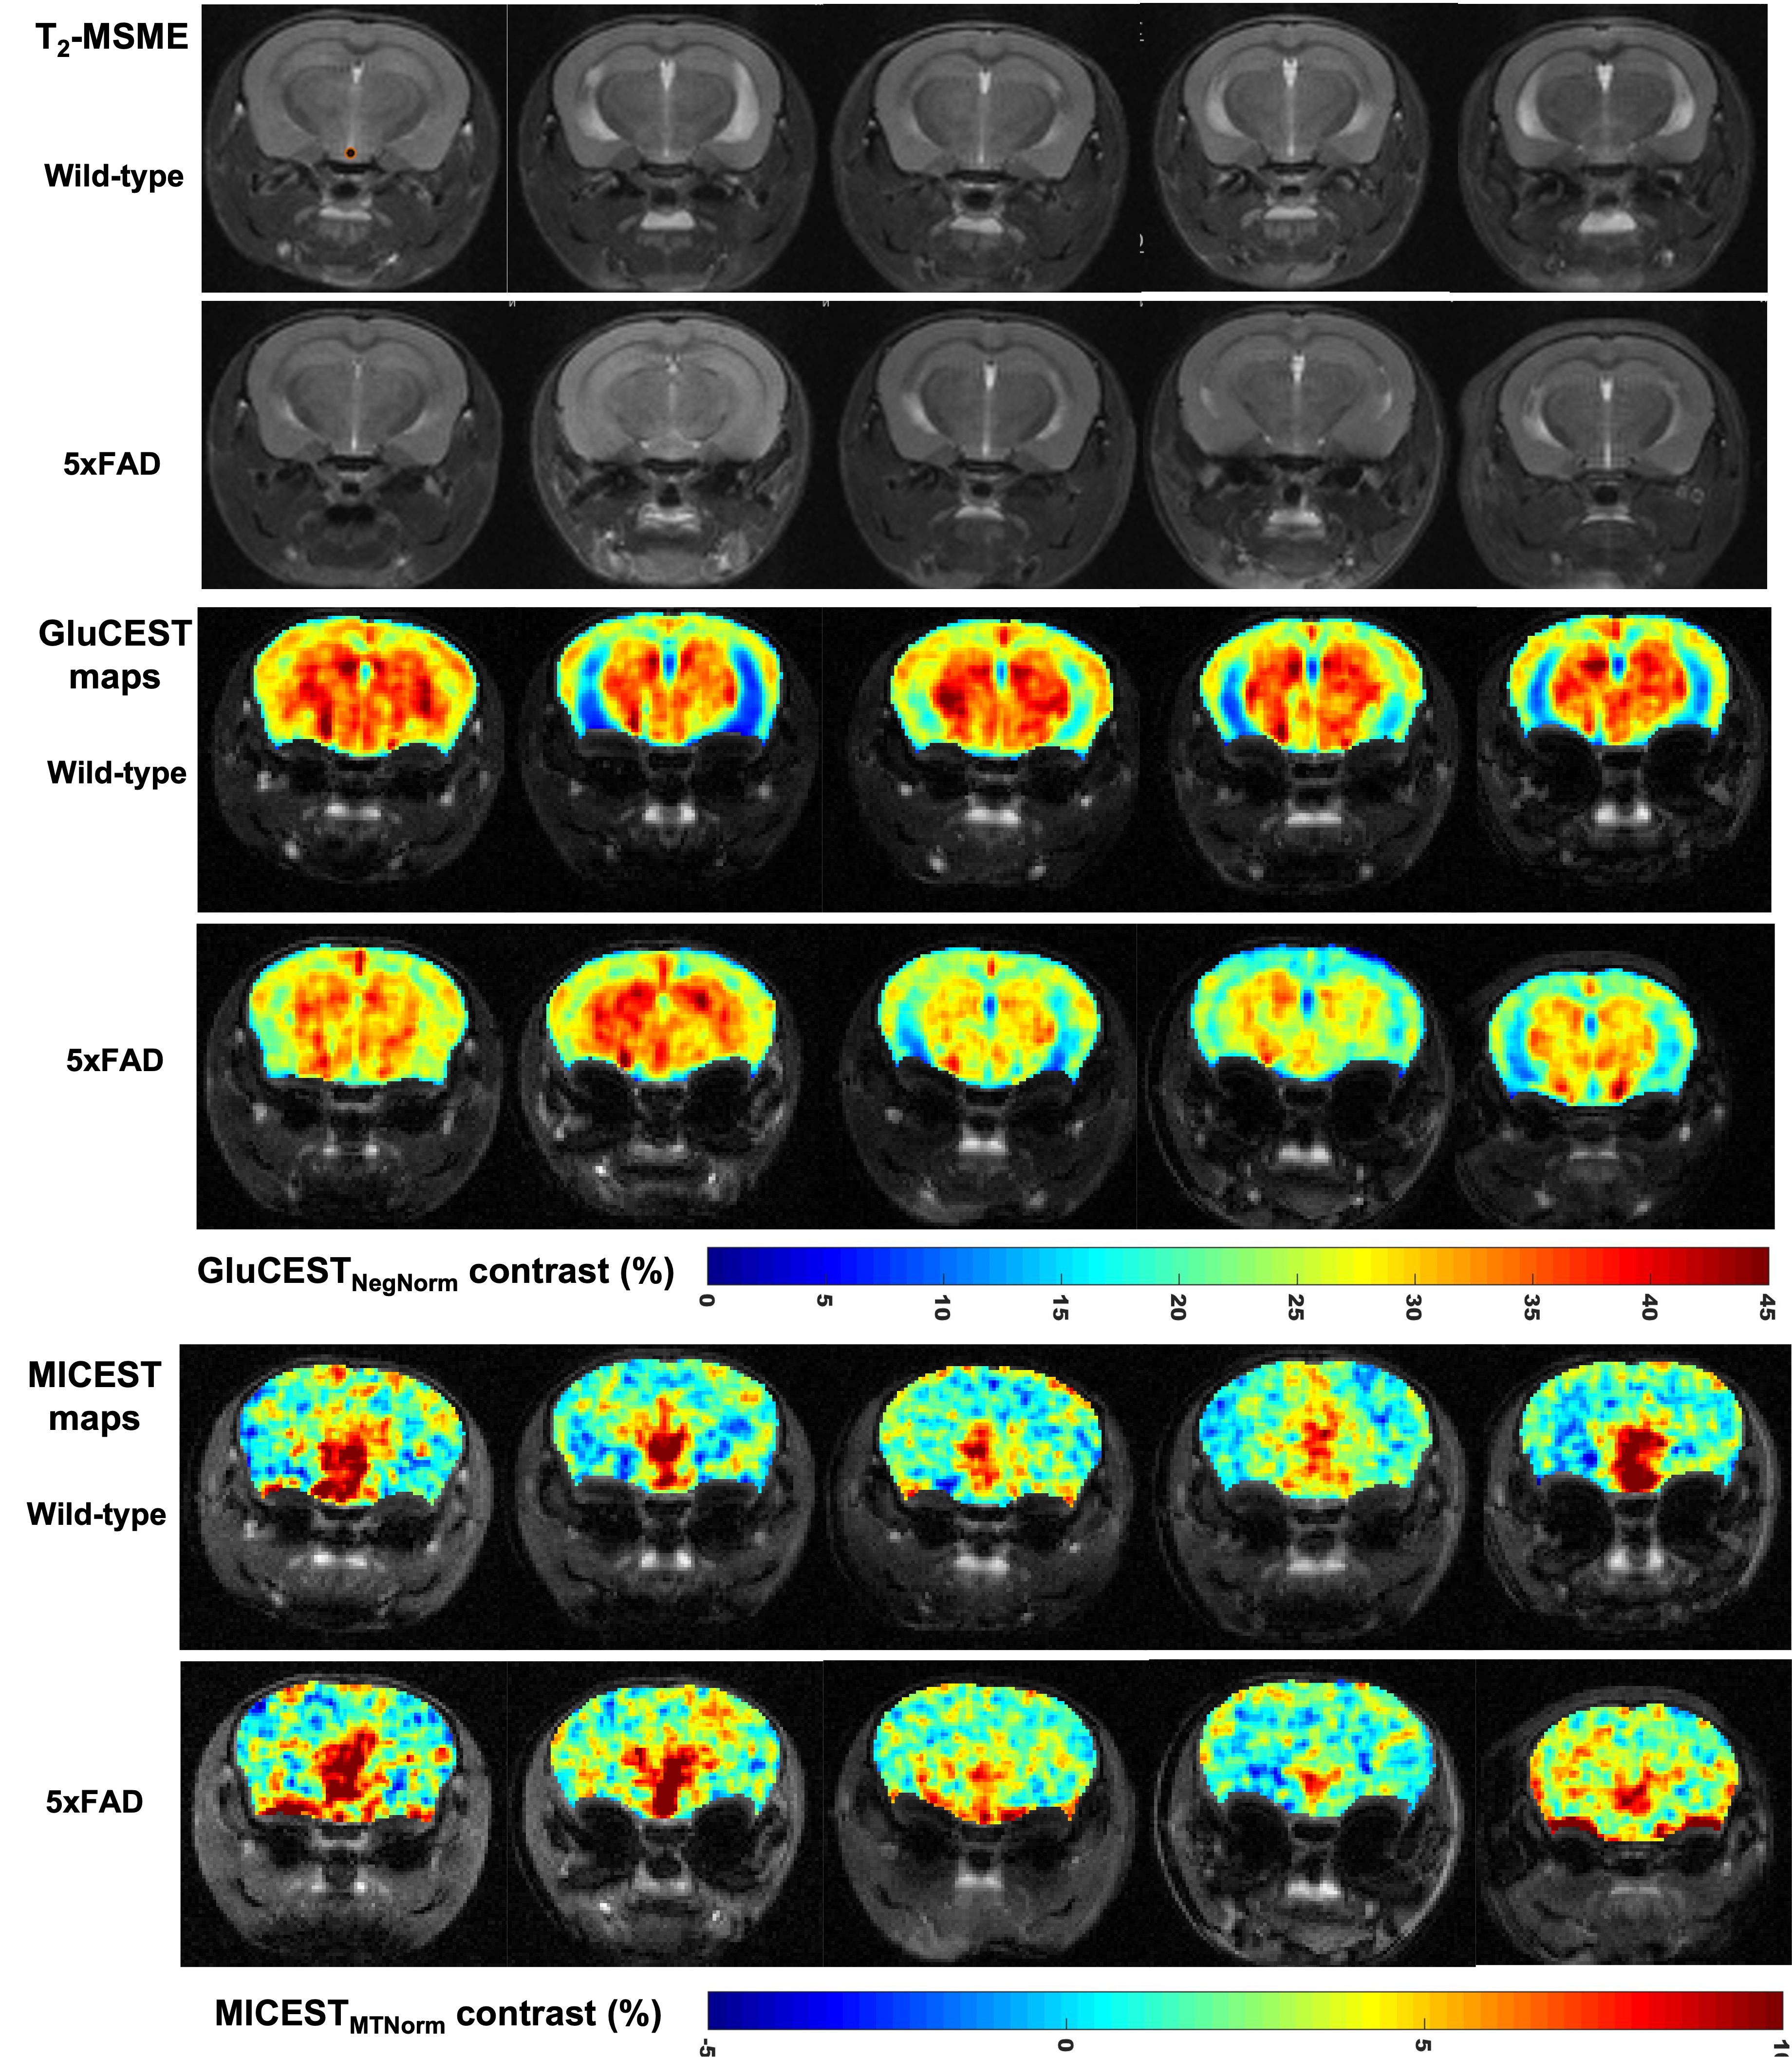
Representative anatomical T2-MSME (multi spin multi echo; TE=30ms images displayed) images are shown for all the five 5xFAD and wild-type mice along with their GluCEST and MICEST maps in Figure 2. Mean GluCEST values from left and right ROIs drawn on entire hippocampus of the slice for wild type and 5xFAD mice were 24.8±5.07% & 25.36±4.74% vs 26.66±3.01% & 26.28±3.42%, respectively and were not statistically significant. Mean GluCEST values from left and right thalamus from wild-type and 5xFAD mice were, 34.16±2.65% & 33.76±2.46% (p=0.06) vs 31.06±3.0% & 29.92±2.43% (p<0.05), respectively. Mean MICEST values for left and right ROIs drawn on thalamus for wild-type and 5xFAD mice were 3.96±1.35% & 4.18±1.18% vs 3.84±1.17% & 4.12±1.51%, respectively. Mean MICEST values for left and right ROIs drawn on hippocampus were marginally higher in 5xFAD mice when compared to wild-type mice which were 2.5±1.26% & 2.54±0.57% vs 1.98±1.34% & 2.12±1.4%, respectively but were not statistically significant. Glutamate and myo-Inositol concentrations obtained after LCModel processing of hippocampal 1HMRS data from all the wild-type and 5xFAD mice were, 14.97±1.66 IU vs 15.64±3.49 IU & 10.47±1.28 IU vs 12.13±1.84 IU, respectively.DISCUSSION
Mean GluCEST values of hippocampus reported in this study differ from a previously reported study while that for thalamus the results are the same21. This difference could be due to the result of the segmentation approach employed in the prior study where CSF has been removed from the region of interest drawn on hippocampus. In our study, since some of the hippocampal regions has CSF components due to enlarged ventricles in this mouse model, performing the sub-regional analysis of hippocampus consisting of DA, CA1, CA2, CA3 and CSF would give much cleaner values along with important information indicating the metabolic changes. Also, isolating cortical areas from other structures is important as we have seen a decrease in GluCEST and is another region of interest indicated in AD. Towards this goal we are trying to explore the software such as ITK-SNAP and k-means cluster algorithm to perform sub-regional analysis of hippocampus and other cortical structures which are ongoing.CONCLUSION
In this earlier-time point study, mean GluCEST values were marginally higher in hippocampus for 5xFAD mice when compared to the wild-type mice and the same was also supported by the spectroscopy results obtained from the hippocampus. However, the opposite trend was observed for thalamus with GluCEST being higher in wild-type mice when compared to 5xFAD mice. In case of MICEST while no difference was observed between both the groups in thalamus, MICEST was marginally higher in hippocampus of 5xFAD mice when compared to the wild-type mice. We plan to perform GluCEST and MICEST and 1HMRS imaging and immunohistochemical analyses of AD and WT mice brains at additional time points (9 through 14 months). This will shed light on the origins of the observed changes in the GluCEST and MICEST and their potential utility as biomarkers to track AD onset and progression.Acknowledgements
Research reported in this publication was supported by the National Institute of Biomedical Imaging and Bioengineering of the National Institutes of Health under award Number P41EB029460 and by the National Institute of Aging of the National Institute of Health under award Number R01AG063869.References
1. Fonnum F, Storm-Mathisen J, Divac I. Biochemical evidence for glutamate as neurotransmitter in corticostriatal and corticothalamic fibers in rat brain.Neuroscience. 1981;6(5):863-873.
2. Fonnum F. Glutamate: A neurotransmitter in mammalian brain. J Neurochem. 1984;42(1):1-11.
3. Headley PM, Grillner S. Excitatory amino acids and synaptic transmission: The evidence for a physiological function. Trends Pharmacol Sci.1990;11(5):205-211.
4. DeKosky ST, Scheff SW. Synapse loss in frontal cortex biopsies in Alzheimer’s disease: correlation with cognitive severity. Ann Neurol. 1990;27:457-464.
5. Terry RD, Masliah E, Salmon DP, et al. Physical basis of cognitive alterations in Alzheimer’s disease: synapse loss is the major correlate of cognitive impairment. Ann Neurol. 1991;30:572-580.
6. Carrillo-de Sauvage MA, Flament J, Bramoulle Y, et al. The neuroprotective agent CNTF decreases neuronal metabolites in the rat striatum: an in vivo multimodal magnetic resonance imaging study. J Cereb Blood Flow Metab. 2015;35(6):917-921.
7. von Bartheld CS, Bahney J, Herculano-Houzel S. The search for true numbers of neurons and glial cells in the human brain: A review of 150 years of cell counting. J Comp Neurol. 2016;524(18):3865-3895.
8. Sailasuta N, Harris K, Tran T, et al. Minimally invasive biomarker confirms glial activation present in Alzheimer's disease: a preliminary study. Neuropsychiatr Dis Treat. 2011;7:495-499.
9. de Longprez H, Cole SL, Logan S, et al. Intraneuronal beta-amyloid aggregates, neurodegeneration, and neuron loss in transgenic mice with five familial Alzheimer’s disease mutations: potential factors in amyloid plaque formation. J Neurosci. 2006;26(40):10129–10140.
10. Cai K, Haris M, Singh A, et al. Magnetic resonance imaging of glutamate. Nat Med. 2012;18(2):302-306.
11. Haris M, Nath K, Cai K, et al. Imaging of glutamate neurotransmitter alterations in Alzheimer’s disease. NMR Biomed. 2013;26(4):386–391.
12. Crescenzi R, DeBrosse C, Nanga RPR et al. In vivo measurement of glutamate loss is associated with synapse loss in a mouse model of tauopathy. Neuroimage. 2014;101:185–192.
13. Bagga P, Crescenzi R, Krishnamoorthy G, et al. Mapping the alterations in glutamate with GluCEST MRI in a mouse model of dopamine deficiency. J Neurochem. 2016;139(3):432–439.
14. Bagga P, Pickup S, Crescenzi R, et al. In vivo GluCEST MRI: reproducibility, background contribution and source of glutamate changes in the MPTP model of Parkinson’s disease. Sci Rep. 2018;8(1):2883.
15. J. Martinez, L. Francelle, M.-A. Carrillo-de Sauvage et al., “In vivo imaging of brain glutamate defects in a knock-in mouse model of Huntington’s disease,” Neuroimage, 2016;139:53–64.
16. Haris M, Cai K, Singh A, Hariharan H, Reddy R. In vivo mapping of brain myo-inositol. Neuroimage. 2011;54(3):2079-85.
17. Haris M, Singh A, Cai K, Nath K, Crescenzi R, Kogan F, et al. MICEST: A potential tool for non-invasive detection of molecular changes in Alzheimer's disease. J Neurosci Methods. 2013;212(1):87-93.
18. Kim M, Gillen J, Landman BA, et al. Water Saturation Shift Referencing (WASSR) for Chemical Exchange Saturation Transfer (CEST) Experiments. Mag Reson Med. 2009;61(6):1441-1450.
19. Provencher SW. Estimation of metabolite concentrations from localized in vivo proton NMR spectra. Magn Reson Med. 1993;30(6):672-679.
20. Provencher SW. Automatic quantitation of localized in vivo 1H spectra with LC Model. NMR Biomed. 2001;14(4):260-264.
21. Igarashi H, Ueki S, Kitaura H, et al. Longitudinal GluCEST MRI changes and cerebral blood flow in 5xFAD mice. Contrast Media Mol Imaging. 2020,2020:8831936.
Figures