1631
Filter-exchange spectroscopy and imaging sensitively detect necrotic cell death in vitro and in vivo1Department of Nuclear Medicine, TUM School of Medicine, Klinikum Rechts der Isar, Technical University of Munich, Munich, Germany, 2Institute of Pathology, TUM School of Medicine, Technical University of Munich, Munich, Germany, 3Institute of Radiology, TUM School of Medicine, Klinikum Rechts der Isar, Technical University of Munich, Munich, Germany
Synopsis
Filter-exchange spectroscopy (FEXSY) and imaging (FEXI) are sensitive to transmembrane water exchange, which is commonly altered during cell death1. Yeast cells in different permeabilization stages were studied with FEXI, DWI and CFDA-AM/ propidium iodide (PI) staining using flow cytometry. Cell populations with 3.8% PI positive staining had 44% increased AXR, but unchanged ADC. At 33% nonvital cells, detection of AXR became unreliable and ADC increased. In vivo FEXI and DWI in EL4 lymphoma, with H&E-confirmed necrotic tumor cells and edema, showed AXR and ADC variations across the tumor, possibly due to differing vitality cell stages.
Purpose
Plasma membrane integrity is critical for cell survival1. Using diffusion filter and encoding gradients, the signal of filter-exchange spectroscopy (FEXSY) and imaging (FEXI) (figure 1) is sensitive to water transmembrane permeability, which can be quantified with the apparent exchange rate (AXR)2-5. The aims of this work are to measure AXR in vitro and in vivo, to detect membrane degradation during necrotic cell death, and to compare to established markers of cell death.Methods
SubjectsIn vitro
Baker’s yeast cells (5g) were mixed with isopropanol permeabilization solutions (20%, 25%, 30%) for 30min at 16°C6 and washed directly before measurement at 16 ± 1.0°C.
In vivo
C57BL/6 mice (n= 4) were injected with 1∙105 EL4 lymphoma tumour cells (ATCC) in the lower back.
MR measurement
MRI scanner: 7T small animal (Bruker/Agilent/GE)
In vitro
- 1H solenoid coil (Rapid Biomedical)
- FEXSY (figure 1a) parameters: diffusion filter b-value (bf) of 2043s/mm2, diffusion encoding at 8 b-values (b) from 59 to 911s/mm2, 7 mixing times (tm) of 24-300ms, 1 repetition, acquisition time 8min
- DW-MRS parameters: 8 b-values (b) of 59 to 911s/mm2, 1 repetition
- 31mm birdcage resonator (Rapid Biomedical)
- FEXI (figure 1b) parameters: diffusion filter b-value (bf) of 1288s/mm2, diffusion encoding b-values (b) of 54 and 604s/mm2, 4 mixing times (tm) of 13-303ms, 16 (filter off) and 32 (filter on) repetitions, acquisition time 17min
- DWI parameters: diffusion encoding b-values (b) of 54 and 604s/mm2, 16 repetitions
MR data analysis
FEXSY and FEXI signals were fit with equations 1-32-5.
Eq. 1: S(b,tm)=Sf (tm ) exp(-b∙ADC’(tm))
Eq. 2: ADC’(tm)=ADC[1-σ∙exp(-AXR∙tm)]
Eq. 3: σ=1-[ADC’(0)/ADC],
where Sf (tm) is the signal intensity before the application of the detection module and ADC’(tm) the filtered ADC for each mixing time.
DW-MRS and DWI signals were fit with equation 42-4.
Eq. 4: S (b)=S0 exp(-b∙ADC)
In vitro
- Water spectral peak intensities were fit.
- For each voxel, for each tm and filter (bf) combination, data were fit twice: first including all repetitions and then again excluding outliers.
- ROIs were drawn on T2w images.
In vitro
Baker’s yeast cell membrane integrity was validated with flow cytometry after staining with CFDA-AM and propidium iodide (PI)7.
In vivo
Tumor cellularity was validated with histological analysis after hematoxylin and eosin (H&E) staining.
Results and Discussion
In vitroAfter treatment of cell suspensions with (figure 2, 3):
20% isopropanol: AXR increased by 44% but ADC and filter efficiency were unchanged. 3.8% of cells had compromised membranes (vital and nonvital) and the rest were vital cells with intact membranes according to CFDA-AM/PI staining.
25% isopropanol: AXR increased by 96%, but its precision was reduced. ADC slightly but not significantly increased and the filter efficiency decreased by 73%. 92% of cells were vital with compromised membranes and 4% were nonvital cells with compromised membranes.
30% isopropanol: AXR detection became unreliable, ADC increased by 33% and the filter efficiency reduced by 95%. 65% of cells were vital with compromised membranes and 33% were nonvital cells with compromised membranes.
Up to 25% isopropanol, cells remain viable (intact and compromised membrane) and AXR increases with isopropanol (figure 2a, 3b). For 30%, the fraction of vital cells is greatly reduced, ADC increases whereas filter efficiency is low (figure 2b, 2c, 3b). This indicates that FEXSY is sensitive to early cell membrane damage, whereas DW-MRS is sensitive to later membrane breakdown, when membrane diffusion restriction is reduced.
In vivo
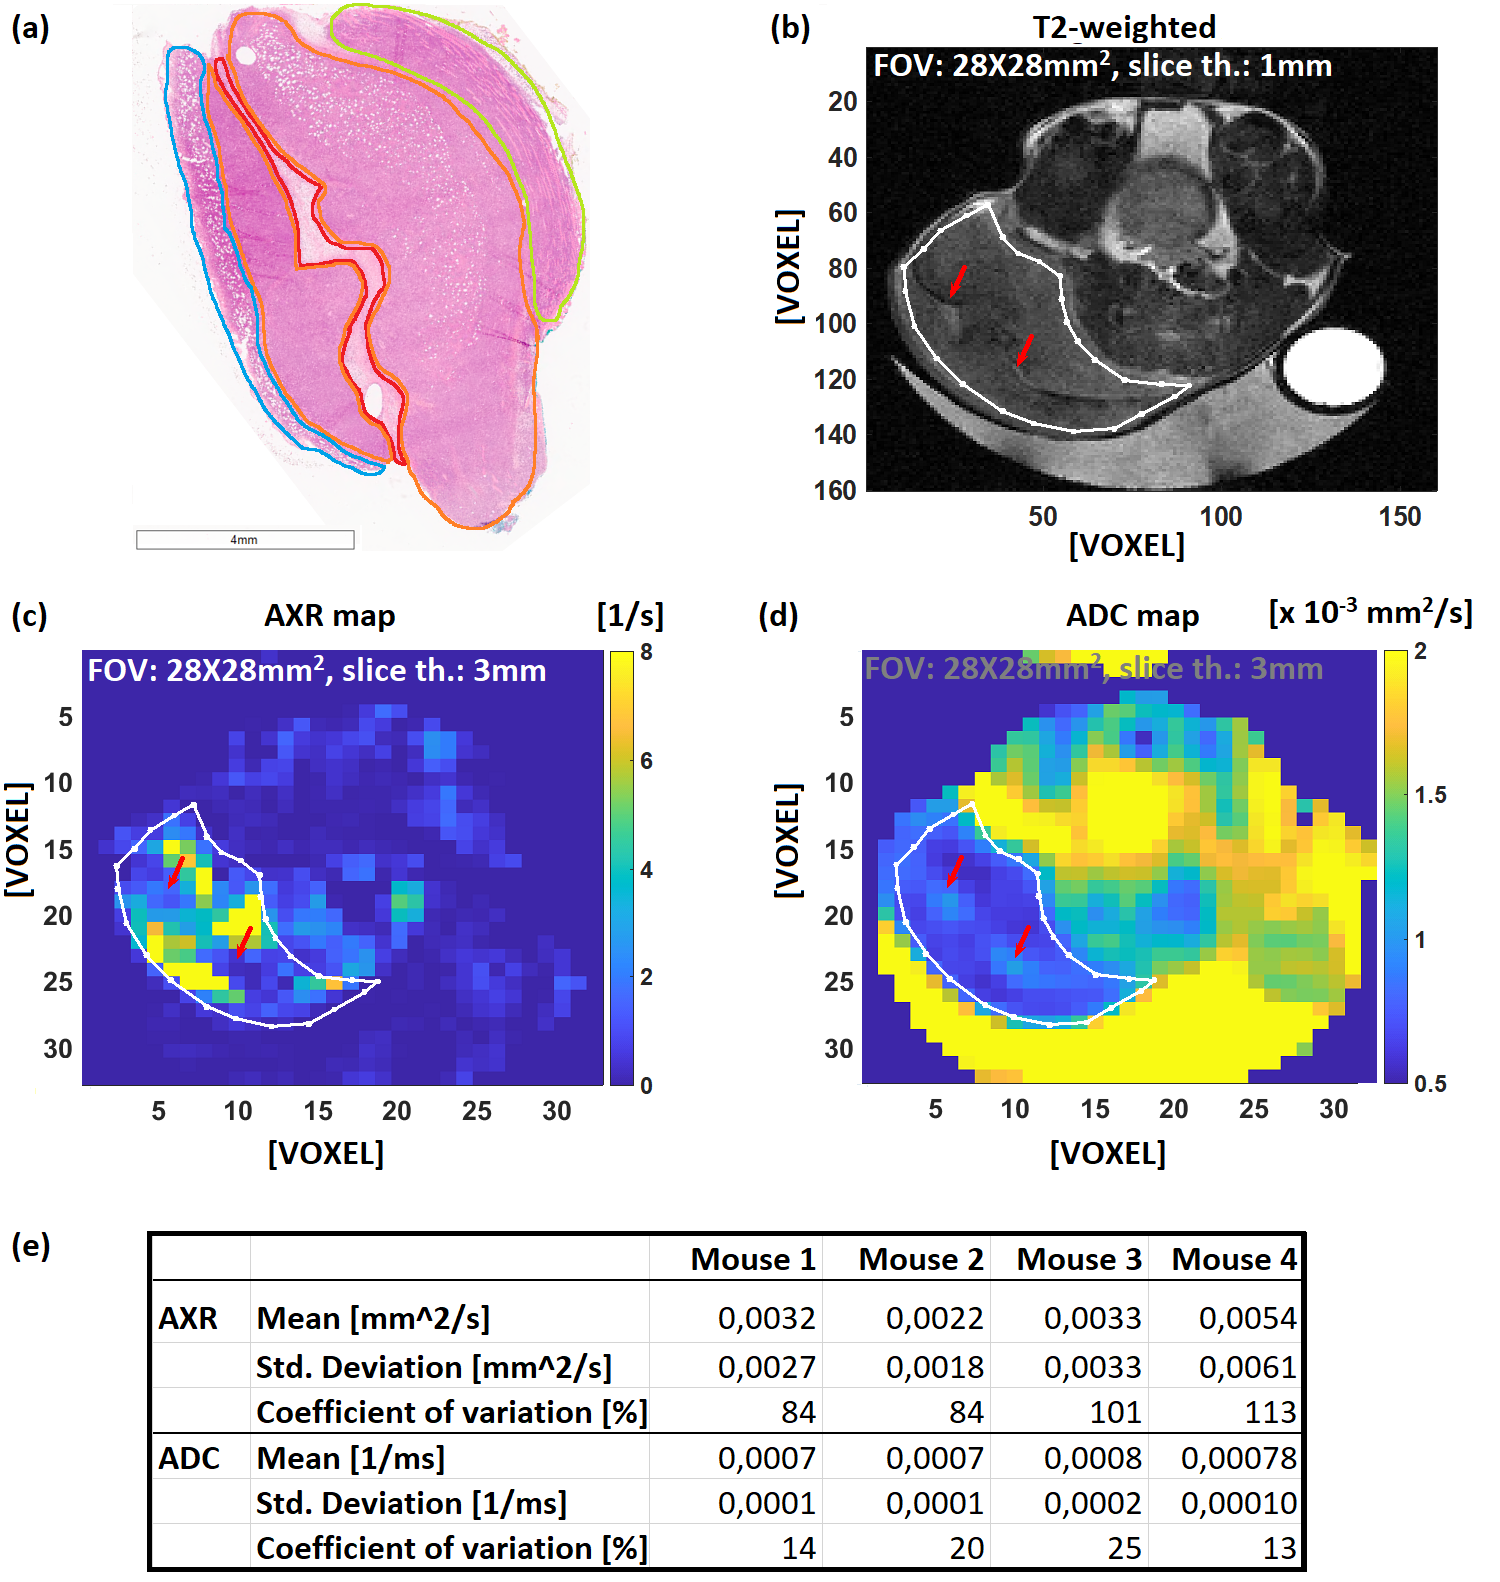
Figure 4 shows histological and T2w images and AXR and ADC maps of a mouse subcutaneous EL4 lymphoma.
Two areas of solid growing EL4 lymphoma (figure 4a, orange outlines) were distinguished from background by their hyperintense contrast in T2w images and low ADC (figure 4b, d). The H&E staining shows diffusely distributed necrotic tumor cells, partly as confluent areas of necrosis. Precise co-localization of these histological and MR images was impossible. However, cells in various necrotic stages are seen in histological images, which is likely similar to the content of the MR imaged slice, which would likely contribute to the observed variety of AXR values. The uniform ADCs in comparison to AXRs (figure 4e) are explained by cell membrane permeability variations that are undetectable with ADC.
Low AXRs but high ADCs are observed in an elongated region of edema and hemorrhage (figure 4a, red outline and figure 4c, d red arrows) through the centre of the tumour. In this region, the H&E staining shows low cellularity and a mixture of single viable and necrotic tumor cells.
Conclusion
Upon permeabilization, which was confirmed by double staining flow cytometry, the AXR of yeast cells increased while ADC showed no change. At later stage, following membrane breakdown, AXR detection became unreliable when changes in ADC were observed. Therefore, the combination of ADC with AXR measurement is sensitive to a broader range of microstructural changes during cell death. In EL4 lymphoma with diffusely distributed necrotic tumor cells, partly as confluent areas of necrosis, a spectrum of AXR values was observed. During therapeutic strategies that change membrane permeability progressively, FEXI can potentially be used as a treatment monitoring tool.Acknowledgements
We thank Martin Grashei and Sandra Sühnel for their technical assistance. The present work was supported by the Deutsche Forschungsgemeinschaft (DFG, German Research Foundation – 391523415, SFB 824).
References
1. Galluzzi L, Vitale I, Aaronson SA, et al. Molecular mechanisms of cell death: recommendations of the Nomenclature Committee on Cell Death 2018. Cell Death Differ. 2018;25(3):486–541.
2. Nilsson M, Lätt J, Westen D, et al. Noninvasive mapping of water diffusional exchange in the human brain using filter-exchange imaging. Magn Reson Med. 2013; 69(6): 1573–1581.
3. Lasič S, Nilsson M, Lätt J, et al. Apparent exchange rate mapping with diffusion MRI. Magn Reson Med. 2011; 66(2):356-65.
4. Aslund I, Nowacka A, Nilsson M, et al. Filter-exchange PGSE NMR determination of cell membrane permeability. Magn Reson Med. 2009; 200(2):291-5.
5. Schilling F, Ros S, et al., 2017, MRI measurements of reporter-mediated increases in transmembrane water exchange enable detection of a gene reporter, Nat Biotechnol., 35(1):75-80
6. Trawczyńska I, Miłek J, Sylwia JK. Effect of temperature, concentration of alcohols and time on baker's yeast permeabilization process. Technical Sciences. 2018; 21(3), 195–206.
7. Molecular Probes FungaLight™ CFDA, AM/Propidium Iodide Yeast Vitality Kit.
Figures

Figure 1: FEXSY (a) and FEXI (b) pulse sequences. Three modules are used for the signal preparation: 1. Diffusion filter module, which dephases the fast diffusing component (extracellular water). 2. Exchange module during which exchange between intra- and extracellular compartments occurs while the magnetization is stored along the longitudinal axis and a spoiler gradient is applied to dephase the transverse magnetization excited by the second 90°-pulse. 3. Detection module.
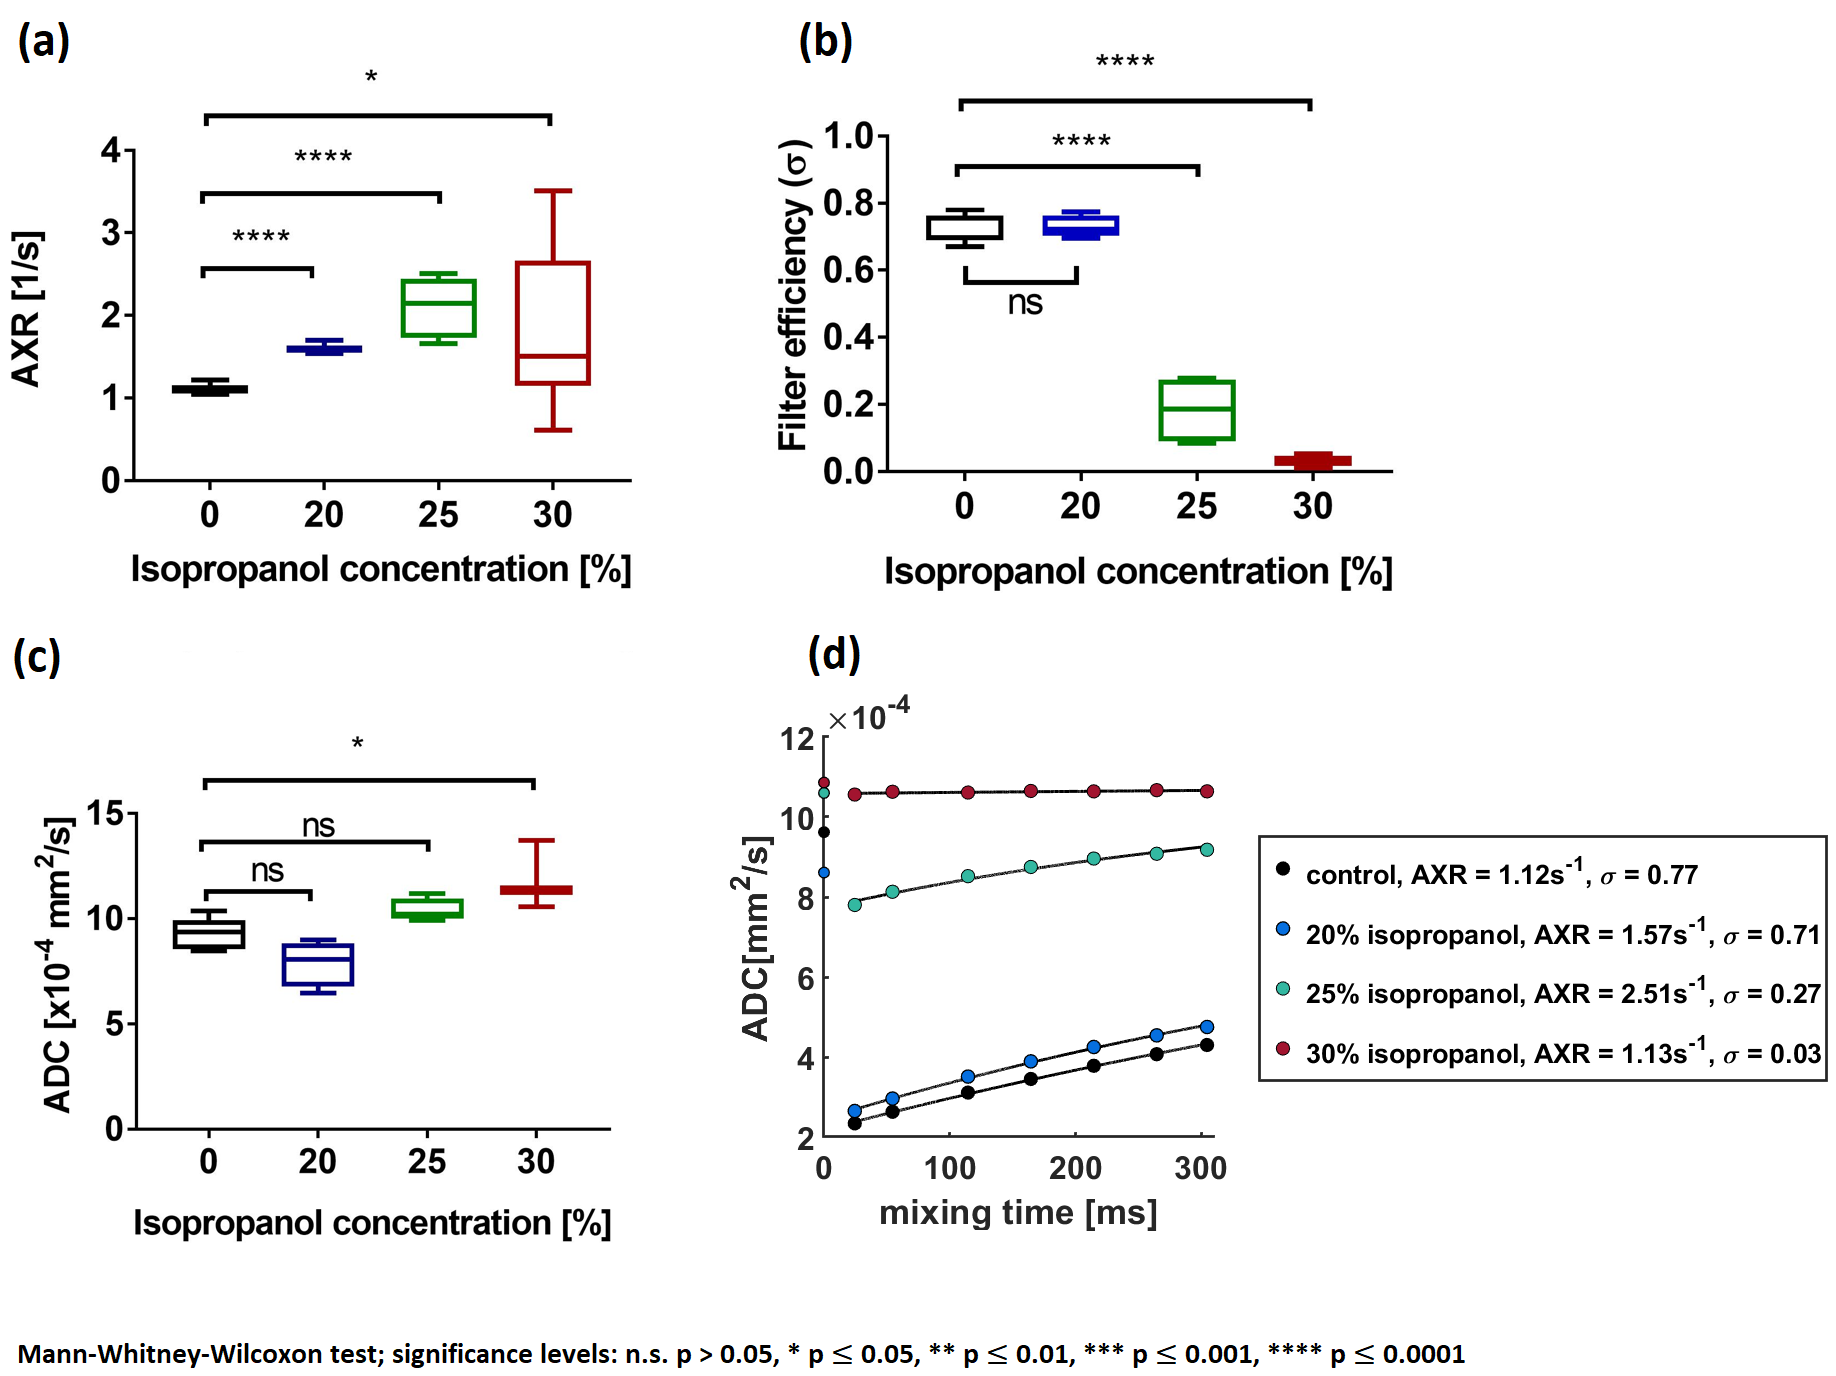
Figure 2: FEXSY and DW-MRS measurements of yeast cell suspensions treated with various isopropanol concentrations. (a) AXR and (b) filter efficiency (σ) values calculated from the FEXSY signal. (c) ADC values calculated from the DW-MRS signal. (d) AXR relaxation curves with AXR fit of yeast cell suspensions. ADCs for tm=0 measured without the diffusion filter application.
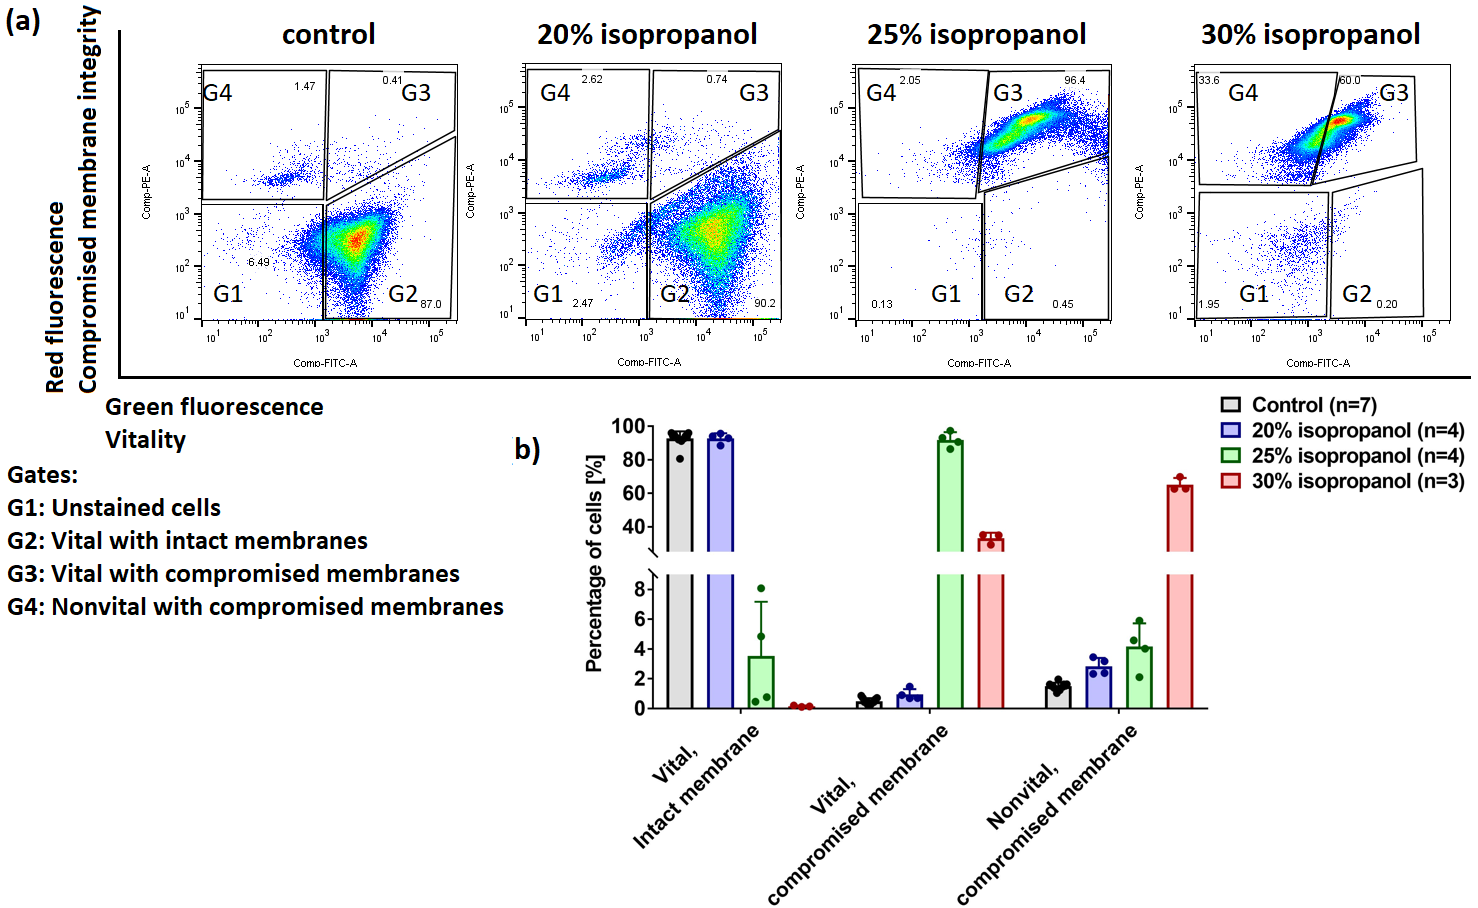
Figure 3: Analysis of isopropanol treated yeast cells by flow cytometry. (a) Representative dual-color fluorescence scatter plots from flow cytometry. (b) Bar plot of the percentage of vital/intact membrane, vital/compromised membrane and nonvital/compromised membrane cells of the different yeast suspensions.