1629
Deployment of prospective ADC correction of gradient nonlinearity bias in myelofibrosis clinical trial1Radiology, University of Michigan, Ann Arbor, MI, United States, 2Philips Healthcare, Highland Heights, OH, United States, 3Philips MR Sclinical Science, Best, Netherlands, 4Internal Medicine, University of Michigan, Ann Arbor, MI, United States
Synopsis
Apparent diffusion coefficient (ADC) metric is evaluated as a potential alternative to biopsy for disease grading and therapy response assessment in bone marrow of myelofibrosis (MF) patients. Spatially dependent bias in diffusion weighting due to systematic gradient nonlinearity (GNL) results in false heterogeneity of ADC maps over the imaged bone space. Here we illustrate deployment of prospective GNL bias correction based on technology developed in an academic industrial partnership to reduce technical variability of ADC in a MF clinical imaging trial.
Introduction
An ongoing single-site clinical trial is evaluating quantitative MRI for longitudinal monitoring of myelofibrosis (MF)1 progression and treatment efficacy, as a non-invasive alternative to serial bone marrow (BM) biopsies that are painful and prone to sampling errors. Large FOVs required to scan the lumbar spine and pelvis lead to substantial non-uniformity of diffusion weighting (DW) b-values induced by gradient nonlinearity (GNL). Improved ADC accuracy after retrospective correction for system-specific GNL bias2,3 was demonstrated for off-center anatomy in previous studies4,5. With the goal to enhance cross-platform reproducibility and accuracy of ADC measures, this work illustrates implementation of prospective GNL correction (GNC) in a clinical trial setting.Methods
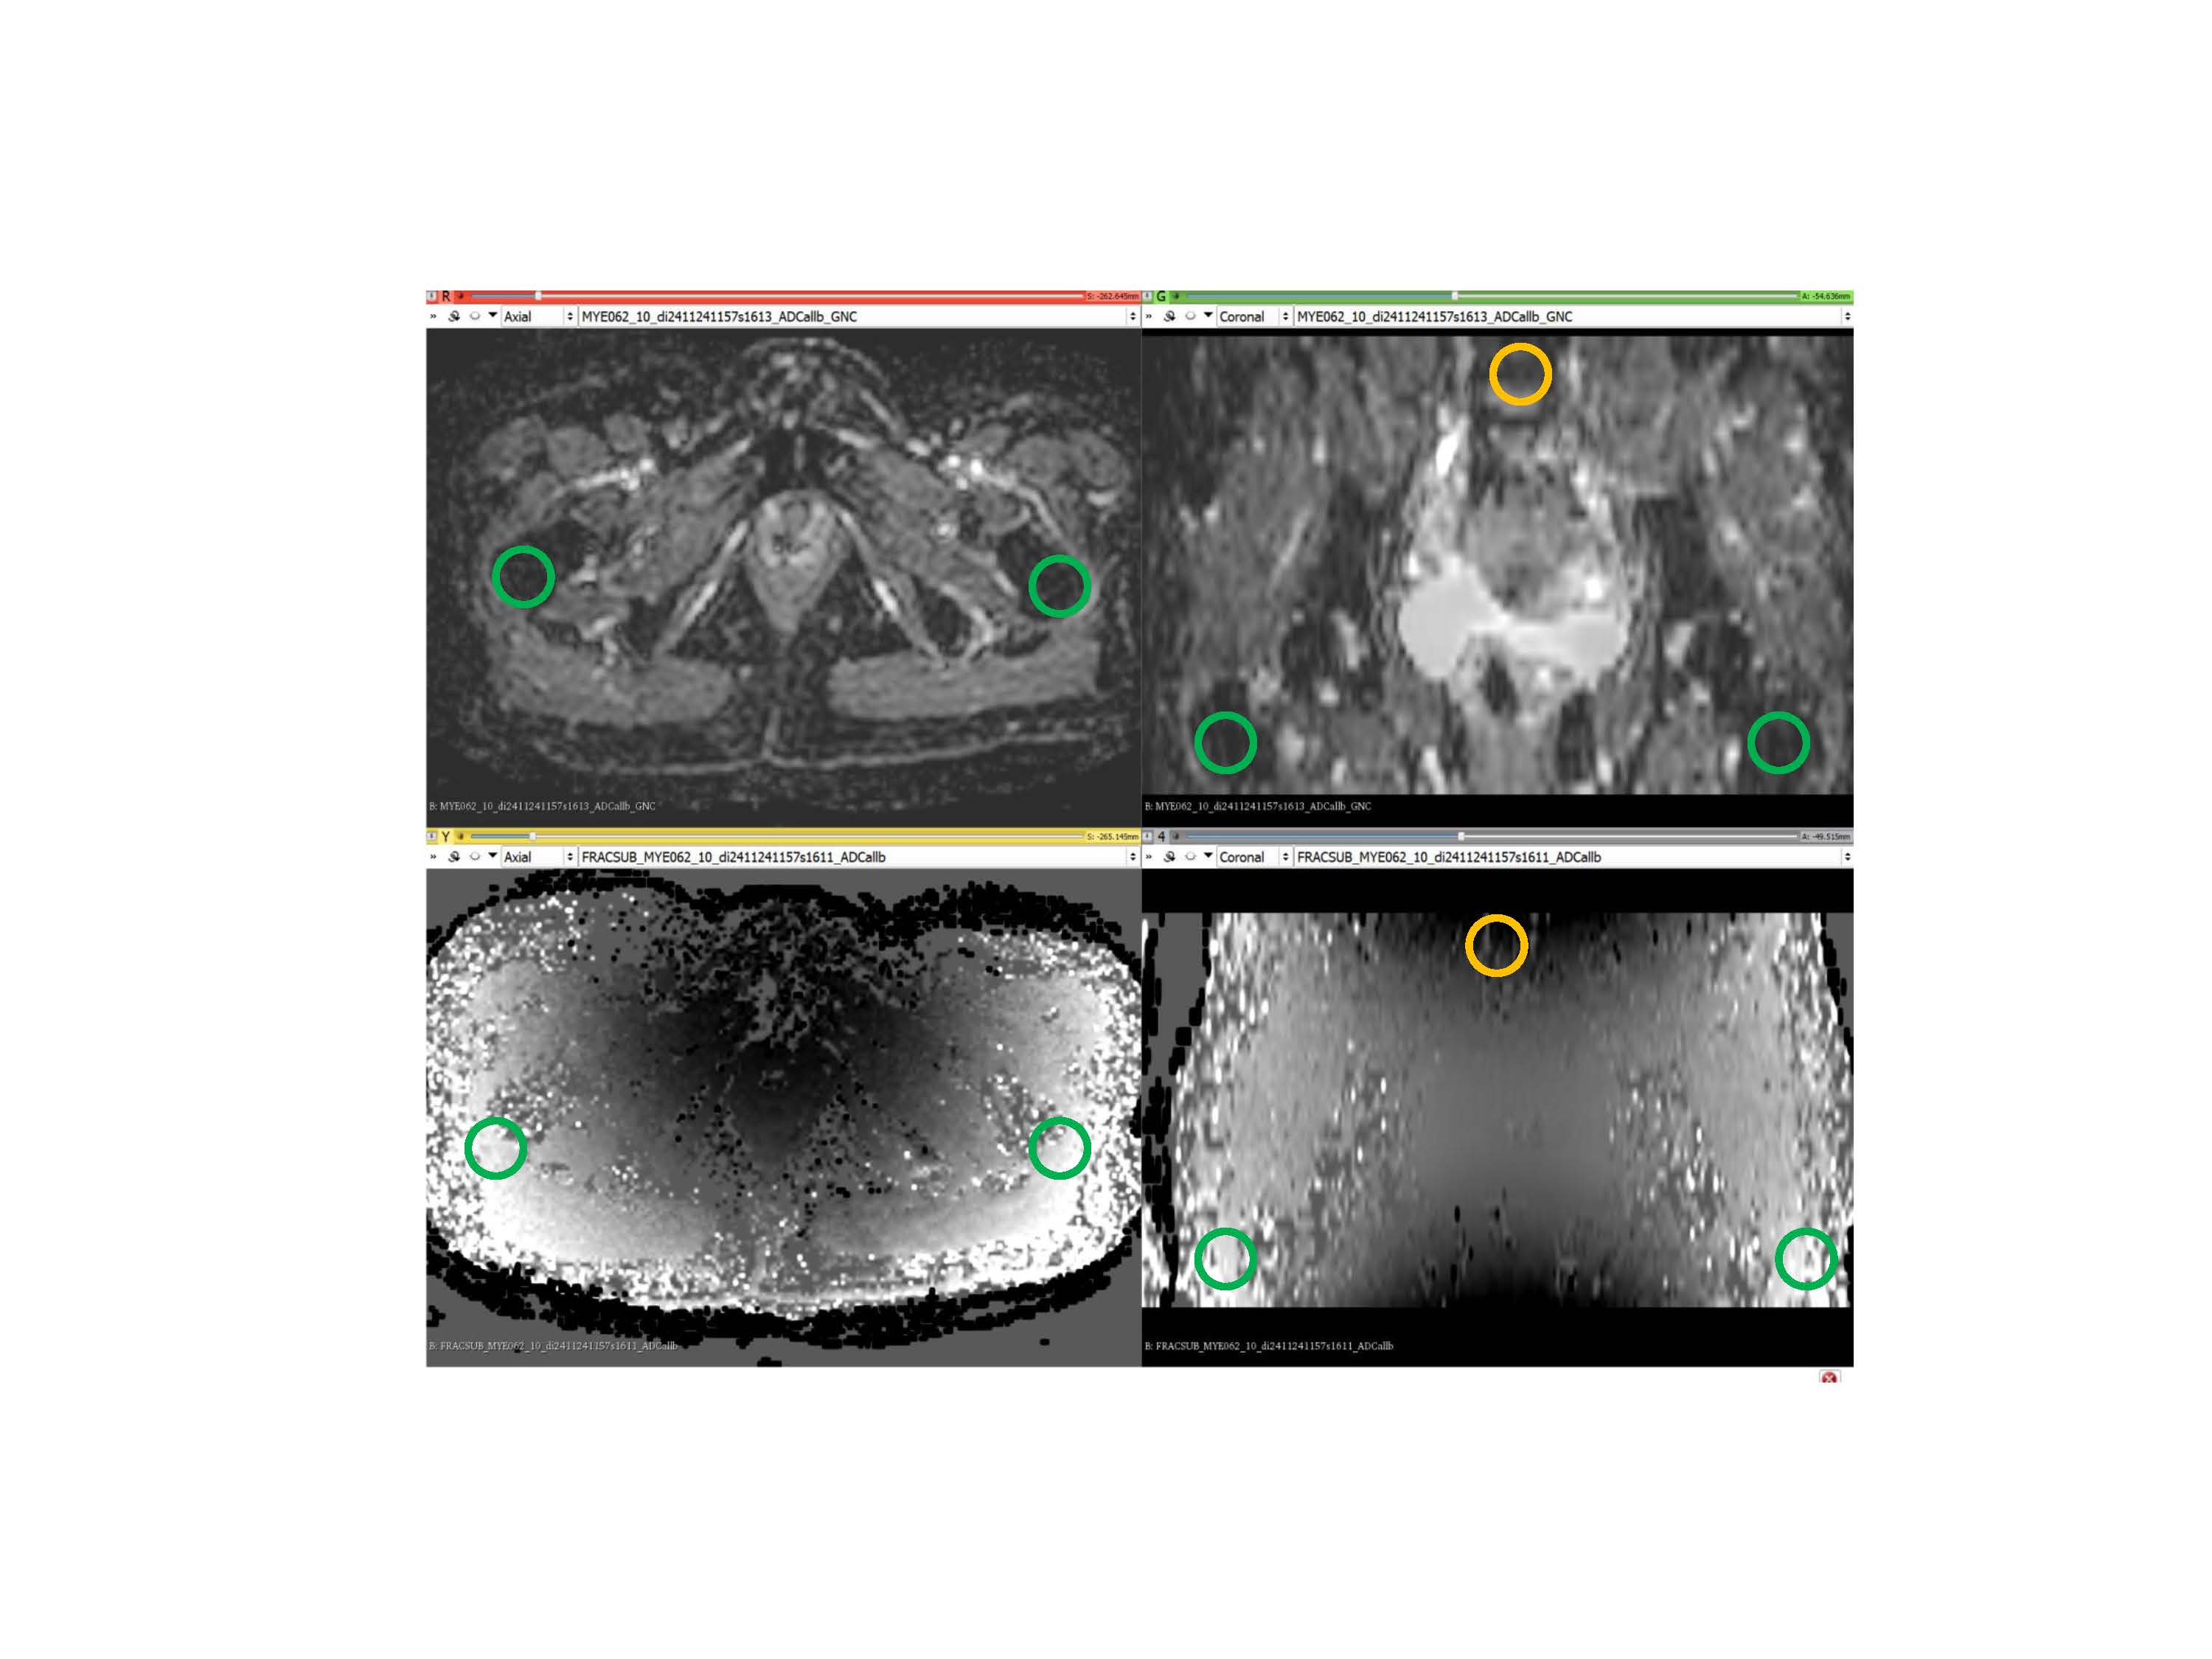
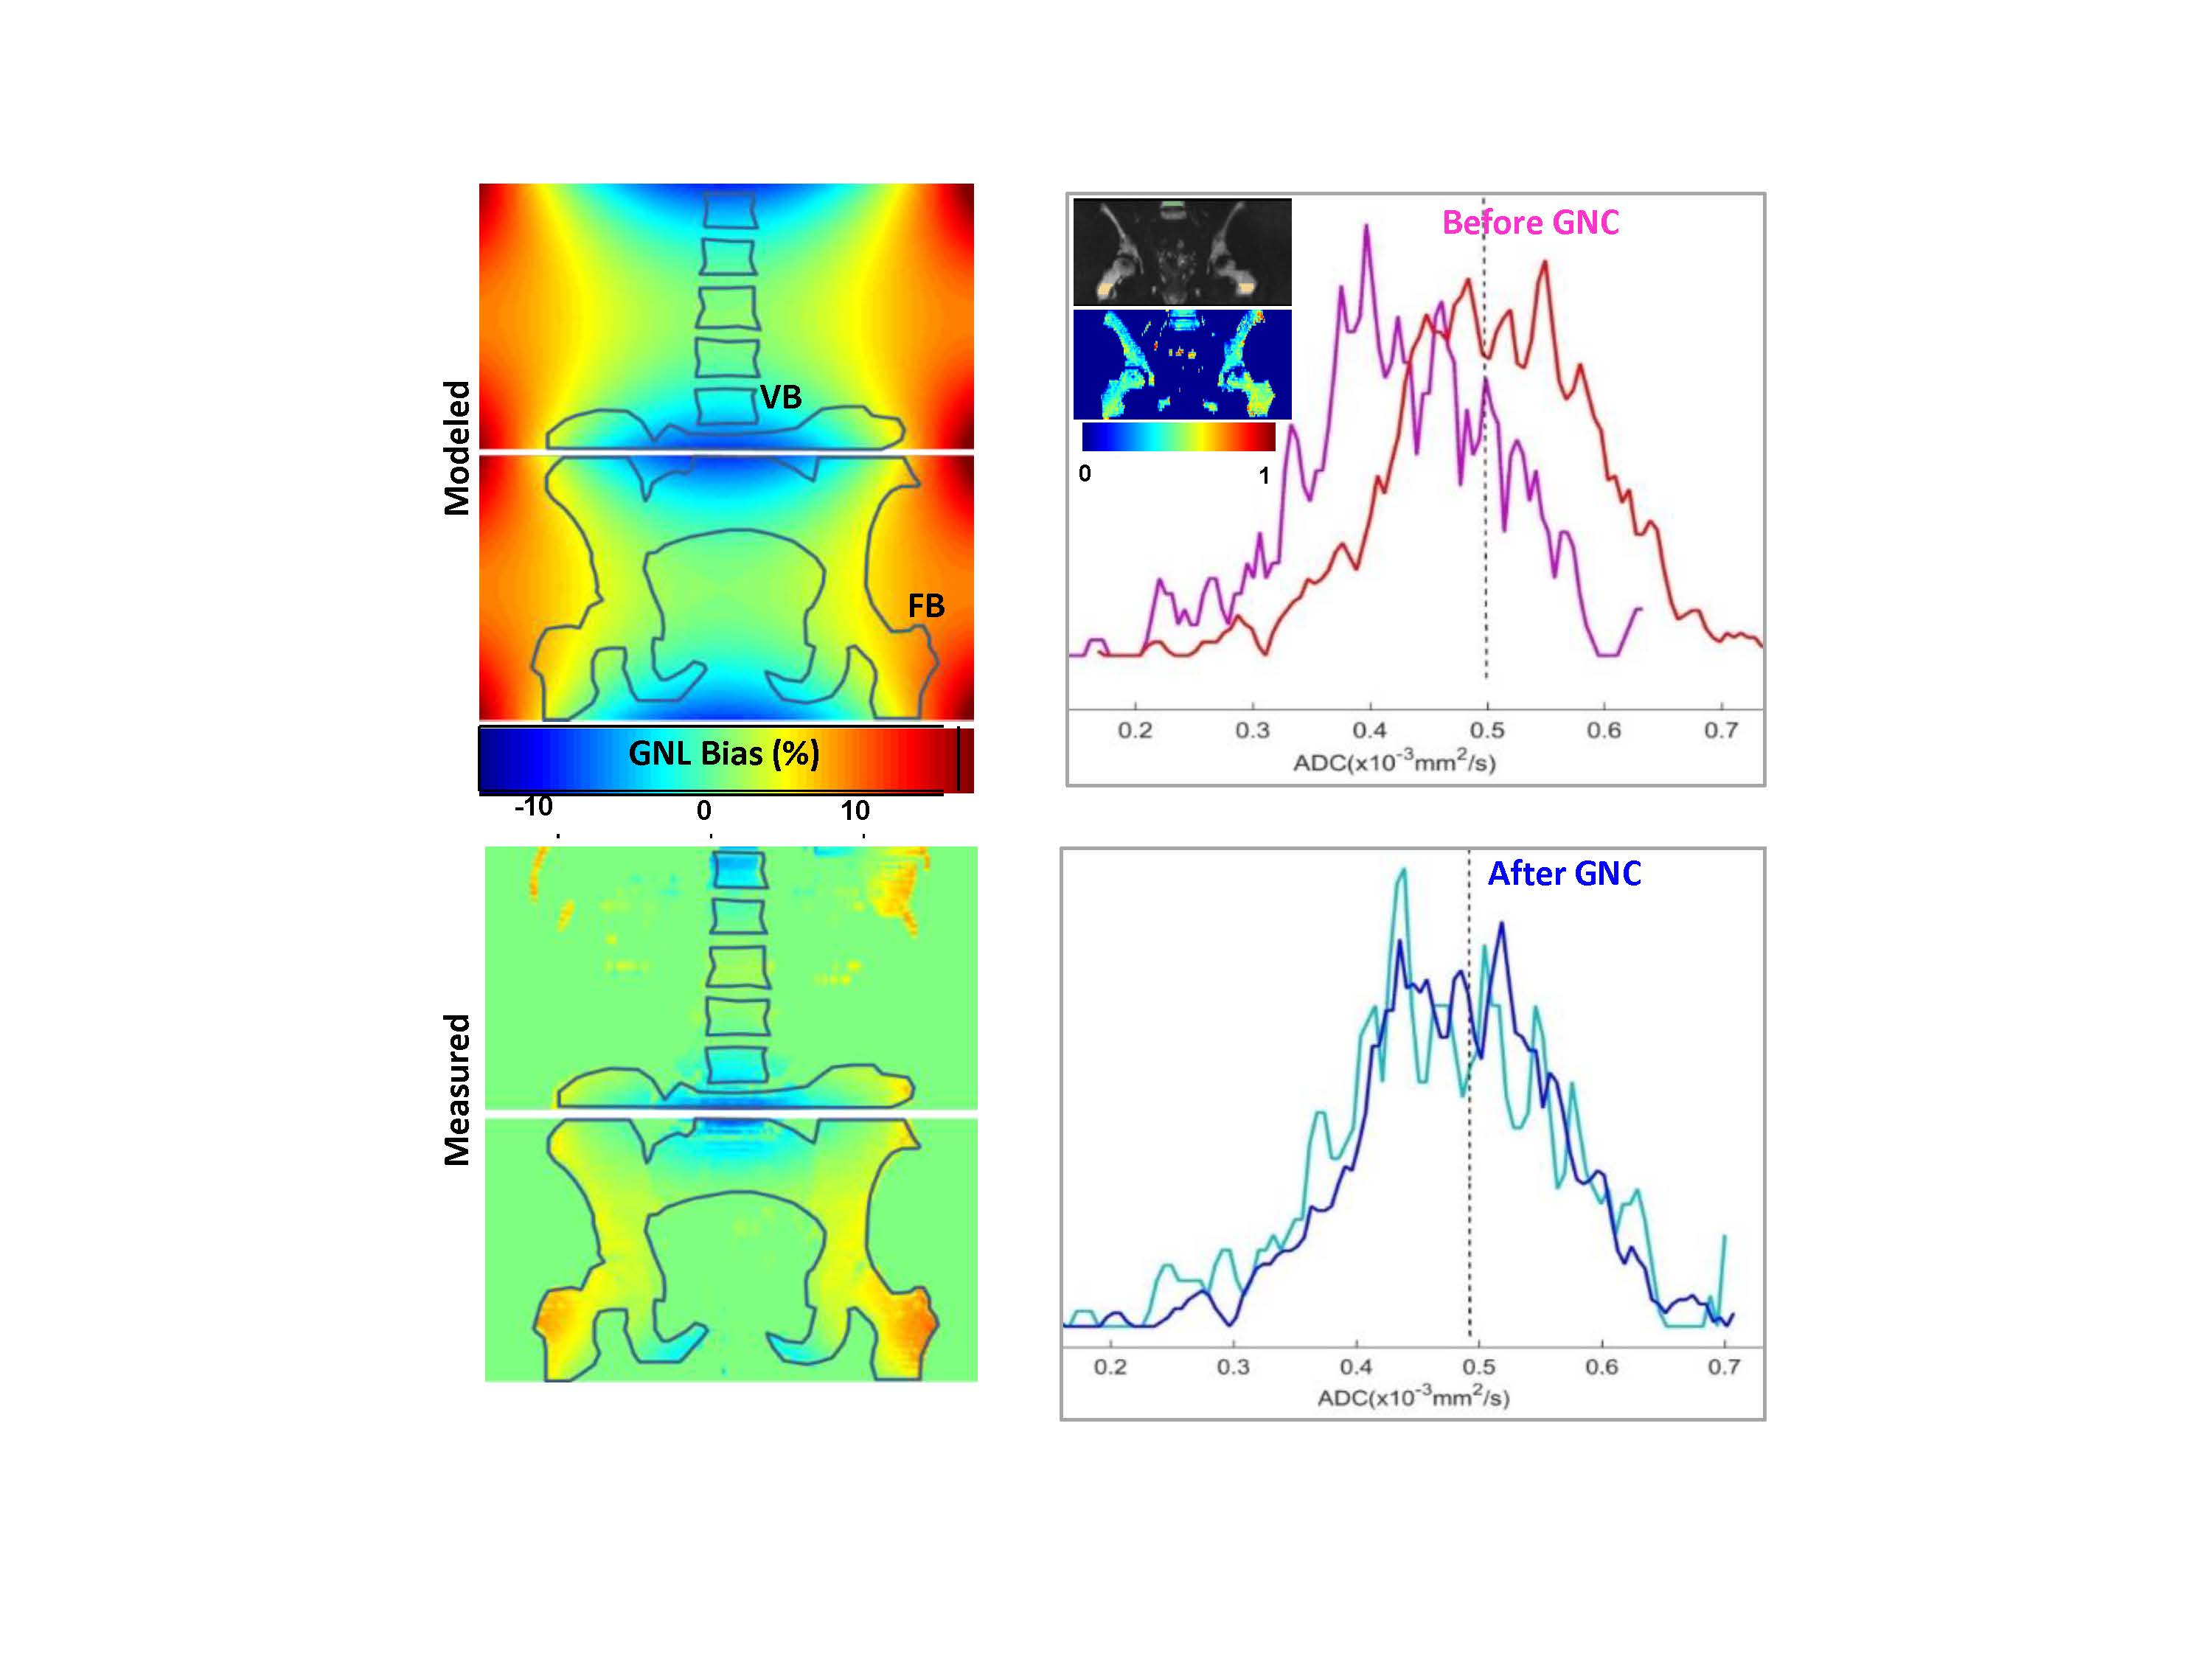
MF subject DWI: For the NCT01973881 trial1, trace-DWI images were acquired for IRB-consented study subjects on a single 3T MRI scanner over large FOV of 45x45cm2 in two stations (lower spine and pelvis) with 12-23cm table offsets. DWI was performed for 5mm-thick axial sections using standardized SS EPI sequences with b = 0, 800 s/mm2, TR=7.2s, TE=81ms and in plane resolution of 3x3mm2. For this study, a subset of 9 subjects was scanned with delayed reconstruction of ADC with and without prospective GNL correction (GNC) implemented on the scanner according to previously developed method3. The default image noise filter was disabled prior to GNC reconstruction.ADC GNC analysis: ADC maps were calculated for individual voxels using a mono-exponential diffusion model. Fractional ADC bias maps were generated by subtraction before and after GNC: (ADC- ADCGNC)/ADCGNC, and compared to system GNL pattern (b-map output) to ensure proper correction implementation. The maximum corrected bias was estimated between the lower spine vertebral body (VB) and femoral-trochanter bone (FB) locations on the coronal reformats of the ADC maps (Figure 1). Bone marrow regions-of-interest (ROIs) were manually defined in right FB on b=800s/mm2 images using 3D Slicer. The ROI histogram analysis was performed for ADC>0.1μm2/ms to exclude voxels with limited contrast-to-noise. The average corrected ADC bias across subjects was evaluated for mean ADC of right FB ROI. Coefficient of variance (CV) was calculated as a ratio of standard deviation to mean ADC ROI values. The relations between measurements were assessed using Pearson correlation, R, with statistical significance set to P-value<0.05.
Results and Discussion
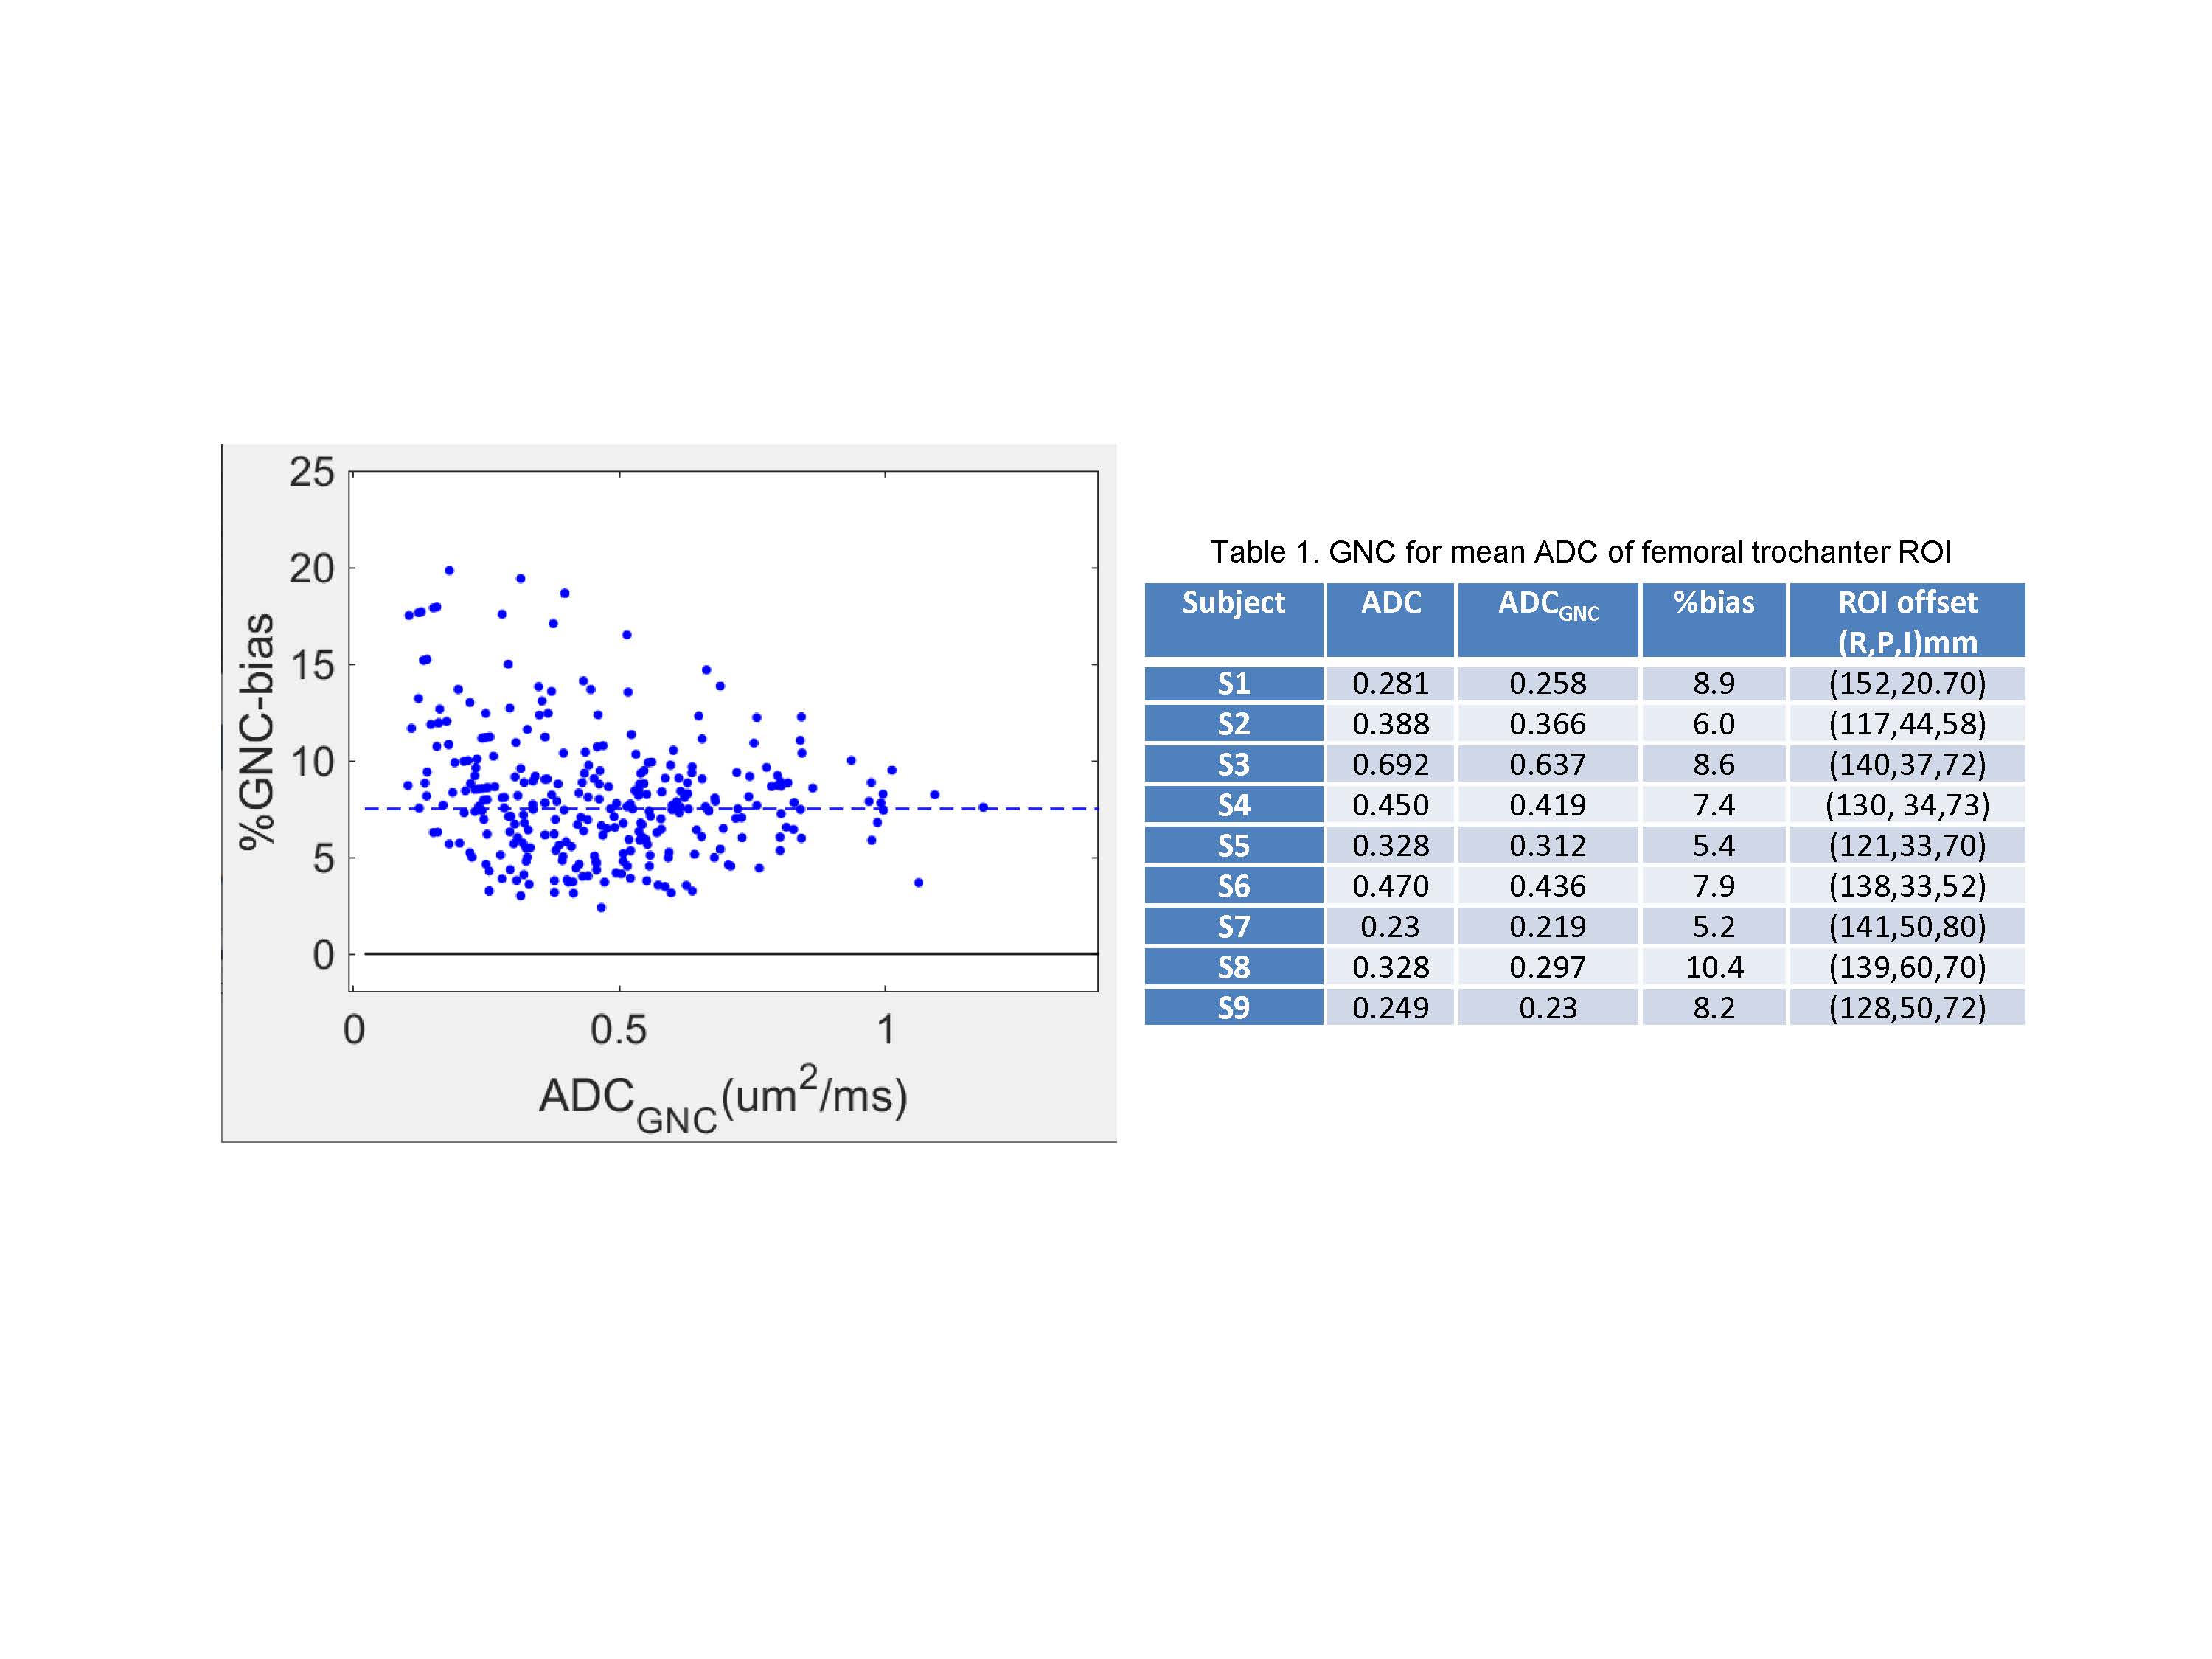
The fractional bias maps in Figure 1 confirmed the proper implementation of GNC, which adequately accounted for both system GNL and the table offsets between lower spine and pelvic scan stations. These maps provided effective feedback for quality control of the on-scanner GNC implementation. The speckle-like noise evident for low ADC<0.1μm2/ms reflected limited contrast-to-noise for b=800 s/mm2. The absolute GNL bias ranged between negative 8% in superior/inferior (SI)-direction (e.g., for L-spine vertebrae, VB) to positive 15% for right/left (RL) offset from the bore axis, consistent with predicted system GNL pattern (Figure 2, “modeled” map).GNL-induced nonuniformity of b-value introduced false heterogeneity in bone ADC maps (Fig.2, “measured” map and ADC histograms) and substantial errors for off-center bone anatomy both in absolute ADC values and position-related variability4,5. The average improvement in ADC uniformity between VB and femoral trochanter bone (FB) across studied subject was 15±3% (Fig.2). The average voxel-wise bias corrected for FB of 9 subjects (Figure 3) was 7.5%, shifting measured mean ADC (0.5μm2/ms) to lower values by 0.035μm2/ms. The percent GNC bias was nominally independent of ADC.
The correction impact on mean ADC of FB ROIs for 9 subjects is summarized in Table 1. Majority of studied subjects had low mean FB ADC<0.44μm2/ms. The GNC bias CV of ±2% was much smaller than observed spread of ADC values (±37%) across studied subjects. The corrected absolute bias correlated with the mean ADC value (R=0.91, P<0.001), but was largely independent of the FB ROI location (P>0.14). Without correction, the absolute ADC values for the ROI would be susceptible to b-value GNL errors mostly due to patient size and positioning (e.g., RL shift). These errors would also confound longitudinal ADC measurements.
Conclusion
The study demonstrated feasibility of prospective ADC correction for GNL bias in an imaging trial. Notable correction impact on BM ADC values promises improvements of accuracy, uniformity and longitudinal reproducibility for diagnostic and prognostic thresholds sought by the myelofibrosis imaging trial. On-scanner GNC implementation for spatial b-value bias is analogous to automatic geometric distortion correction which is most practical for adoption in clinical trials that utilize ADC.Acknowledgements
National Institutes of Health Grants: R01CA190299, U24CA237683References
1Schaefer J, Choi S, Luker G, Chenevert T, Ross B, Talpaz M. Primary myelofibrosis evolving to an aplastic appearing marrow. Clin Case Rep. 2018 May 31;6(7):1393-1395.
2Bammer R, Markl M, Barnett A, Acar B, Alley MT, Pelc NJ, Glover GH, Moseley ME. Analysis and generalized correction of the effect of spatial gradient field distortions in diffusion-weighted imaging. Magn Reson Med. 2003;50(3):560-9
3Malyarenko DI, Ross BD, Chenevert TL. Analysis and correction of gradient nonlinearity bias in apparent diffusion coefficient measurements. Magn Reson Med. 2014;71(3):1312-23.
4Newitt DC, Tan ET, Wilmes LJ, Chenevert TL, Kornak J, Marinelli L, Hylton N. Gradient nonlinearity correction to improve apparent diffusion coefficient accuracy and standardization in the American College of Radiology Imaging Network 6698 breast cancer trial. J Magn Reson Imaging. 2015;42(4):908-19.
5Malyarenko DI, Newitt DC, Amouzandeh G, Wilmes LJ, Tan ET, Marinelli L, Devaraj A, Peeters JM, Giri S, Vom Endt A, Hylton NM, Partridge SC, Chenevert TL: Retrospective Correction of ADC for Gradient Nonlinearity Errors in Multicenter Breast DWI Trials: ACRIN6698 Multiplatform Feasibility Study. Tomography 6(2): 86-92, 2020
Figures