1622
Effects of T2*-blurring on effective resolution of diffusion MRI with spiral and EPI readout trajectories at 7T1Department of Neurology and Neurosurgery, McGill University, Montreal, QC, Canada, 2McConnell Brain Imaging Center, Montreal Neurological Institute, McGill University, Montreal, QC, Canada, 3Department of Biomedical Engineering, McGill University, Montreal, QC, Canada
Synopsis
Several strategies have been used to increase the SNR of diffusion-weighted imaging including the use of partial Fourier EPI and spiral trajectories. Although these methods increase the SNR and sequence efficiency significantly, they affect the image quality and resulting diffusion measures causing loss of microstructural information of fine structures. Blurring caused by the T2* decay is one of the important effects resulting in low effective resolutions. Shorter T2* at ultra-high magnetic fields reduces the effective resolution in spite of providing higher SNR. This study shows about 60% lower effective resolution than the nominal resolution using PF-EPI and spiral at 7T.
Introduction
Diffusion weighted imaging (DWI) techniques provide invaluable information about the tissue microstructure, yet they are challenging contrasts to acquire. Several studies have investigated the signal-to-noise (SNR) of DW scans and propose strategies to enhance scanning efficiency due to its SNR-starved nature 1-3. Due to T2* decay, image acquisition techniques that sample the data in various patterns affect image quality differently. One of the main manifestations of the signal decay is blurring, resulting in a lower effective resolution. The difference between the nominal and effective resolution is more significant at ultra-high magnetic fields due to the shorter T2* times. This can potentially cause loss of microstructural information of fine structures such as the cortex. Here we compare the exclusive effect of T2* decay on the effective resolution of DWI of the brain acquired using echo planar imaging (EPI) with and without partial Fourier (PF), and spiral trajectories at 3 and 7T.Methods
A diffusion sequence was simulated for point spread function (PSF) analysis. T1, T2 and T2* values of the grey/white matter were set to 2000/1200, 47/47, and 33/26 ms for 7T, and 1300/800, 72/79, and 66/46 ms for 3T respectively 4-7. EPI, PF-EPI, and spiral readout trajectories were generated for resolutions in a range of 0.6-1.8 mm2. EPI trains were designed with a bandwidth-per-pixel of 1388 Hz, and a maximum slew rate of 200 T/m/s. The spiral trajectories were generated with a maximum amplitude of 27 mT/m and slew rate of 160 T/m/s. The diffusion-encoding duration was 42 ms for a b-value of 2000 s/mm2. Effective resolution of scans was determined using the full width at half maximum (FWHM) of the PSF.A diffusion protocol with b-values = [0, 300, 1000, 2000] s/mm2 and 5, 5, 16, and 48 diffusion directions respectively was acquired using the three different readout trajectories. MR scanning was performed on a 7T Terra (Siemens, Erlangen, Germany) using a 32-channel Nova coil on one human subject. Shared parameters were nominal isotropic resolution= 1.5 mm, TR= 5000 ms, slice number= 40, and field-of-view= 256×256×60 mm3. The TE of the sequences with EPI, PF-EPI, and spiral was 82, 63, and 46 ms respectively. An acceleration factor of (R=)3 was used for the EPI and PF-EPI, and R=4 for the spiral. A PF factor of 0.75 was used in the PF-EPI. A gradient-echo (GRE) sequence with 6 echoes, TE1= 3.83 ms, ΔTE= 1.07 ms and a resolution of 1.5 mm3 was acquired for coil sensitivity map 8 and ΔB0 estimation. To eliminate distortions and blurring caused by eddy currents and ΔB0 inhomogeneities, all scans were monitored up to the 2nd order of spherical harmonics using a dynamic field camera (Skope MRT, Zurich, Switzerland) in a separate session.
Images were reconstructed using an in-house MATLAB script based on the expanded signal model 9 incorporating effects of ΔB0 as well as readout trajectory imperfections. After registration of all volumes 10 and removing Gibbs ringing 11, fractional anisotropy (FA) maps were generated 11.
Results and discussion
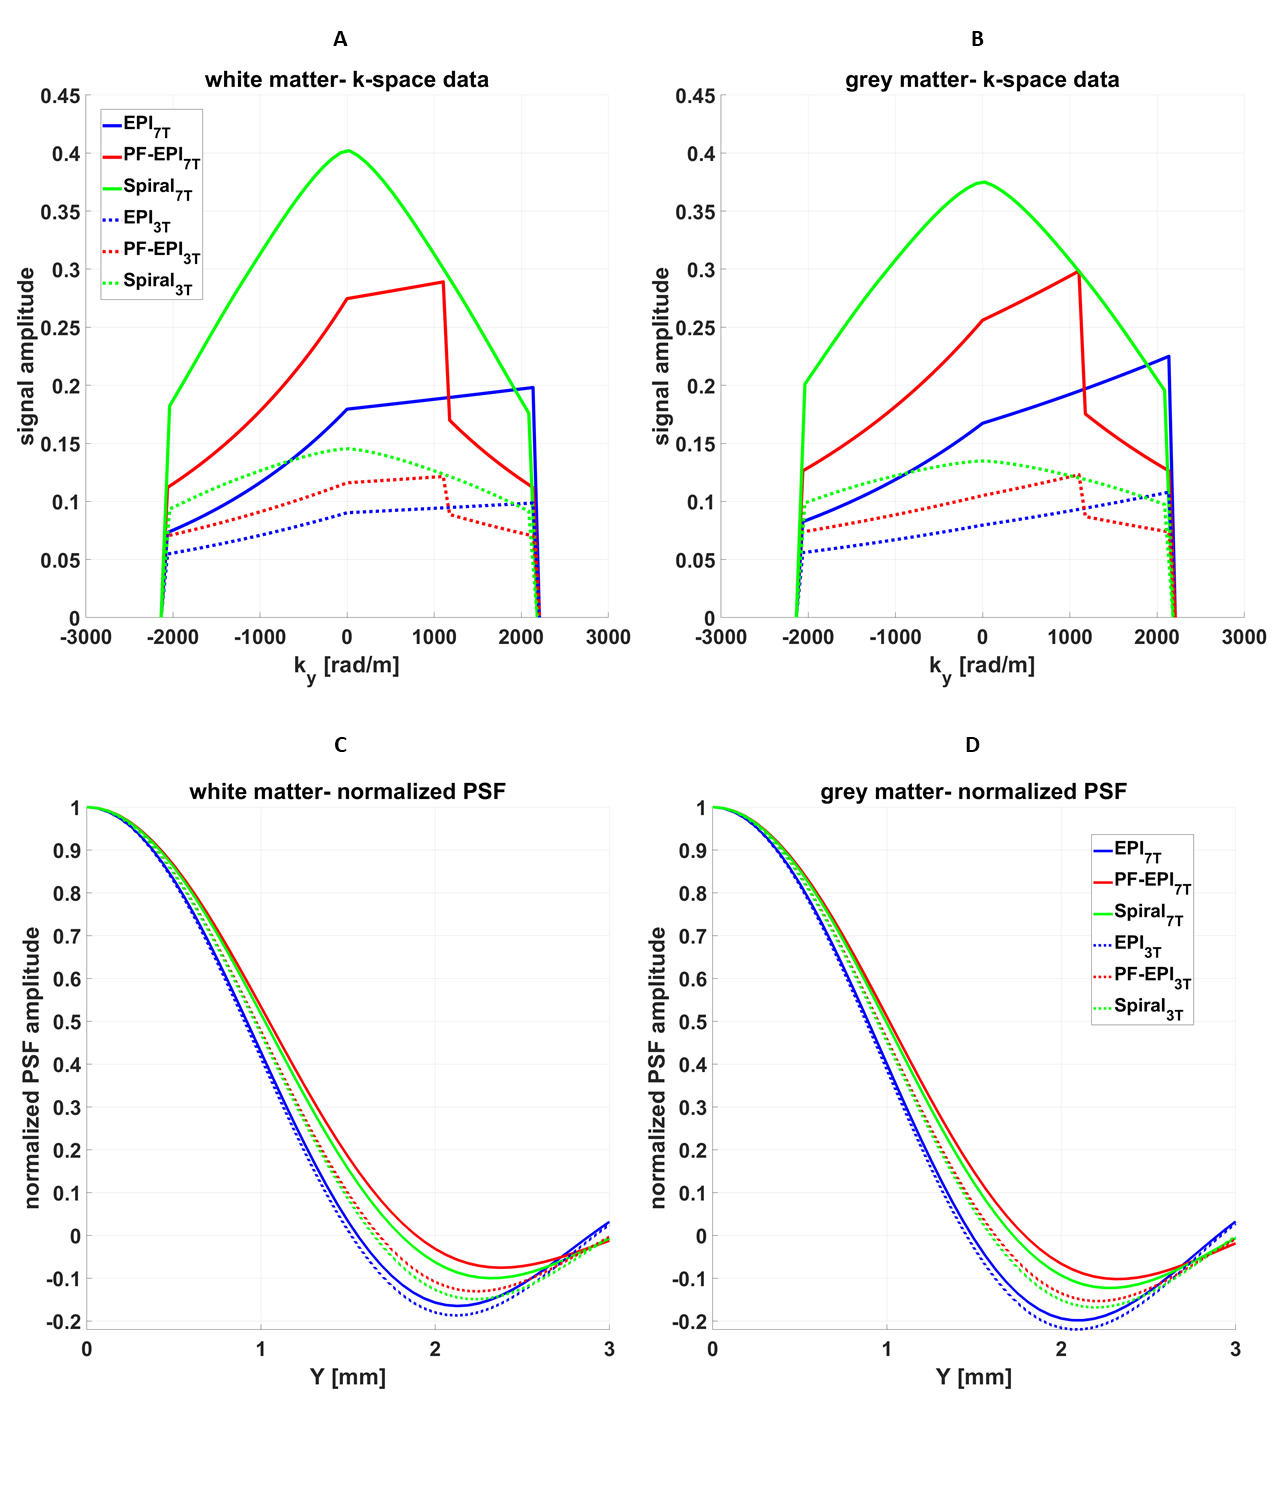
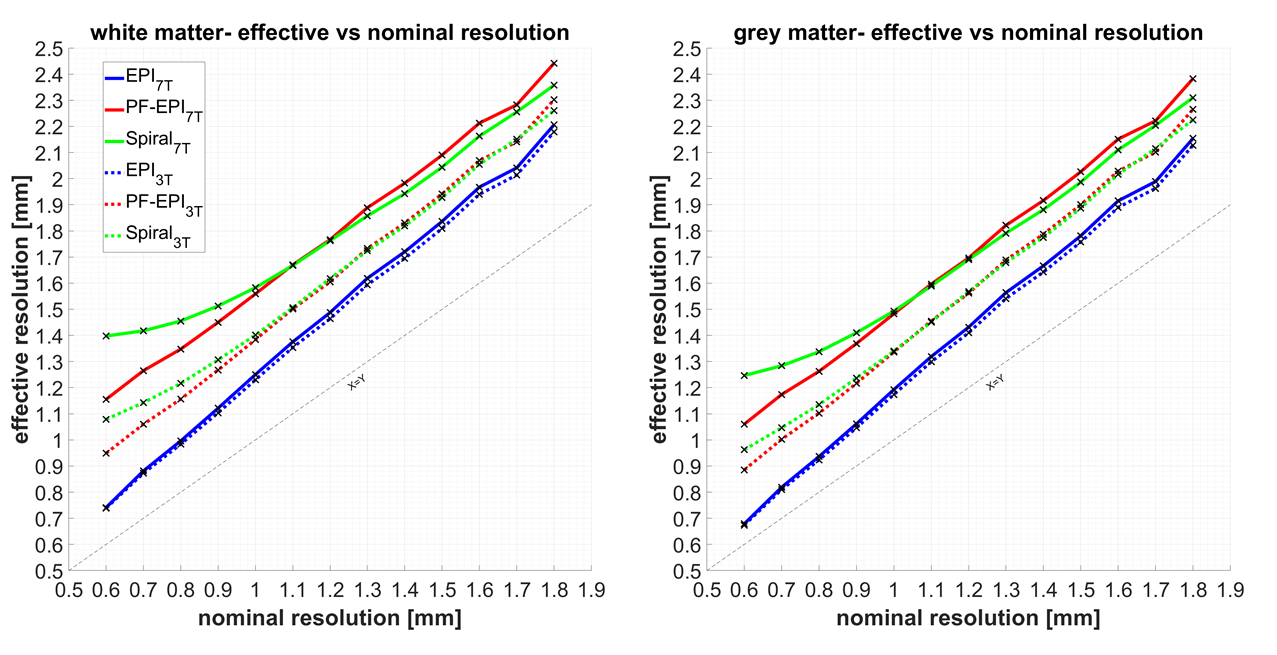
Figure 1 shows k-space data and corresponding PSF of the grey and white matter acquired using EPI, PF-EPI, and spiral trajectories for a nominal resolution of 1.5 mm3. The amplitude of the k-space data is modulated by the main magnetic field strength using the relationship in12. As expected, due to the shorter T2* of the white matter in comparison to the grey matter, a greater signal decay is visible in the k-space data which causes a wider PSF and therefore more blurring.Figure 2 shows the effective resolution as a function of nominal resolution. EPI provides the sharpest images, while PF-EPI and spiral show more intense blurring and therefore a lower effective resolution. Due to shorter T2* at 7T, the effective resolution of PF-EPI and spiral is about 20% lower than the resolution at 3T, and about 60% lower than the nominal resolution. Effective resolution using EPI readout shows about 20% reduction from the nominal resolution at both 3T and 7T.
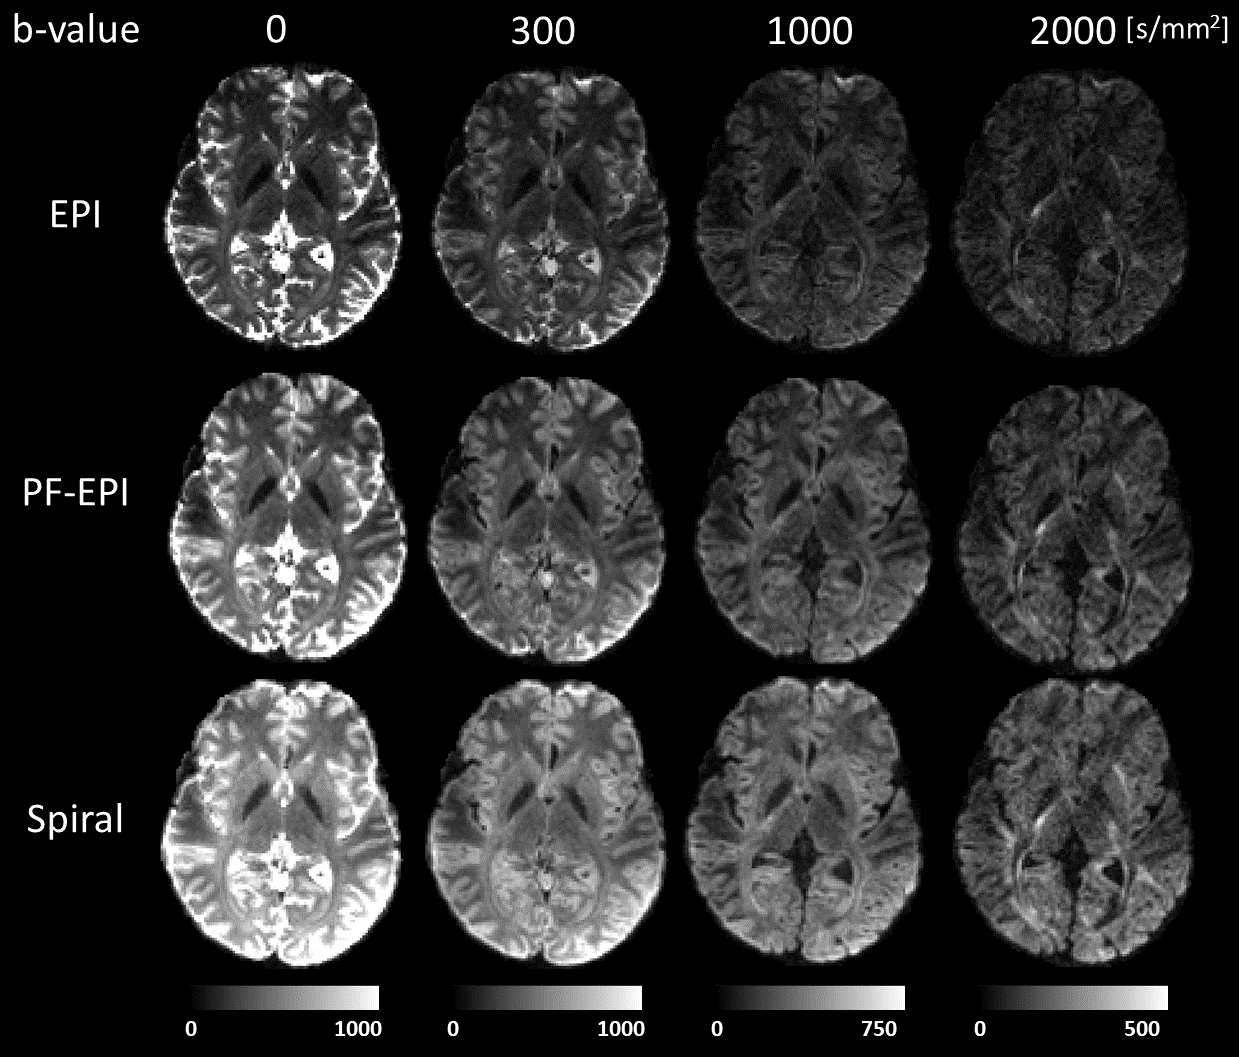
Figure 3 shows reconstructed images of a slice using EPI, PF-EPI, and spiral trajectories at different b-values. The images show geometrical consistency across different b-values and readout trajectories. EPI images appear sharper in comparison to PF-EPI and spiral. Additionally, the SNR gain of the spiral and PF-EPI trajectories at lower TEs is clear.
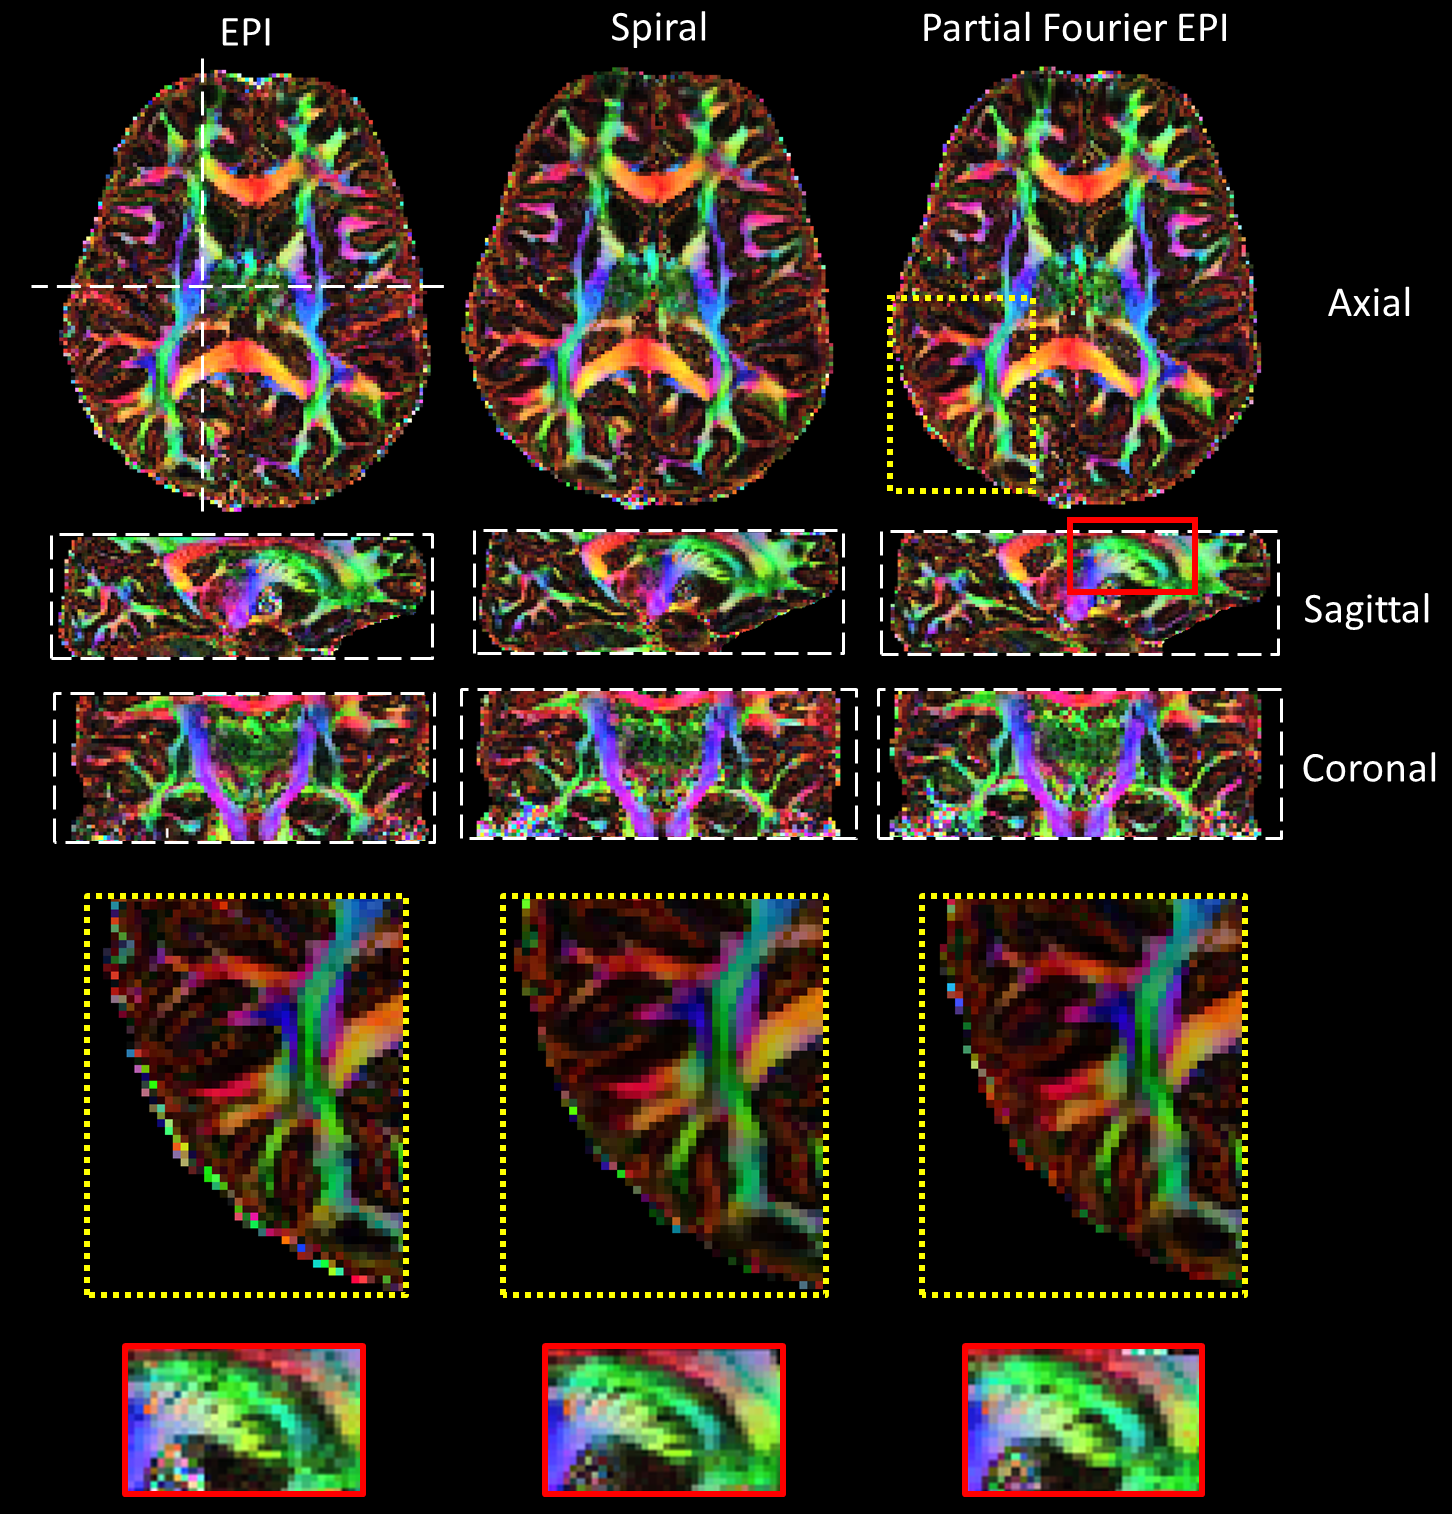
Figure 4 shows the color FA maps. EPI shows a significantly sharper FA map compared to the PF-EPI and spiral, and spiral provides a slightly sharper FA map compared to the PF-EPI, which is consistent with the PSF simulation results.
Conclusion
This study investigates the effect of the shorter T2* decay at 7T on the effective resolution of DW images and FA maps using simulations and a human scan. Although high-SNR strategies such as PF-EPI and spiral trajectory are beneficial for DWI, their effect on the effective resolution should be also taken into account at ultra-high fields when choosing a readout strategy. This is more important in studies that require high-resolution scans to look at fine structures of the white matter and the cortex to avoid misinterpretation. Further investigation is needed to study effects of different trajectory parameters and diffusion encoding schemes on the effective resolution.Acknowledgements
The authors would like to thank the Skope team for their technical support. This project was funded by the Natural Sciences and Engineering Research Council of Canada, the Fonds de recherche du Québec – Santé, and Healthy Brains for Healthy Lives. The data was acquired at the McConnell Brain Imaging Centre, which is supported by the Canadian Foundation for Innovation, Brain Canada, and Healthy Brains for Health Lives.References
[1] Y. Lee et al., “On the signal-to-noise ratio benefit of spiral acquisition in diffusion MRI,” Magn Reson Med, Dec. 2020, doi: 10.1002/mrm.28554.
[2] T.-K. Truong and A. Guidon, “High-Resolution Multi-Shot Spiral Diffusion Tensor Imaging with Inherent Correction of Motion-Induced Phase Errors,” Magn Reson Med, vol. 71, no. 2, pp. 790–796, Feb. 2014, doi: 10.1002/mrm.24709.
[3] M. Engel et al., “T-Hex: Tilted hexagonal grids for rapid 3D imaging,” Magnetic Resonance in Medicine, vol. 85, no. 5, pp. 2507–2523, 2021, doi: https://doi.org/10.1002/mrm.28600.
[4] W. D. Rooney et al., “Magnetic field and tissue dependencies of human brain longitudinal 1H2O relaxation in vivo,” Magnetic Resonance in Medicine, vol. 57, no. 2, pp. 308–318, 2007, doi: 10.1002/mrm.21122.
[5] E. F. Cox and P. A. Gowland, “Simultaneous quantification of T2 and T′2 using a combined gradient echo-spin echo sequence at ultrahigh field,” Magnetic Resonance in Medicine, vol. 64, no. 5, pp. 1440–1445, 2010, doi: 10.1002/mrm.22522.
[6] A. M. Peters et al., “T2* measurements in human brain at 1.5, 3 and 7 T,” Magnetic Resonance Imaging, vol. 25, no. 6, pp. 748–753, Jul. 2007, doi: 10.1016/j.mri.2007.02.014.
[7] J. P. Wansapura, S. K. Holland, R. S. Dunn, and W. S. Ball, “NMR relaxation times in the human brain at 3.0 tesla,” Journal of Magnetic Resonance Imaging, vol. 9, no. 4, pp. 531–538, 1999, doi: 10.1002/(SICI)1522-2586(199904)9:4<531::AID-JMRI4>3.0.CO;2-L.
[8] M. Uecker et al., “ESPIRiT—an eigenvalue approach to autocalibrating parallel MRI: Where SENSE meets GRAPPA,” Magnetic Resonance in Medicine, vol. 71, no. 3, pp. 990–1001, 2014, doi: 10.1002/mrm.24751.
[9] B. J. Wilm, C. Barmet, M. Pavan, and K. P. Pruessmann, “Higher order reconstruction for MRI in the presence of spatiotemporal field perturbations,” Magnetic Resonance in Medicine, vol. 65, no. 6, pp. 1690–1701, 2011, doi: https://doi.org/10.1002/mrm.22767.
[10] M. Nilsson et al., An open-source framework for analysis of multidimensional diffusion MRI data implemented in MATLAB. 2018.
[11] J.-D. Tournier et al., “MRtrix3: A fast, flexible and open software framework for medical image processing and visualisation,” Neuroimage, vol. 202, p. 116137, Nov. 2019, doi: 10.1016/j.neuroimage.2019.116137.
[12] R. Pohmann, O. Speck, and K. Scheffler, “Signal-to-noise ratio and MR tissue parameters in human brain imaging at 3, 7, and 9.4 tesla using current receive coil arrays,” Magn Reson Med, vol. 75, no. 2, pp. 801–809, Feb. 2016, doi: 10.1002/mrm.25677.
Figures