1621
Feasibility of 3D Adiabatic T1ρ-prepared Fast Spin Echo (3D Adiab-T1ρ-FSE) Imaging1Radiology, University of California San Diego, San Diego, CA, United States, 2GE Healthcare, San Diego, CA, United States, 3Radiology Service, Veterans Affairs San Diego Healthcare System, San Diego, CA, United States
Synopsis
T1ρ has been investigated as a quantitative biomarker sensitive to changes in macromolecules such as proteoglycan and collagen in musculoskeletal systems. More recently, adiabatic T1ρ (Adiab-T1ρ) has emerged as an alternative to conventional continuous wave T1ρ to reduce the magic angle effect, which is a major confounding factor in accurate T1ρ estimation. In this study, we investigated a new pulse sequence combining adiabatic T1ρ preparation and efficient 3D fast spin echo (FSE) for more robust adiab-T1ρ mapping in the human knee. The efficacies of RF cycling and magnetization reset were also demonstrated.
Introduction
Spin lattice relaxation in the rotating frame (T1ρ) is a promising biomarker for early detection of osteoarthritis (OA), as it is sensitive to changes in proteoglycan (PG) and collagen in the musculoskeletal system 1–3. Conventional continuous wave-based T1ρ (CW-T1ρ) imaging is disadvantaged by a strong magic angle effect, with artificially increased CW-T1ρ values when fibers are reoriented from 0° to ~55° relative to the B0 direction 4, thus impairing reproducibility and diagnostic power. Recently, adiabatic full passage (AFP) pulses were incorporated into T1ρ imaging to ameliorate the magic angle effect for more robust detection of early cartilage degeneration 5-8. In this study, we investigated the feasibility of 3D adiabatic T1ρ-prepared fast spin echo (3D Adiab-T1ρ-FSE) imaging.Methods
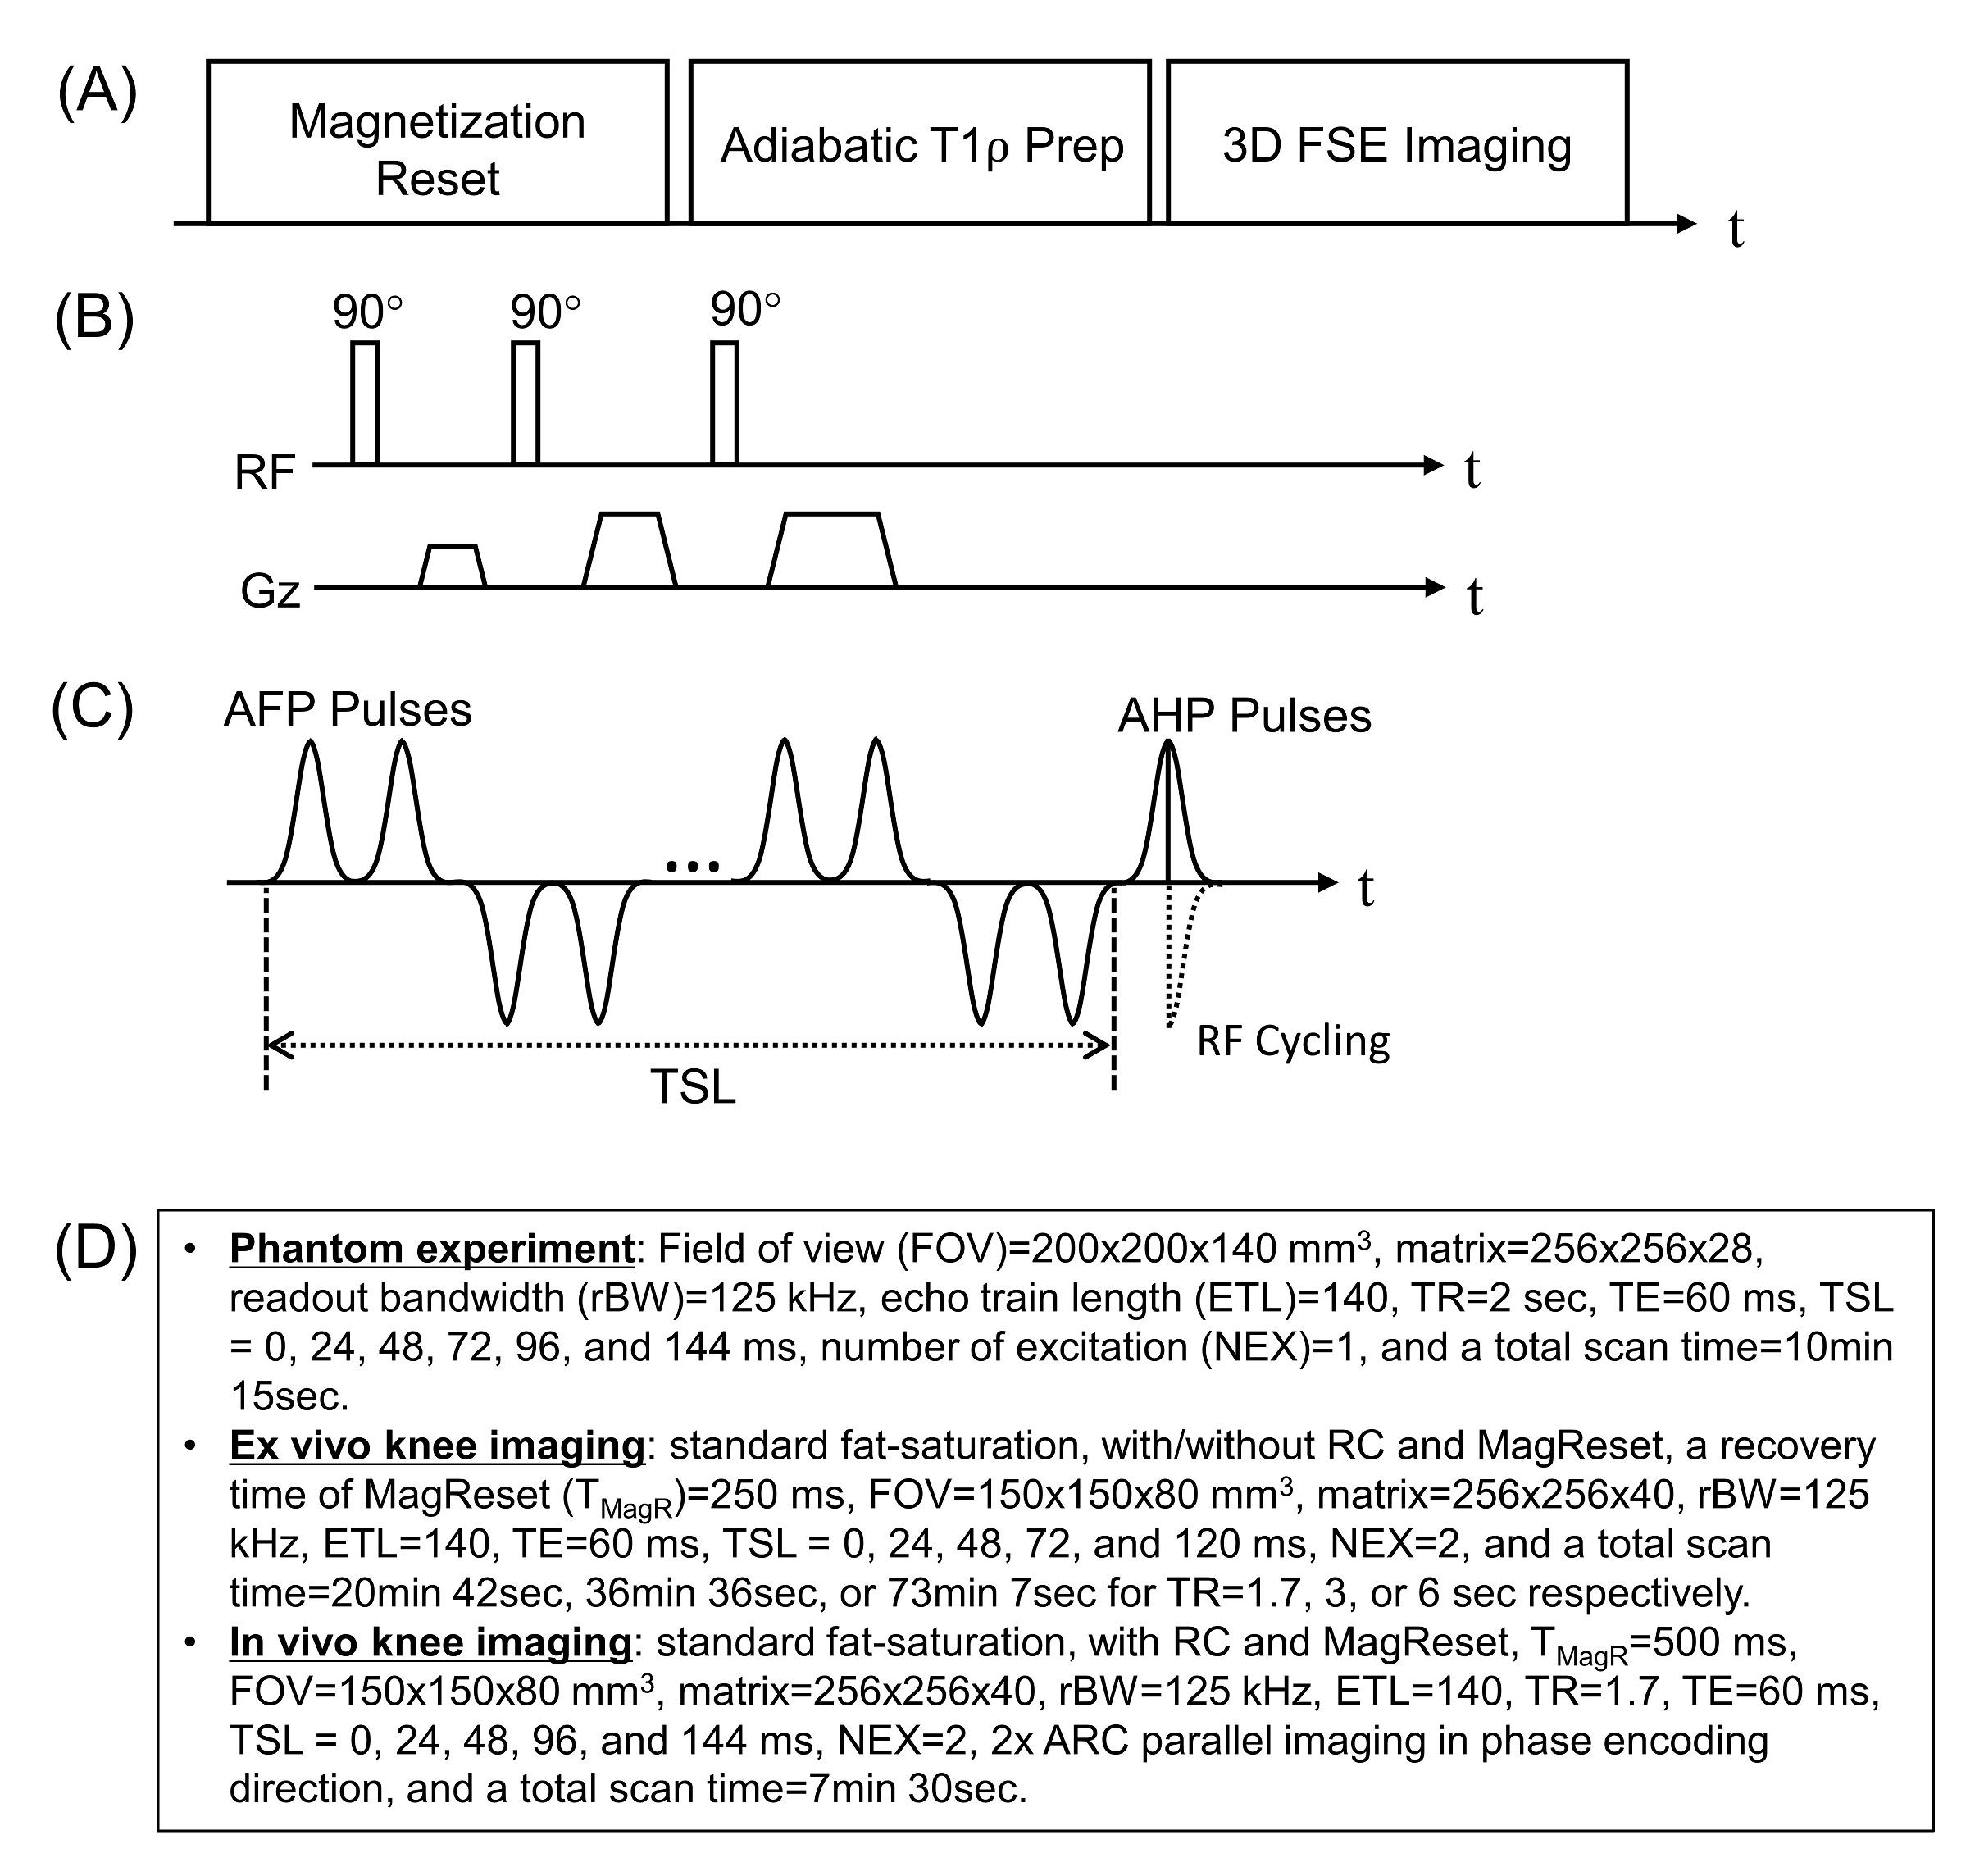
Figure 1A shows the modules of the 3D Adiab-T1ρ-FSE sequence. First, a magnetization reset (MagReset) module is used (Figure 1B) to spoil longitudinal magnetization and thus force the steady state signal to depend only on the fixed saturation recovery time. This was shown to be effective in T1ρ imaging where variable spin-locking times (TSLs) may cause different degrees of T1 recovery leading to inconsistent signal 9. Figure 1C shows spin-locking preparation utilizing an AFP pulse train (duration=6.048 ms, bandwidth=1.643 kHz, and maximum B1 amplitude=17 mT) followed by RF cycling (RC) using two adiabatic half pulses (AHPs). RC is known to effectively remove T1 contamination and thus improve signal fitting 9, which requires two acquisitions with positive and negative RF phases. For imaging, a variable flip angle (VFA)-based 3D FSE readout scheme was utilized 10.The 3D Adiab-T1ρ-FSE sequence was implemented on a clinical 3T MR750 scanner (GE Healthcare). To evaluate the proposed sequence, a phantom experiment comprised of two sets of three tubes with 2%, 3%, and 4% agarose, ex vivo imaging with three cadaveric knee joints, and in vivo imaging with five healthy volunteers were performed with an 8-channel transmit/receive knee coil using the imaging parameters shown in Figure 1D.
All images were reconstructed online and processed with Matlab. To yield Adiab-T1ρ parameters, non-linear least squares curve fitting was performed based on a mono-exponential decay model with two free parameters to fit (M0 and T1ρ) using either mean signal in a region of interest (ROI) or pixelwise data.
Results
Figure 2A shows T1ρ-weighted images with five different TSLs from the agarose phantom. For all tubes, monotonical decay was observed with increased TSLs. Figures 2B and 2C show the average signal and the fitted curve with tubes 1-3 and 4-6, as well as linear correlation between the measured R1ρ (i.e., 1/T1ρ) and agarose concentrations. As expected, tubes with higher agarose concentrations exhibited shorter T1ρ (i.e., higher R1ρ). The measured R1ρ showed high linearity with the agarose concentrations (R2>0.99). The top sets of tubes (tubes 1-3) showed slightly lower T1ρ than the bottom sets (tubes 4-6), presumably due to the spatially varying B1 field causing different T1ρ dispersions.Figure 3 shows images from a cadaveric knee joint scanned with the 3D Adiab-T1ρ-FSE sequence with or without RC and MagReset. Without RC, strong signal decay (blue arrows) and/or rebounded signal (red arrows) were observed between images with TSL=0 and 24ms (Figure 3A), which were ameliorated by RC (Figure 3B). No dramatic morphological difference was observed between images with or without MagReset (Figure 3B or 3C).
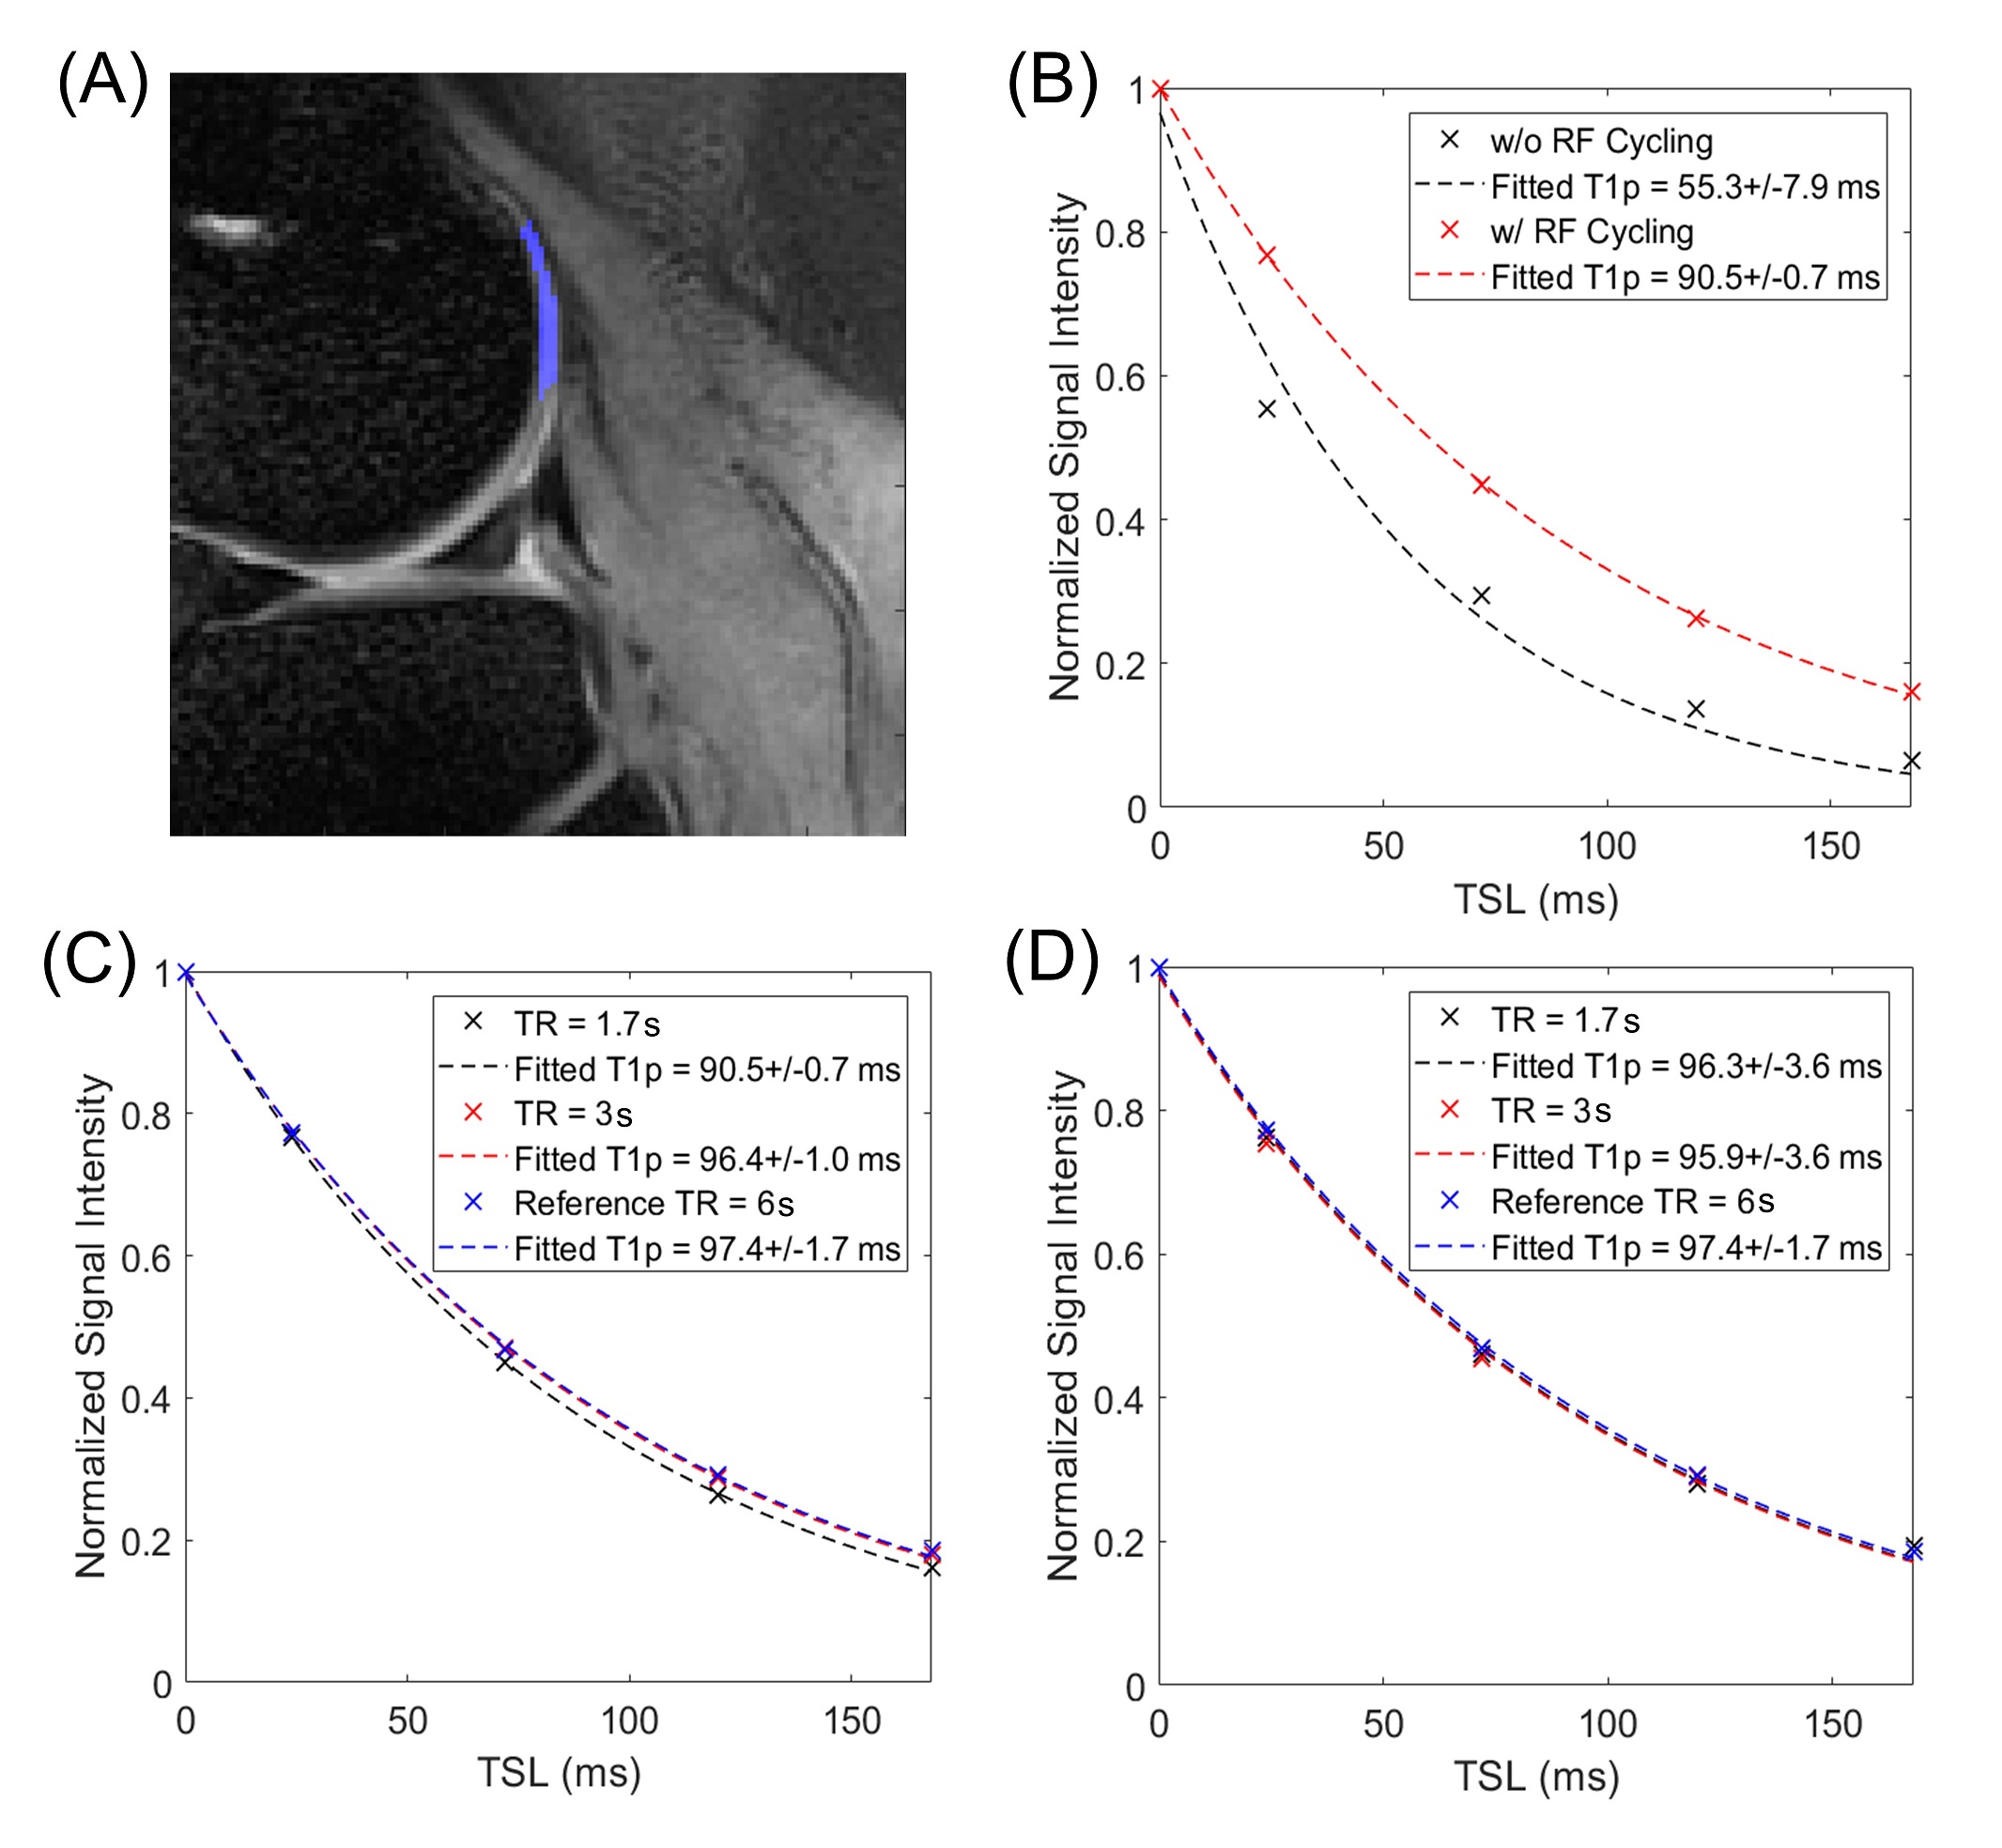
The signal decay curves from an ROI within femoral cartilage (Figure 4A) are shown in Figures 4B-D. As observed in Figure 3, the T1ρ signal dropped significantly between TSLs of 0 and 24ms, spoiling curve fitting (black dotted line) resulting in too short a T1ρ parameter. With RC, the signal decay clearly exhibited mono-exponential decay (red dotted line) and the fitted T1ρ parameter was within the expected range. Figures 4C-D show T1ρ signal curves obtained with three different TRs (1.7, 3, and 6sec) where the signal curve with TR of 6sec was considered as a reference with negligible T1 effect. Without MagReset, the signal decay depended on TR due to the unwanted variable T1 weighting (Figure 4C), whereas the presence of MagReset dramatically removed the dependence on TR (Figure 4D).
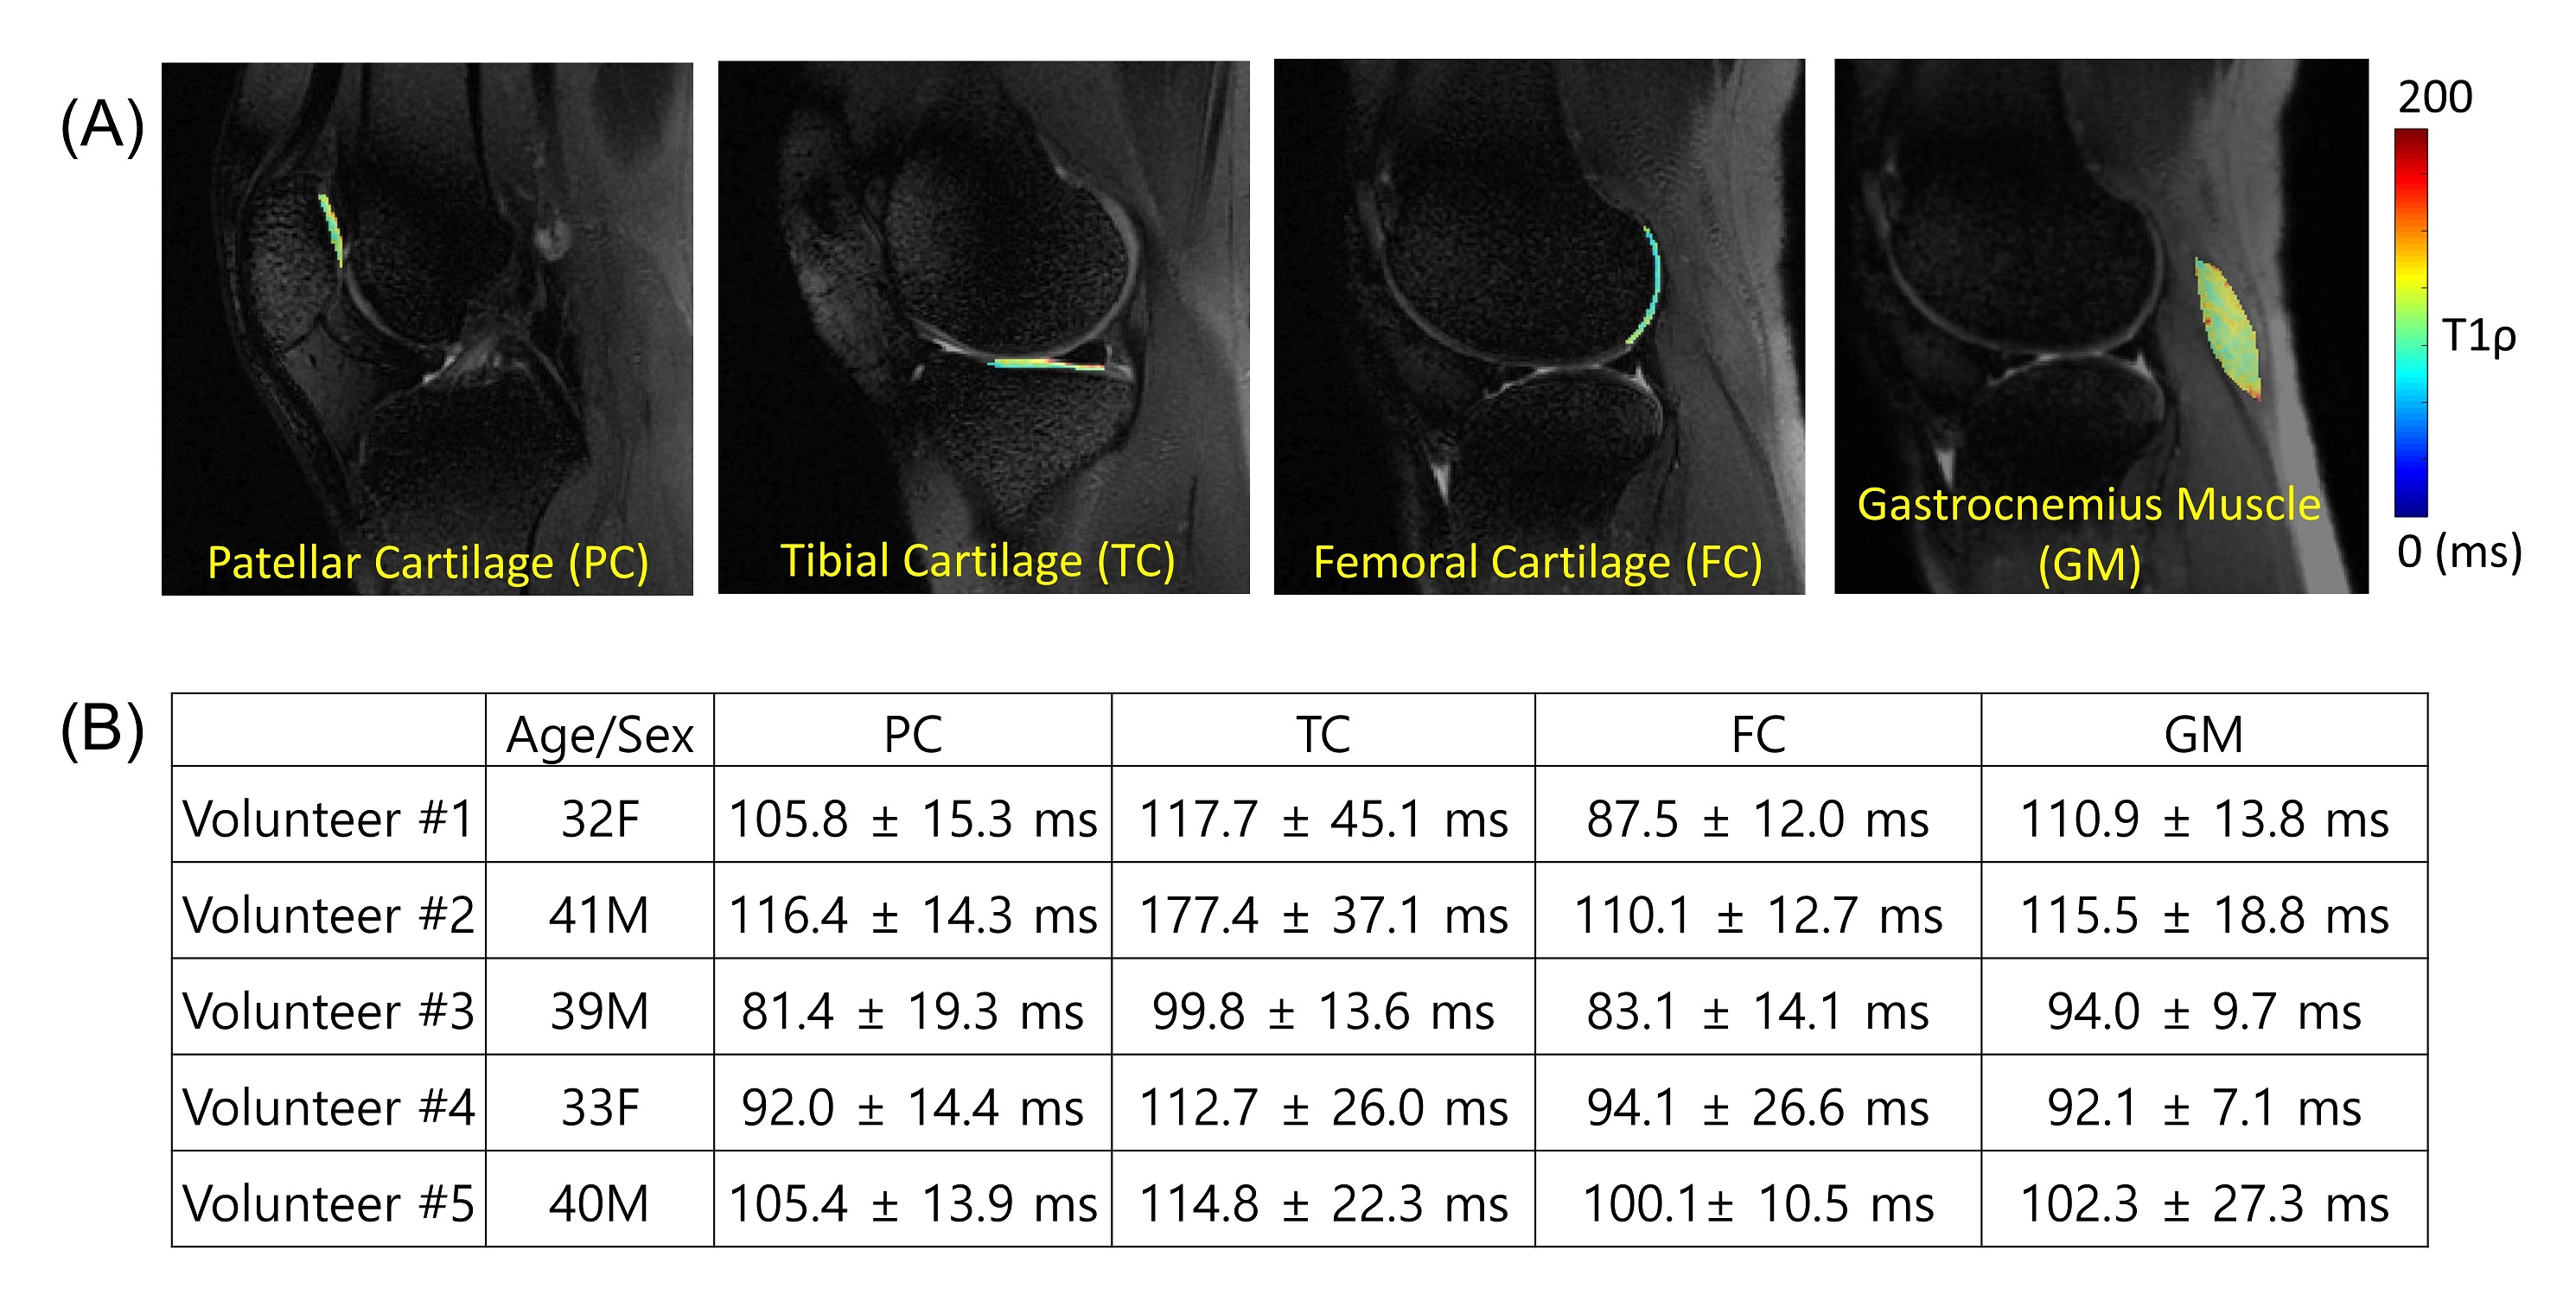
Figure 5A shows T1ρ mapping of a representative healthy volunteer. All four ROIs showed estimated T1ρ values within the expected range 5-7. Figure 5B shows complete values for all subjects.
Discussion and Conclusion
In this study, we demonstrated feasibility of 3D Adiab-T1ρ-FSE in the human knee. The combination of 3D FSE and adiabatic-T1ρ preparation is expected to reduce the magic angle effect and susceptibility, likely providing a novel effective quantitative imaging tool in musculoskeletal applications. The spatially varying signal dropout and rebound shown in Figures 3 and 4 are presumably due to FSE readout contamination by the simulated echoes, more obvious in vivo due to stronger B1 inhomogeneity. We showed the efficacy of RC in removing such signal variation. We will investigate further to clarify the source of this unwanted signal change. MagReset was also effective in removing TR dependency, which is beneficial because it removes the need for additional T1 mapping to compensate for different T1 recovery times. In future studies, we will investigate these effects in depth, optimize imaging protocols, and evaluate 3D Adiab-T1ρ-FSE in a group of patients.Acknowledgements
The authors acknowledge grant support from the NIH (R01AR062581, R01AR068987, R01AR075825, R01AR078877, and R21AR075851), Veterans Affairs (I01RX002604 and I01CX001388), and GE Healthcare.References
1. Duvvuri U, Charagundla SR, Kudchodkar SB, et al. Human Knee: In Vivo T1ρ -weighted MR Imaging at 1.5 T—Preliminary Experience. Radiology 2001;220:822–826.
2. Regatte RR, Akella SVS, Wheaton AJ, et al. 3D-T1ρ-relaxation mapping of articular cartilage: In vivo assessment of early degenerative changes in symptomatic osteoarthritic subjects. Acad. Radiol. 2004;11:741–749.
3. Akella S V, Regatte RR, Gougoutas a J, et al. Proteoglycan-induced changes in T1rho-relaxation of articular cartilage at 4T. Magn. Reson. Med. 2001;46:419–423.
4. Shao H, Pauli C, Li S, Ma Y, Tadros AS, Kavanaugh A, et al. Magic angle effect plays a major role in both T1rho and T2 relaxation in articular cartilage. Osteoarthritis Cartilage 2017; 25:2022-2030.
5. Rautiainen J, Nissi MJ, Liimatainen T, Herzog W, Korhonen RK, Nieminen MT. Adiabatic rotating frame relaxation of MRI reveals early cartilage degeneration in a rabbit model of anterior cruciate ligament transection. Osteoarthritis and Cartilage 2014; 22:1444-1452.
6. Rautiainen J, Nissi MJ, Salo E, Tiitu V, et al. Multiparametric MRI assessment of human articular cartilage degeneration: correlation with quantitative histology and mechanical properties. Magn Reason Med 2015; 74:249-259.
7. Casula V, Nissi MJ, Podlipska J, et al. Elevated adiabatic T1ρ and T2ρ in articular cartilage are associated with cartilage and bone lesions in early osteoarthritis: a preliminary study. J Magn Reson Imaging 2017; 46:678-689.
8. Hänninen N, Rautiainen J, Rieppo L, Saarakkala S, Nissi MJ. Orientation anisotropy of quantitative MRI relaxation parameters in ordered tissue. Sci Rep 2017; 7:9606.
9. Li X, Han ET, Busse RF, Majumdar S. In vivo T1ρ mapping in cartilage using 3D magnetization-prepared angle-modulated partitionedk-space spoiled gradient echo snapshots (3D MAPSS). Magn. Reson. Med. 2008;59:298–307.
10. Busse RF, Brau ACS, Vu A, et al. Effects of refocusing flip angle modulation and view ordering in 3D fast spin echo. Magn. Reson. Med. 2008;60:640–649.
Figures