1618
A vendor-neutral 3D MP-RAGE implementation in Pulseq for reduced inter-site variability1Psychiatry, Brigham and Women's Hospital, Harvard Medical School, Boston, MA, United States, 2University of Michigan, Ann Arbor, MI, United States, 3High Field MR Center, Center for Medical Physics and Biomedical Engineering, Medical University of Vienna, Vienna, Austria, 4Brigham and Women's Hospital, Boston, MA, United States, 5Athinoula A. Martinos Center for Biomedical Imaging, Harvard Medical School, Boston, MA, United States, 6Vanderbilt University, Nashville, TN, United States, 7Fetal-Neonatal Neuroimaging and Developmental Science Center, Boston Children’s Hospital, Harvard Medical School, Boston, MA, United States
Synopsis
Inter-scanner variability can reduce the statistical power of neuroimaging studies due to the increased variance in the data. While existing efforts employ consistent high level parameters to acquire data across scanners, we hypothesize that differences due to sequence implementation and reconstruction algorithms contribute substantially to variability in multi-center settings. We propose a unified vendor-neutral MP-RAGE protocol based on the Pulseq sequence development platform that can be used consistently across sites and vendors for reducing inter-scanner variability. Preliminary results show increased consistency of cortical thickness across sites using Pulseq protocol compared to vendor-provided sequences.
Background/Introduction:
3D MP-RAGE offers strong T1 weighting in acceptable scan times, and is the most widely used sequence for structural brain analysis (e.g., for measuring cortical thickness and tissue segmentation volumes). 3D MP-RAGE is available on all major MRI vendor platforms, which has facilitated its use in multi-site neuroimaging studies [1]. In such studies it is desirable to acquire, reconstruct, and analyze the images in exactly the same manner across sites, to help make MRI-based measures directly comparable. However, when using each vendor’s built-in protocol, the scanner operator is typically only able to ‘harmonize’ high-level acquisition parameters such as the voxel size, readout bandwidth, and inversion time. This leaves several aspects of the protocol beyond the user’s control, including: (i) detailed radiofrequency and gradient waveform shapes, including choice of fat suppression method if desired, (ii) image reconstruction method (e.g., SENSE vs GRAPPA as well as details of their implementation), and (iii) post-processing choices such as image smoothing/apodization or gradient nonlinearity correction. Here we introduce an open-source implementation of a vendor-neutral 3D MP-RAGE protocol based on Pulseq [2], that offers complete and detailed control of the entire MRI workflow from acquisition to analysis and guarantees the consistency of these steps across vendors and sites.Methods:
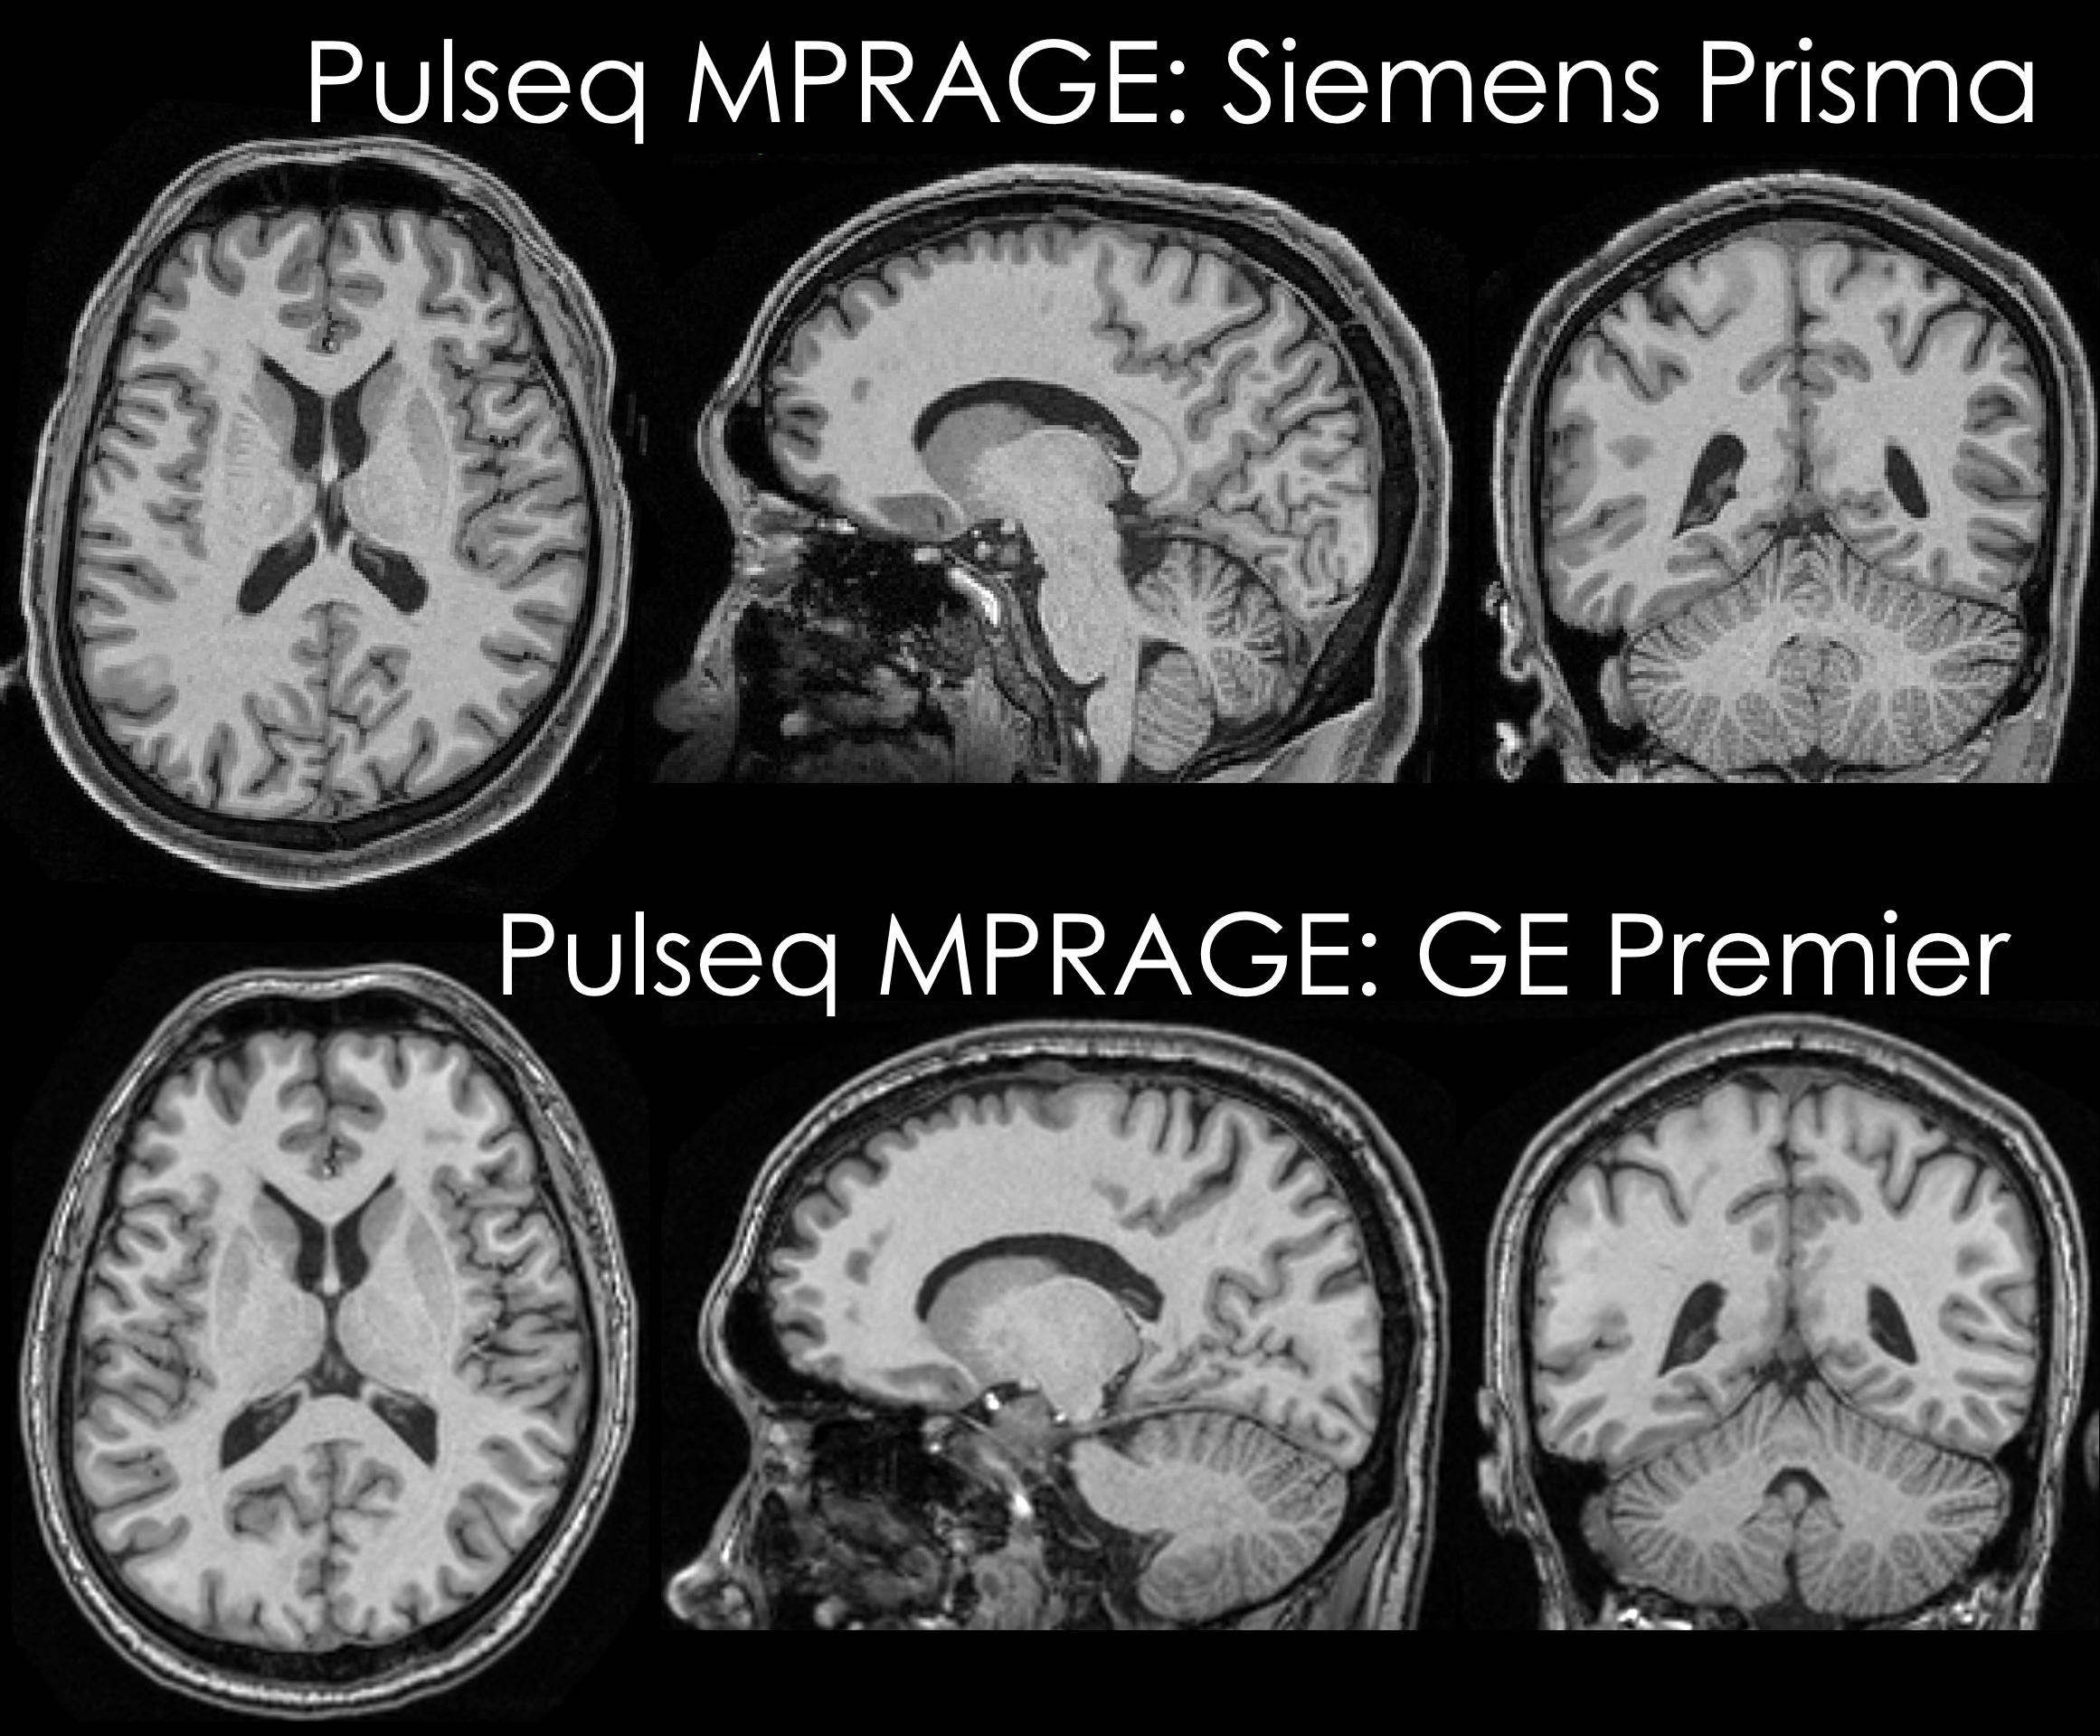
Data acquisition: Pulseq v1.4.0 was specifically optimized to provide improved performance for 3D sequences and used to implement all components of an MP-RAGE sequence. A healthy volunteer (male, age: 33 years) was scanned on two scanners: (i) Siemens Prisma and (ii) GE Premier, using product (vendor) MP-RAGE sequences as well as our Pulseq implementation. Acquisition parameters were matched to the existing Siemens and GE ABCD study protocols at our institutions: 1 mm isotropic spatial resolution, TR/TI = 2500/1070 ms, readout bandwidth (BW) 241 Hz/pix (Siemens product) or 244 Hz/pix (GE product and Pulseq), and 1-1 binomial water excitation (Siemens product and Siemens Pulseq) or non-selective excitation (GE product and GE Pulseq). The Pulseq MP-RAGE sequence was executed on the Siemens scanner using the Siemens Pulseq interpreter (that reads the Pulseq file directly), and on the GE scanner using the TOPPE [3] interpreter. To obtain within-scanner variability, two scans were acquired for each sequence. Image reconstruction: Each vendor’s on-the-scanner routine was used to reconstruct the product sequences. For Pulseq, we performed offline reconstruction using the following steps: GRAPPA reconstruction [4] with a 3x3 kernel, apodization of k-space with a Tukey window setting of 0.25, coil combination using ESPIRiT sensitivities [5] estimated from center 32 calibration lines, and gradient non-linearity correction. The latter was done using Freesurfer for the Siemens data and GE’s ‘Gradwarp’ function in the Orchestra toolbox for the GE data (as the Freesurfer tool currently doesn't support the GE Premier scanners) (see axial views in Figure 1). Subsequently, the brain was masked manually to remove skull and other regions. Analysis: Freesurfer [6] v7.1 was run on all images allowing to estimate the volume and thickness across all scans. Average between-scanner percent differences in volume and thickness were calculated for both product and Pulseq data in each of the Freesurfer defined regions-of-interest (ROIs).Results:
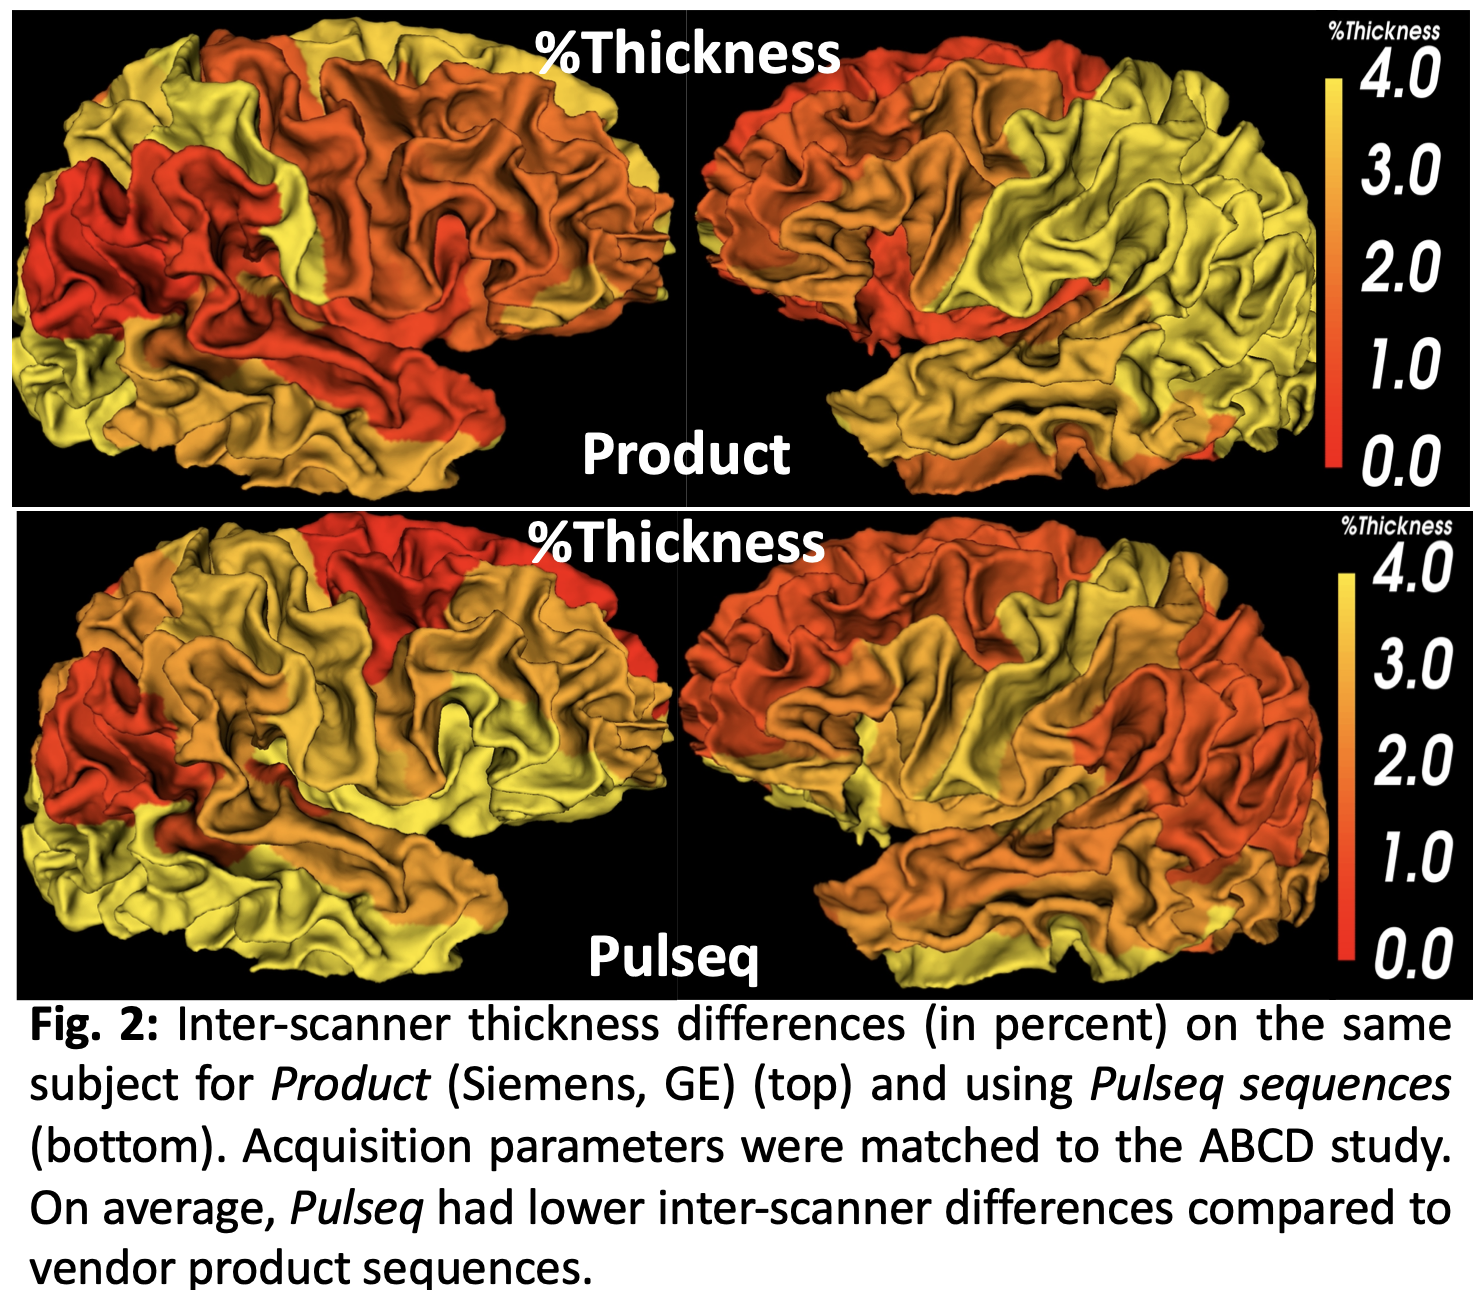
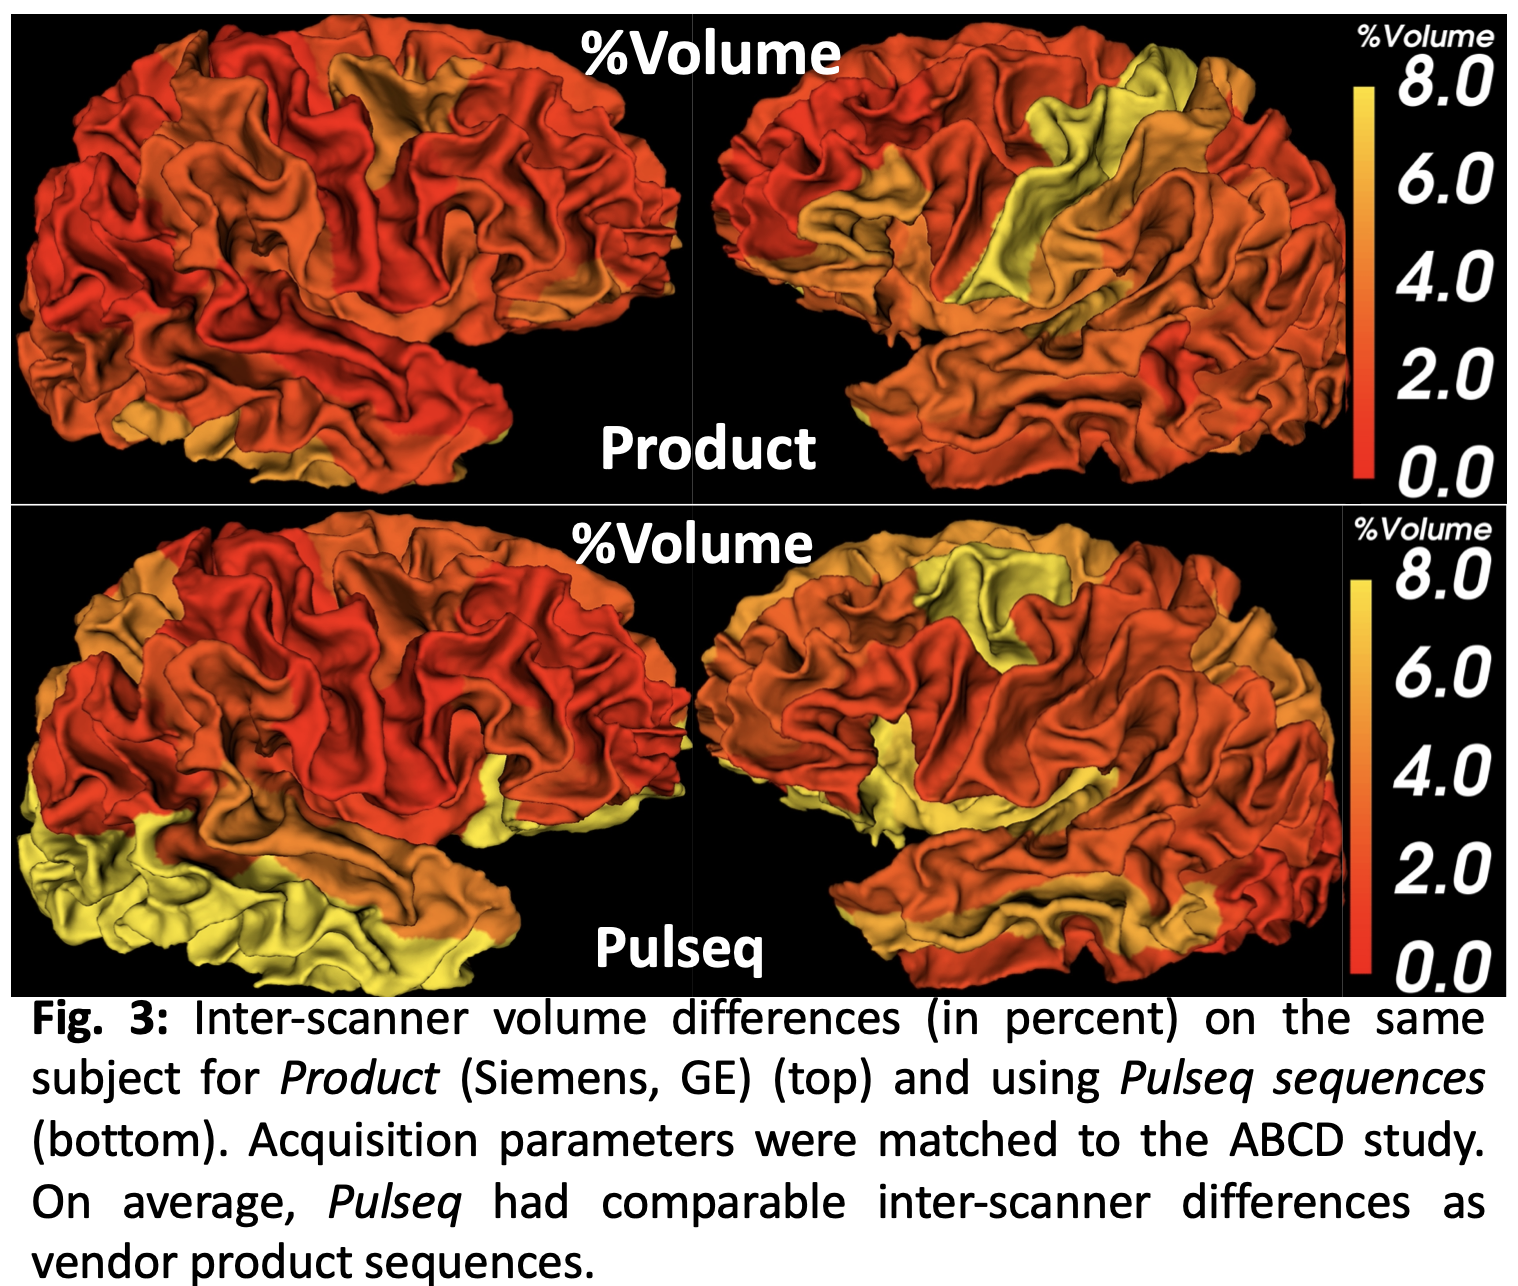
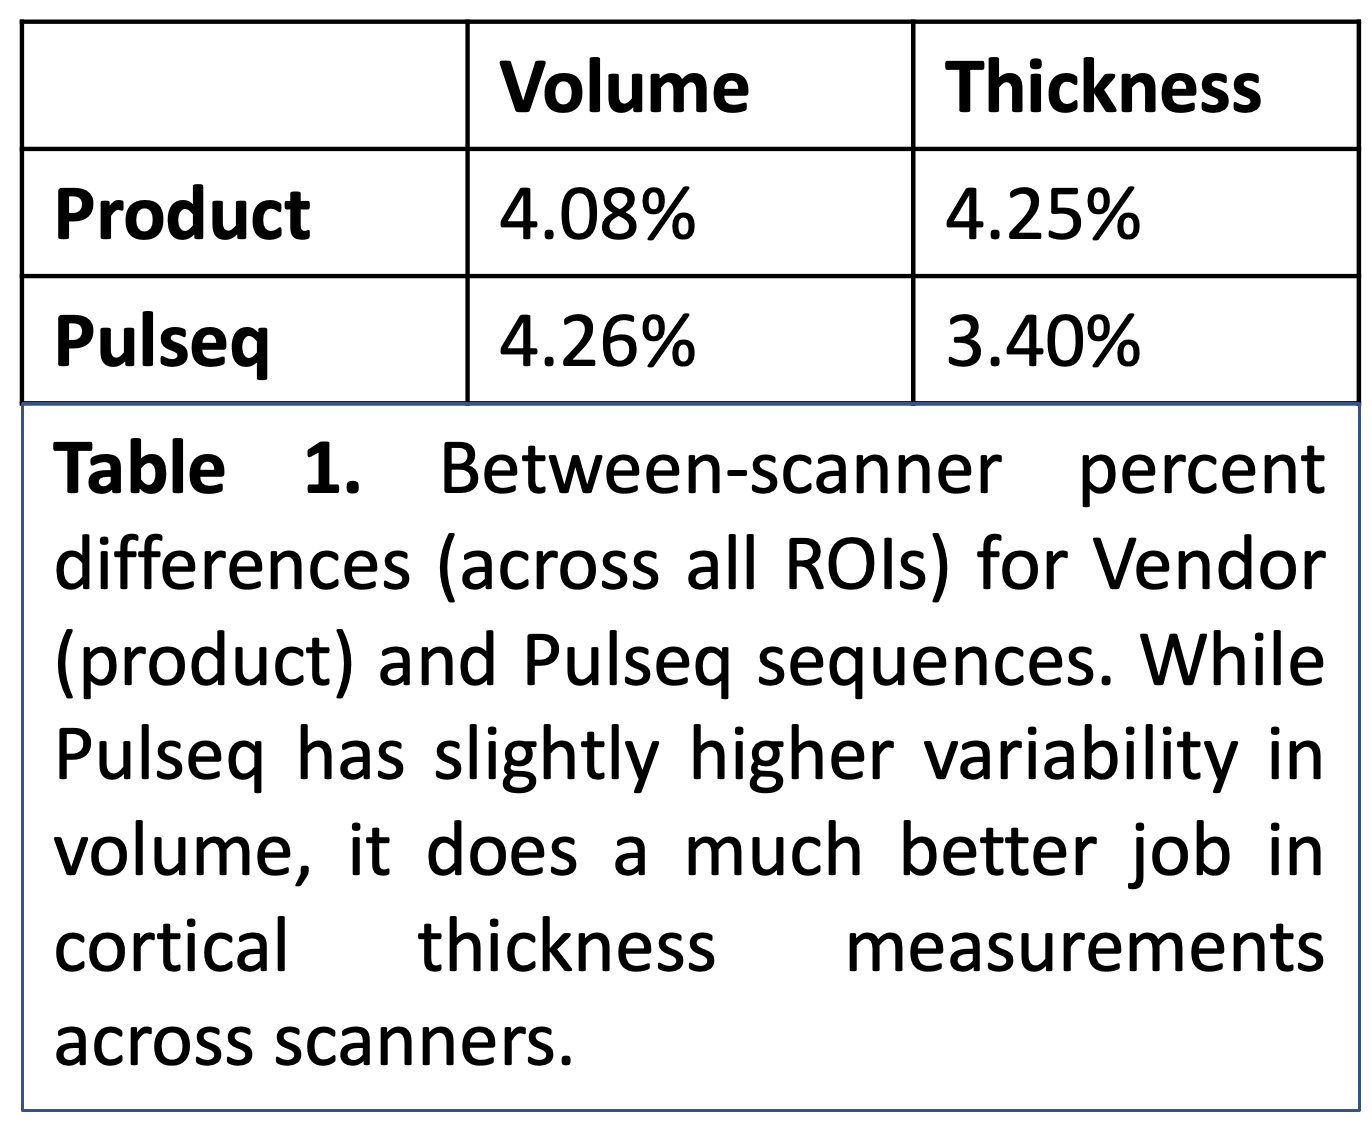
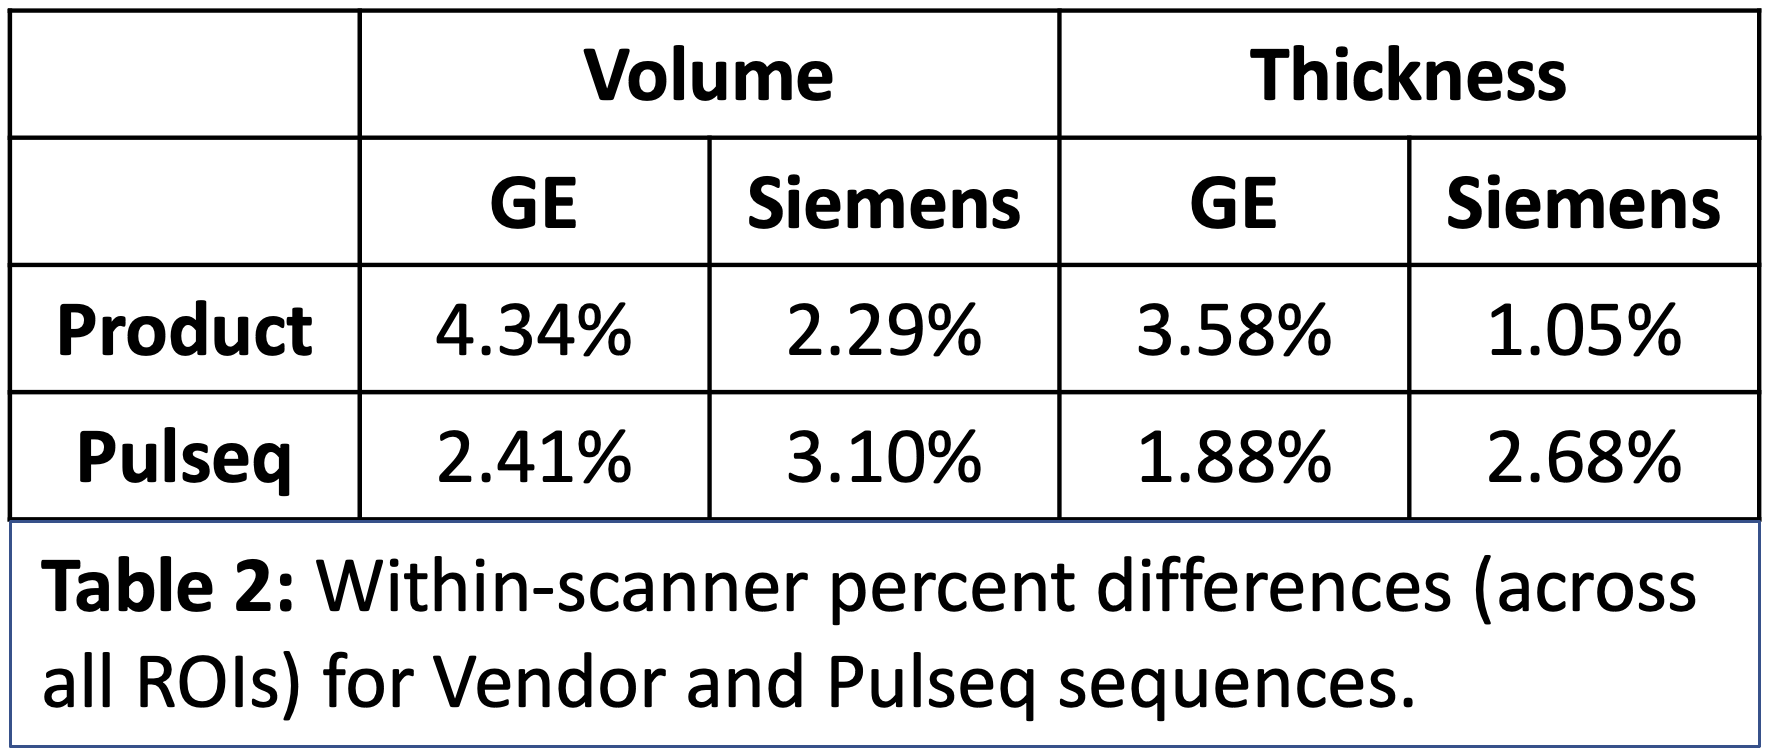
Across the whole brain, inter-scanner differences for Pulseq and Product sequences are given in Table 1. Further, percent differences in each individual ROIs for thickness and volume are shown in Figures 2 and 3. As is evident from Table 1, Pulseq reduces inter-scanner variability in thickness, while providing comparable results for volumetric estimations. Within-scanner variability for vendor and Pulseq sequences are given in Table 2. As can be seen, the Pulseq data shows lower within-scanner variability for GE but is slightly higher for Siemens scanner. We note that these results are preliminary with N=1 subject and future work entails testing the proposed setup across different sites and more subjects. We also note that manual (or automated) masking adds variability to the results, and so does Freesurfer. Further, differences in the software used to correct gradient non-linearity (Freesurfer Vs. GE) could have contributed to the increased inter-scanner variability seen in volumes in the Pulseq data.Acknowledgements
We acknowledge our funding sources (NIH).References
1. Casey BJ, Cannonier T, Conley MI, Cohen AO, Barch DM, Heitzeg MM, et al. The Adolescent Brain Cognitive Development (ABCD) study: Imaging acquisition across 21 sites. Dev Cogn Neurosci. 2018;32: 43–54.
2. Layton KJ, Kroboth S, Jia F, Littin S, Yu H, Leupold J, et al. Pulseq: A rapid and hardware-independent pulse sequence prototyping framework. Magn Reson Med. 2017;77: 1544–1552.
3. Nielsen J-F, Noll DC. TOPPE: A framework for rapid prototyping of MR pulse sequences. Magn Reson Med. 2018;79: 3128–3134.
4. Griswold MA, Jakob PM, Heidemann RM, Nittka M, Jellus V, Wang J, et al. Generalized autocalibrating partially parallel acquisitions (GRAPPA). Magn Reson Med. 2002;47: 1202–1210.
5. Uecker M, Lai P, Murphy MJ, Virtue P, Elad M, Pauly JM, et al. ESPIRiT--an eigenvalue approach to autocalibrating parallel MRI: where SENSE meets GRAPPA. Magn Reson Med. 2014;71: 990–1001.
6. Fischl B. FreeSurfer. Neuroimage. 2012;62: 774–781.
Figures