1614
SNR Enhancement of MR Images with Variable Compress Sensed Excitation: vNEX1GE Healthcare, Bangalore, India
Synopsis
MR imaging is signal starve leading to long acquisition time. Multiple averaging/excitation is most common way to boost the SNR. However, it is associated with proportionately long scan time. This abstract presents Variable Compress Sensed Excitation (vNEX) image acquisition and image reconstruction technique which subsample each signal average by compressed sensing fast MRI technique and robust image reconstruction is done to reconstruct MRI images for individual signal averages. The proposed technique is demonstrated for T2w brain MRI where SNR equivalence of 336sec scan time is shown in a 200sec vNEX MRI. Three sampling patterns were proposed and statistically compared.
PURPOSE
To improve the SNR of the MRI while reducing the scan time associated with multiple excitations/averaging.INTRODUCTION
Signal to noise ratio (SNR) is an important indicator of image quality of the MR. The most common way to improve SNR is to increase the number of excitations/averaging (NEX) which leads to proportionate increase in scan times with increased motion artifacts [1, 2]. In this abstract, the increased scan time is mitigated by reducing the scan time of each excitation with the use of compressed sensing [3]. The combined k-space sampling across the averages has variable k-space averaging which is closer to SNR optimal k-space averaging with variable k-space averaging mimicking the power distribution of image in k-space [4]. The compressed sensing reconstruction further improves the SNR of individual images prior to averaging, leading to an improvement in the final image SNR [3]METHODS
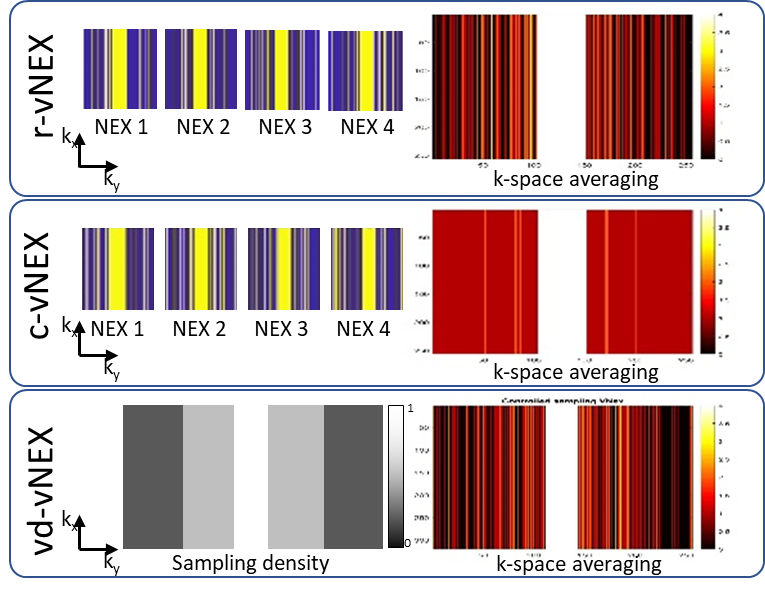
The proposed technique composed of novel data acquisition strategy and novel image reconstruction workflow.Data Sampling: The proposed technique acquires different k-space locations for different signal excitations. Three different sampling schemes were tested in this abstract.
- Random vNEX (r-vNEX): each signal excitation is independently and uniformly randomly subsampled.
- Complementary vNEX (c-vNEX): each signal excitation is independently and uniformly subsampled such that each k-space location is acquired at-least once across all the excitations.
- Variable density NEX (vd-vNEX): A sampling density across the phase encode direction is defined, and each signal excitation is independently and subsampled as per the prescribed sampling density.
Image Reconstruction: Compressed sensing reconstruction was done for each individual excitation [3]. The combined k-space averaged image across all the excitations was used as initialization for compressed sensing algorithm to improve the robustness to artifacts and poor SNR of a signal excitation data.
Volunteer scanning: A Healthy subject was scanned using the IRB approved protocol with informed consent on a commercially released 1.5T MRI scanner. The commercial fast spin echo sequence with multiple excitations and compressed sensing acceleration was modified for the proposed technique. A fully sampled T2w MRI with NEX=2 and three prospectively subsampled k-space as per the three sampling patterns, as shown in Figure 1 is acquired with NEX=4 and compressed sensing factor of 1.5.
Atlas (ICBM 2009a Nonlinear Symmetric [5]) based registration was done to create the mask for the brain in the MRI volume [6]. The brain signal, noise (from subtraction of first two signal averages) and SSIM is computed over the masked brain to improve the clinical relevance of these number. SSIM of vNEX images were computed with fully sampled T2w MRI for each slice and Student’s paired t-test with most aggressive Bonferroni correction. p-value <0.01 is used for statistical significance.
RESULTS
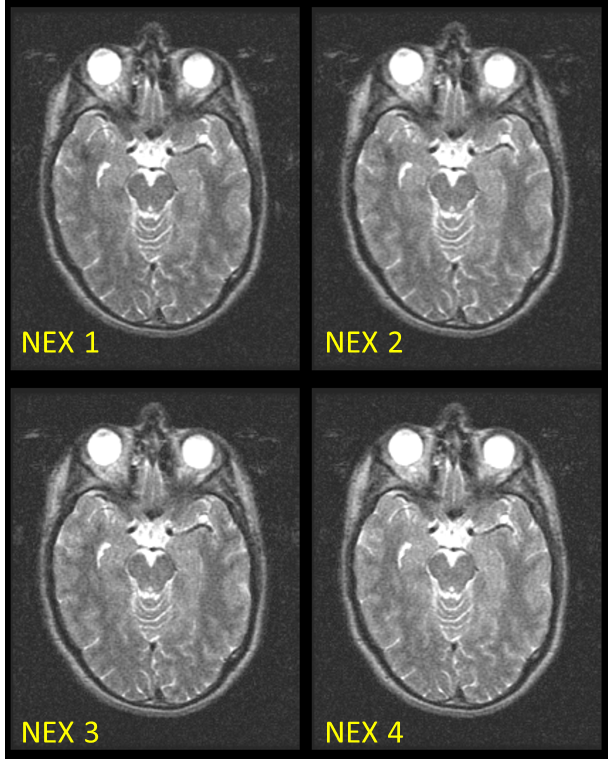
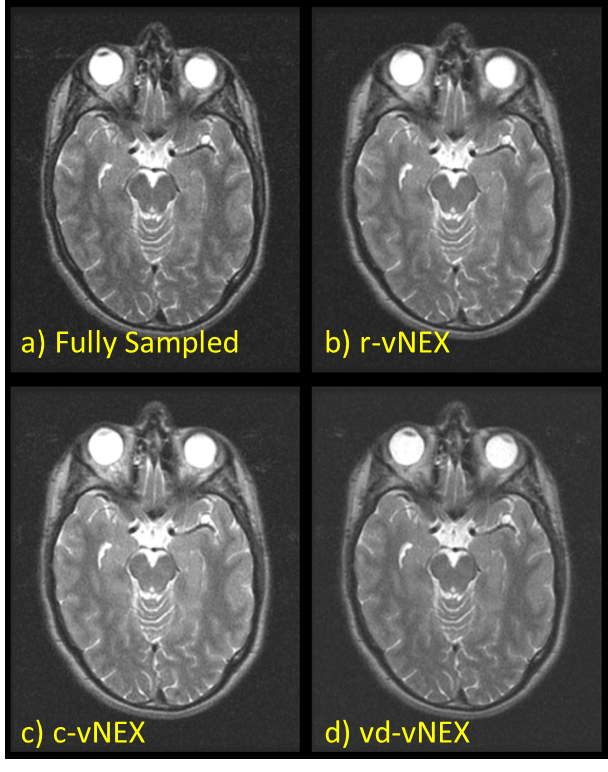
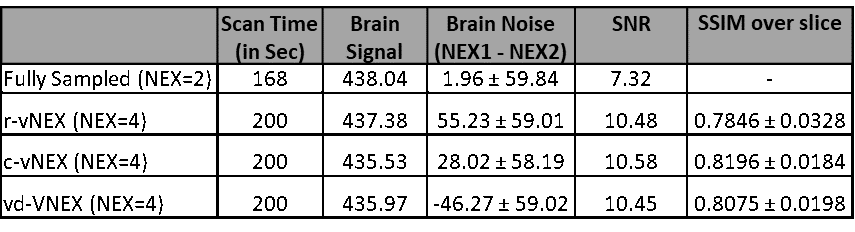
The MRI images from individual excitations for c-vNEX is shown in Figure 2. Figure 3 shows the final reconstructed MR images from fully sampled and three vNEX subsampling schemes. Table 1 shows the quantitative comparison of the three vNEX sampling schemes with the fully sampled data acquisition. SSIM of three vNEX subsampling is statistically different from each other with highest SSIM for c-vNEX subsampling pattern.DISCUSSION
The proposed technique reduced the scan time of the NEX=4 MRI from 336sec to 200sec with compressed sensing (R-1.5) subsampling of individual image excitations. The SNR provided by the proposed vNEX technique was equivalent to the NEX=4 fully sampled MRI, as seen from the extension of the observed scan time and SNR numbers of fully sampled (NEX=2) and vNEX subsampled MRI in Table 1.The usage of the combined k-space as initialization could have improved the robustness of the low SNR individual NEX image reconstruction. Qualitatively, Individual excitation MRI images were noisy, and their SNR improved by signal averaging. The three vNEX sampling patterns accessed in this abstract had similar SNR, however c-vVEX had statistically significant better SSIM over brain compared to other sampling patterns.
CONCLUSION
This abstract presents a novel method to boost the SNR of the MRI image with signal averaging without the time penalty associated with the multiple averaging. The reduction in scan time from 336sec (for NEX-=4) to 200sec for T2w Brian MRI is shown in a volunteer study. Complementary-vNEX sampling pattern have shown better performance compared to other sampling patterns. However, further study over larger patient population and multiple contrast types is warranted to assess the clinical significance of the proposed technique.Acknowledgements
No acknowledgement found.References
[1] Bernstein, M.A., King, K.F. and Zhou, X.J., 2004. Handbook of MRI pulse sequences. Elsevier.
[2] Brown, R.W., Cheng, Y.C.N., Haacke, E.M., Thompson, M.R. and Venkatesan, R., 2014. Magnetic resonance imaging: physical principles and sequence design. John Wiley & Sons.
[3] Lustig, M., Donoho, D.L., Santos, J.M. and Pauly, J.M., 2008. Compressed sensing MRI. IEEE signal processing magazine, 25(2), pp.72-82.
[4] Zijlstra, F., Viergever, M.A. and Seevinck, P.R., 2016. Evaluation of variable density and data-driven k-space undersampling for compressed sensing magnetic resonance imaging. Investigative radiology, 51(6), pp.410-419.
[5] Fonov, V., Evans, A.C., Botteron, K., Almli, C.R., McKinstry, R.C., Collins, D.L. and Brain Development Cooperative Group, 2011. Unbiased average age-appropriate atlases for pediatric studies. Neuroimage, 54(1), pp.313-327.
[6] Avants, B.B., Tustison, N. and Song, G., 2009. Advanced normalization tools (ANTS). Insight j, 2(365), pp.1-35
Figures