1613
Evaluation of 3D SPARKLING readout for Sodium UTE MRI at ultra-high magnetic field1NeuroSpin, Joliot, CEA, CNRS, University Paris-Saclay, Gif-sur-Yvette, France, 2Inria, Parietal, Université Paris-Saclay, Palaiseau, France, 3University Hospital Centre Poitiers, DACTIM-MIS, Poitiers, France, 4Siemens Healthcare SAS, Saint-Denis, France
Synopsis
Quantitative 23Na MRI provides useful information about brain tissue homeostasis. Most sequences use deterministic non-Cartesian 3D trajectories such as TPI. However, stochastic strategies such as SPARKLING could improve the coverage of k-space. This study evaluates the advantages of SPARKLING versus TPI. From in vivo datasets at 7T, we determined that undersampled SPARKLING acquisitions outperform TPI for (8 mm)3 resolution with a birdcage coil or for (4 mm)3 with a 32-channel coil. Through extrapolation of these results, we predict that at 11.7T/32-channel, 23Na MRI data could be acquired in 90s at (3 mm)3, which could be interesting for sodium fMRI imaging.
Introduction
Sodium (23Na) MRI in the human brain provides unique information about physiology in vivo. Several studies confirmed the relevance of assessing total sodium concentration in different neurological diseases such as Alzheimers1 and Multiple Sclerosis2. Current studies use ultra-short echo time (UTE) sequences combined with deterministic non-Cartesian k-space trajectories such as radial, TPI3 or FLORET4. Still, acquisition times (TA) remains relatively long even at high magnetic field due to the moderate intrinsic NMR sensitivity of sodium and its low concentration. Although more efficient than Cartesian trajectories, these standard non-Cartesian readouts do not fully cover the k-space as they are analytically and thus geometrically constrained. Therefore, we assume that X-nuclei MRI in general and 23Na MRI acquisitions in particular could benefit from optimization-driven compressed-sensing (CS) approaches5 like SPARKLING6,7 that end up with (i) global variable density sampling but (ii) locally uniform coverage of k-space. As preliminary shown in SWI, this approach is good candidate to to shorten the TA without degrading image quality in 23Na MRI. Determination of scenarios of interest is not trivial because CS performance depends on signal-to-noise ratio (SNR) and image sizes8. In this study, our goal is to identify the best combination of undersampling and input SNR (i.e. voxel size) for which SPARKLING outperforms TPI.Material and Methods
For both in vivo and in vitro, 3D radial UTE at (8 mm)3 with a number of shots (Ns$$$=4\pi(k_{max}FOV)^2$$$) chosen to meet Nyquist criteria9 and a number of 32 averages (NA) were used as reference image for our simulations. This study explores different acceleration factors ($$$\textit{AF}=\dfrac{N_s\textit{radial full nyquist}}{N_s\textit{current acquisition} }$$$) and resolutions and focus on a fixed set of parameters: TR/TE=20/0.5 ms, FA=55°, FOV = (240 mm)3, dwell time = 10 us, 1248 points, which has previously been optimized for in vivo 23Na MRI acquisition10.MRI data were acquired on Magnetom or Terra 7T MR Siemens scanners (Siemens Healthineers) using respectively a dual-resonance 1H/23Na birdcage or a 32-channel coil (Rapid Biomedical).
Input SNR per spoke was measured from these experiments. Gaussian noise was added to the reference complex k-space data to simulate the performances of SPARKLING and TPI strategies (Fig.1) at lower input SNR. For each considered input SNR, k-space was subsampled at various AF (2, 4, 16, 32, 64, 128).
Images were reconstructed CS reconstruction with density compensation11 using Pysap-MRI12-13, which handles large 3D non-Cartesian multichannel datasets. For each reconstruction, the regularization parameter6 (lambda) was chosen visually in the 10-7 to 10-20 range (30 steps) to maximize image quality.
The metric chosen for comparison was the SSIM14 score which attempts to model and mimic the human visual system.
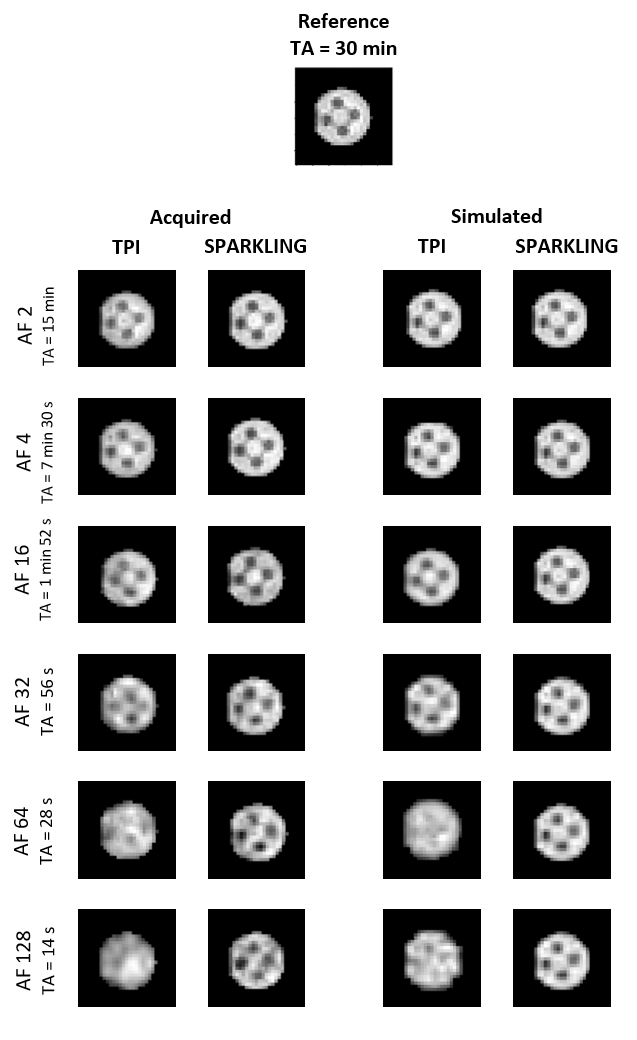
In order to validate our simulations, in vitro sodium images of a homemade phantom were acquired using both TPI and SPARKLING sampling schemes using the same acquisition parameters for a resolution of (8 mm)3 and NA=32. Separate datasets were acquired at AF=2, 4, 16, 32, 64, 128.
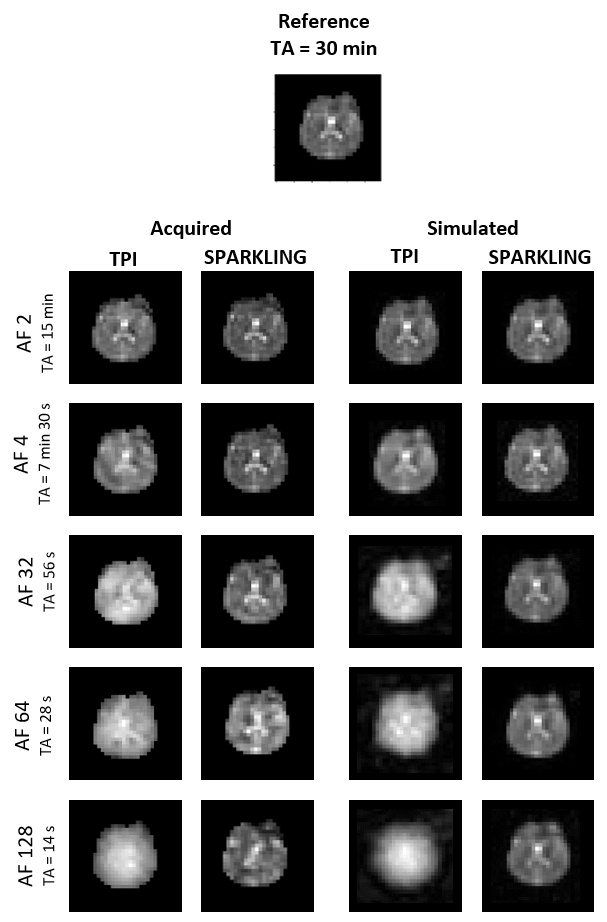
Once our simulations were validated in vitro (Fig.2), in vivo 23Na MRI datasets were acquired in one human volunteer at AF=2, 4, 32, 64, 128. Resolution and NA were set to match SNR used successfully in the simulations while keeping the total examination time below 60 minutes.
In vivo 23Na images acquired with the 32-channel coil exhibited an improved SNR compared to the birdcage coil. Input SNR expected at 9.4 and 11.7T were extrapolated considering the relationship $$$\dfrac{SNR_ {target}}{SNR_{7T}}=\left(\dfrac{B_0}{7}\right)^{1.65}$$$15.
Results
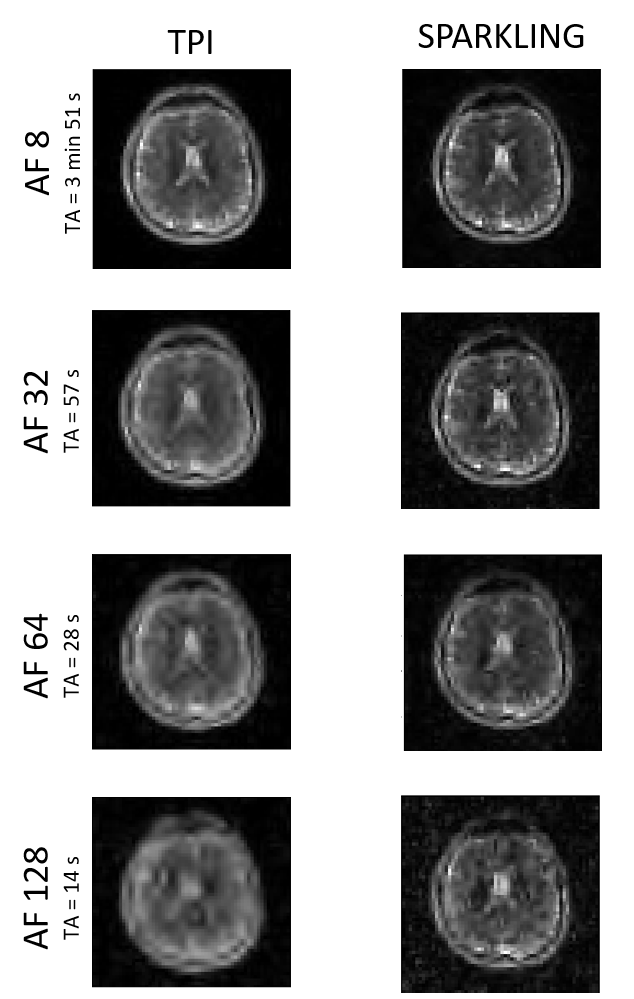
Figure 2 plots the SSIM scores obtained for each AF and shows a fair agreement between the simulations and phantom data. Figures 3 and 4 display respectively our in vitro and in vivo experimental data along the corresponding simulations. SPARKLING outperform TPI for 23Na MRI data acquired at (8 mm)3 resolution especially for larger AF. In particular, we could obtain similar image qualities for TPI at AF=2 and SPARKLING at AF=32 thus 16-fold faster acquisition. Figure 5 shows the comparison between TPI and SPARKLING at (4 mm)3 resolution with a 32-channel coil showing similar results for TPI at AF=8 and SPARKLING at AF=32.Discussion
As illustrated, we obtained an overall good agreement between our experimental and simulated results. Residual differences could be attributed to slight differences in the point-spread-functions, in particular due to T2*-weighting. SSIM is known to be is weakly sensitive to blurring16. In both in vitro and in vivo results, SPARKLING results resist to higher acceleration factors compared to TPI images. However, a minimum input SNR value has to be reached to see this effect. For lower magnetic fields or coils sensitivity, TPI as well as other deterministic k-space non-Cartesian trajectories stay relevant.Conclusion
At 7T with a birdcage coil, center-out 3D SPARKLING undersealing scheme outperforms TPI for 23Na MRI at (8 mm)3 resolution. This advantage is particularly predominant for AF>8. At 7T with a 32-channel coil for a (4 mm)3 resolution, 32-fold accelerated SPARKLING provides similar results to 8-fold accelerated TPI. Based on our simulation extrapolating the input SNR for 23Na MRI at 11.7T, we expect to acquire dynamic sodium MRI within 90 seconds with a (3 mm)3 resolution, which could be of interest to revisit sodium changes during neuronal activation as proposed by Bydder et al17.Acknowledgements
This work received financial support from Leducq Foundation (large equipment ERPT program, NEUROVASC7T project. Chaithya G R was supported by the CEA NUMERICS program, which has received funding from the European Union's Horizon 2020 research and innovation program under the Marie Sklodowska-Curie grant agreement No 800945. This work was granted access to the HPC resources of IDRIS under the allocation 2021-AD011011153 made by GENCI.References
- Haeger et al., Quantitative sodium imaging using ultra-high field magnetic resonance imaging in patients with Alzheimer's disease, Alzheimer's & Dementia, 2020
- Eisele et al., Temporal evolution of acute multiple sclerosis lesions on serial sodium (23Na) MRI, Multiple Sclerosis and Related Disorders, 2019
- Boada et al., Fast three dimensional sodium imaging, MRM. 1997.
- Robisonet al., Three-dimensional ultrashort echo-time imaging using a FLORET trajectory. Magn Reson Med. 2017 Sep;78(3):1038-1049. doi: 10.1002/mrm.26500. Epub 2016 Oct 24. PMID: 27775843.
- Lustig et al., Sparse MRI: The application of compressed sensing for rapid MR imaging,” Magn. Reson. Med., vol. 58, no. 6, pp. 1182–1195, 200
- Lazarus et al., SPARKLING: variable-density k-space filling curves for accelerated T2*-weighted MRI, MRM, 2019
- Chaithya G R et al., Optimizing full 3D SPARKLING trajectories for high-resolution T2*-weighted Magnetic Resonance Imaging. 2020. https://hal.inria.fr/hal-03090471
- Lazarus et al., “An empirical study of the maximum degree of undersampling in compressed sensing for T2*-weighted MRI”. Magnetic resonance imaging. 2018 Nov 1;53:112-22.
- Handbook of MRI Pulse Sequences edited by Bernstein, Matt A., King, Kevin F., and Zhou, Xiaohong Joe. Burlington, MA, Elsevier Academic Press, ISBN:0-12-092861-2, 1017 pp.
- Coste et al., Tissue sodium concentration and sodium T1 mapping of the human brain at 3 T using a Variable Flip Angle method, MRI, 2019.
- Pipe et al., Sampling density compensation in MRI: rationale and an iterative numerical solution, MRM, 1999.
- Farrens et al., “PySAP: Python Sparse Data Analysis Package for multidisciplinary image processing”. Astronomy and Computing. 2020 Jul 1;32:100402.
- El Gueddari et al., PySAP-MRI: a Python Package for MR Image Reconstruction. ISMRM workshop on Data Sampling and Image Reconstruction, Jan 2020, Sedona, AZ, United States.
- Wang et al., "Image quality assessment: From error visibility to structural similarity," IEEE Transactions on Image Processing, vol. 13, no. 4, pp. 600-612, avril 2004.
- Pohmann et al., Signal-to-noise ratio and MR tissue parameters in human brain imaging at 3, 7, and 9.4 tesla using current receive coil arrays, MRM, 2015.
- M. Punga et al., AIP Conference Proceedings 2014, 1634(1): 137-143
- Bydder M et al., Dynamic 23Na MRI - A non-invasive window on neuroglial-vascular mechanisms underlying brain function. Neuroimage. 2019
Figures
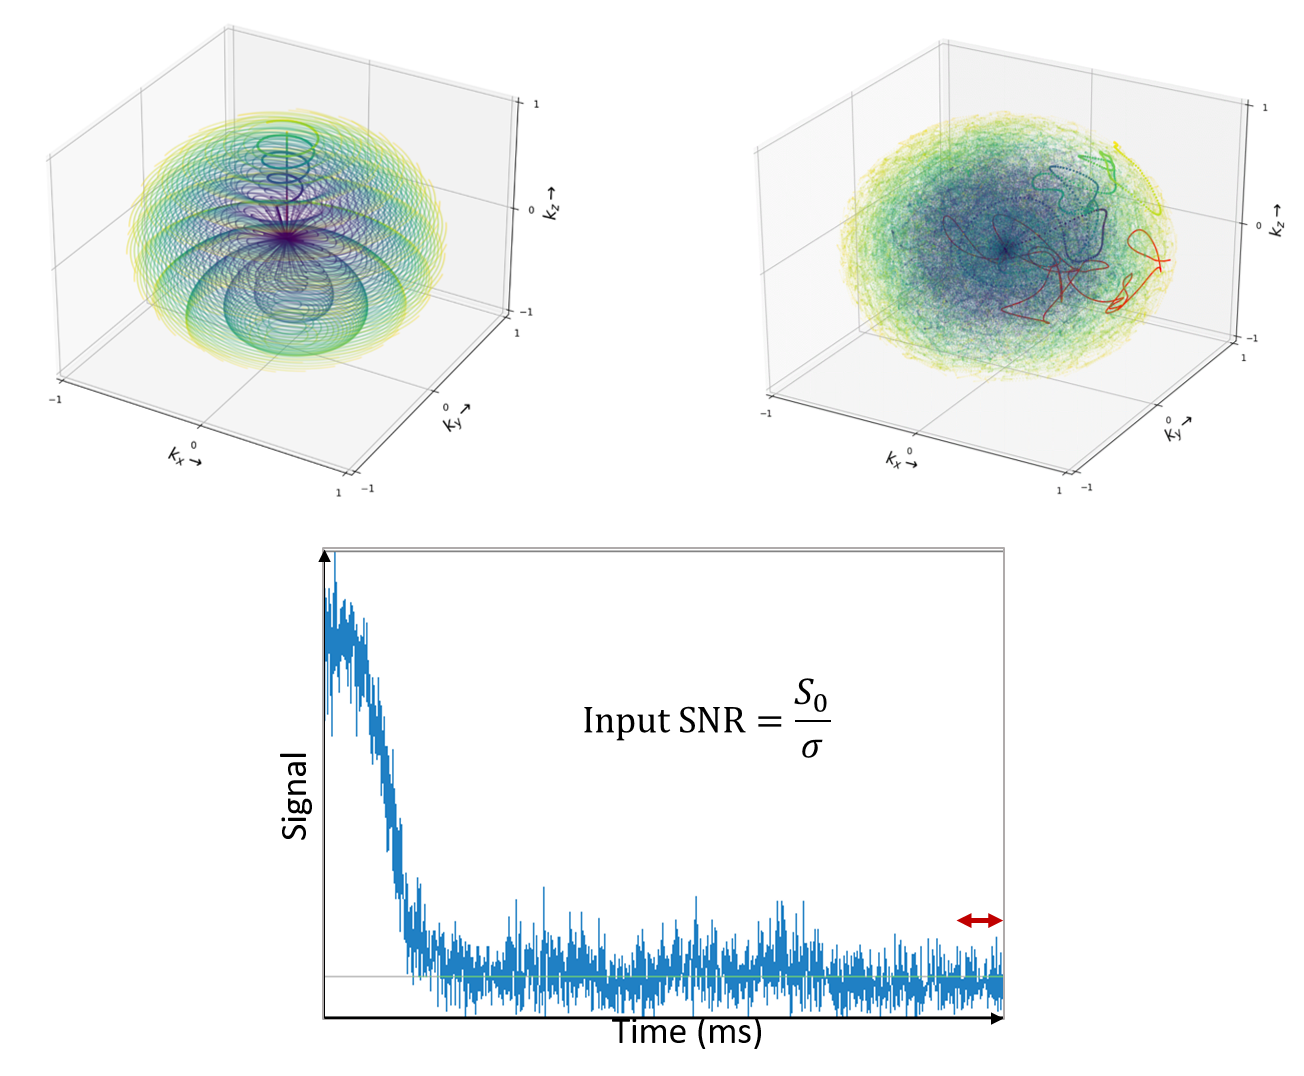
Figure 1 In top left, TPI illustration trajectory. In top right, SPARKLING center out trajectory. Color blue represents begging of trajectory and color yellow the end. Each spoke, both on TPI and Sparkling are acquired over the same Tobs= 12.48 ms. Down, example of signal in a spoke and how input SNR was calculated by spoke, σ was estimate as the variance in last points (N=10) acquired.
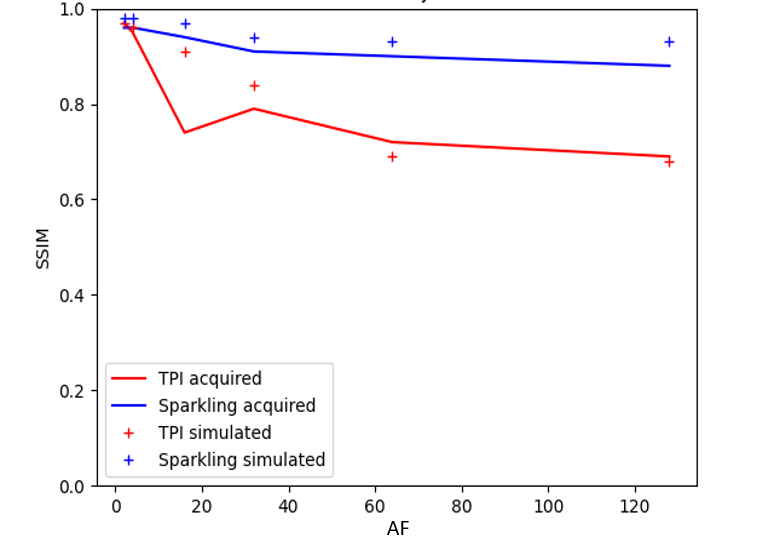
Figure 2: Comparison between TPI and SPARKLING SSIM scores with acceleration factors of 2, 4, 16, 32, 64 and 128 on phantom, with a spatial resolution of (8 mm)3 and same input SNR per spoke.