1609
Pitfalls of data-driven tSNR optimized coil combination for fMRI
Redouane Jamil1, Franck Mauconduit1, Caroline Le Ster1, Philipp Ehses2, Benedikt A Poser3, Alexandre Vignaud1, and Nicolas Boulant1
1CEA, CNRS, BAOBAB, NeuroSpin, Gif-sur-Yvette, France, France, 2German Center for Neurodegenerative Diseases (DZNE), Bonn, Germany, 3Department of Cognitive Neuroscience, Maastricht Brain Imaging Centre, Faculty of Psychology and Neuroscience, Maastricht University, Maastricht, Netherlands
1CEA, CNRS, BAOBAB, NeuroSpin, Gif-sur-Yvette, France, France, 2German Center for Neurodegenerative Diseases (DZNE), Bonn, Germany, 3Department of Cognitive Neuroscience, Maastricht Brain Imaging Centre, Faculty of Psychology and Neuroscience, Maastricht University, Maastricht, Netherlands
Synopsis
For MRI with a multi-receiver RF coil, one image per coil element and per time frame is obtained. The final image is typically calculated from the root sum of squares (rSoS) combination across channels. While this combination approach is quasi-optimal for SNR, it is not necessarily optimal for temporal SNR (tSNR) of the time-series. We present two analytical and voxel-wise coil combination expressions reaching optimality in tSNR and t-score for the mean (TSM) respectively. Their BOLD sensitivity is compared to the gold standard covariance root sum of squares. Both improved tSNR and TSM but yielded weaker t-scores than covSoS.
Introduction
State of the art RF coils are composed of multiple receiving channels. One image per channel is reconstructed and the final image is typically calculated from the root sum of squares of the sub-images (rSoS). A pre-whitening can be done at this stage by inserting the inverse of the noise covariance matrix measured from prescans (covSoS). This combination is quasi-optimal in SNR1 but in functional MRI, the relevant measure is stability over time, making tSNR the preferred metric. An alternative tSNR optimal coil combination has been proposed by Huber et al.2 (STARC) but uses a cumbersome and time-consuming voxel-wise gradient descent algorithm yielding an optimized weighted sum. Here, we propose an analytical solution of the STARC problem and extend the method to propose another coil combination optimal in t-score for the mean3 (TSM) as alternatives to the covSoS. We compare their performance in terms of sensitivity to BOLD signal changes to the covSoS, across task-based fMRI experiments on four volunteers at 7T.Methods
In this work, we denote N and Nc the number of repetitions and receive channels respectively. For a given voxel, we denote \(I_{\text{STARC}} = AX_{\text{STARC}}\) the \(N × 1\) signal vector resulting from STARC combination with \(A\) the \(N × Nc\) matrix concatenating the magnitude signal time courses from all coils of the voxel and \(X_{\text{STARC}}\) a \(Nc × 1\) weighting vector to be optimized, independently for each voxel. The tSNR of a voxel is typically computed from the ratio of its temporal mean by its standard deviation. Therefore, the tSNR maximization problem can be recast into a minimization of the temporal standard deviation with a constraint on the temporal mean to be equal to a scalar \(b\). It is possible to express the temporal mean and standard deviation of the resulting signal vector with \(X_{\text{STARC}}\). The optimization problem turns out as a quadratic program under linear constraint whose solution satisfies the Karush-Kuhn-Tucker (KKT) conditions. Through the Lagrangian method, the solution is\(X_{\text{STARC}} = \frac{b\Psi_{t}^{- 1}u}{u'\Psi_{t}^{- 1}u}\) ,
with \(u\) the \(Nc × 1\) column wise (temporal) mean vector of \(A\) and \(\Psi_{t}\) the covariance matrix of \(A\). Since activations can be accounted for signal variations and reducing tSNR, the TSM has been introduced to ignore the effect of neural activity on the measure of signal stability. TSM is the ratio of the temporal mean and the standard deviation of the residual after the General Linear Model (GLM) fit. Starting from its expression and following the same method it is possible to derive a TSM optimal weighting vector
\(X_{\text{STARCtsm}} = \frac{b{\Psi_{\text{TSM}}}^{- 1}u_{\text{TSM}}}{u_{\text{TSM}}'{\Psi_{\text{TSM}}}^{- 1}u_{\text{TSM}}}\) ,
where \(u_{\text{TSM}} = c^{'}D^{+}A\) with \(D^{+}\) the pseudo inverse of the GLM design matrix \(D\), and \(c\) the contrast vector selecting the column of \(D\) estimating the mean of the signal and \({\Psi_{\text{TSM}}}^{- 1}\) the inverse of the covariance matrix of \((Id - DD^{+})A\) with \(Id\) the identity matrix. Since it uses prior information about activations via the design matrix, a regularization of this method is necessary to avoid double-dipping bias. Indeed, under the null hypothesis, the standard deviation of the distribution of t-scores should be equal to one which is not the case here. Regularization was performed by dividing the t-scores by a standard deviation estimation yielded by Monte Carlo simulations.In vivo experiments were performed on four volunteers at 7T (Magnetom, Siemens Healthineers, Erlangen, Germany) with a 3D-EPI sequence4 at 1.6mm isotropic resolution (TR/TE=1210/22ms, FOV=208mm, matrix=130×130×88, PF=7/8, GRAPPA 2x4, with CAIPIRINHA sampling, ∆kz=2, N=260) and in pTX mode with Universal pulses5 using the 8Tx-32Rx Nova head coil (Nova Medical, Wilmington, MA, USA). The same data were reconstructed with the covSoS, STARC and STARCtsm. The functional runs were performed using a functional localizer6 involving visual, auditory and motor tasks. Functional post processing was done on FSL and SPM including motion and distortion correction, normalization and smoothing.
Results
Figure 1 displays tSNR maps and distributions pooled over the 4 volunteers. STARC combination yielded the highest tSNR. Figure 2a displays an example of activation maps yielded by each coil combination. Figure 2b shows the total number of activations across motor, auditory and visual tasks pooled over the four volunteers. covSoS outperforms STARC and the double dipping corrected STARCtsm. Figure 3 shows STARC weights for two voxels, whereby channels with the highest strength (mean) are penalized compared to the weakest ones. In figure 4 we compare for a set of activated voxels (covSoS motor and auditory contrasts) the tSNR ratio STARC/covSoS versus the corresponding gain in t-score and the TSM ratio STARC/TSM versus the corresponding gain in t-score. We see that neither a gain in tSNR nor TSM guarantees a gain in t-score.Discussion and conclusion
These results suggest that data-driven tSNR optimization approaches might not always improve BOLD signal detection because signal variability also takes into account activation spikes. The TSM also measures signal stability but without taking into account activation spikes by using the GLM residual instead of the standard deviation of the signal. Nevertheless, it leads to double-dipping because the GLM is applied twice. Once the statistical bias is corrected, covSoS remains the optimal coil combination method in terms of t-scores, despite smaller tSNR.Acknowledgements
ERPT equipment program of the Leducq Foundation and FET-Open AROMA grant agreement n° 885876.References
[1] Larsson EG et al. J Magn Reson. 2003 Jul;163(1):121-3. [2] Huber et al. abstract #586 ISMRM 2017. [3] Corbin Net al. Hum Brain Mapp. 2018 Oct;39(10):3884-3897. [4] Poser BA et al. Neuroimage. 2010 May 15;51(1):261-6. [5] Gras V et al. Magn Reson Med. 2017 Feb;77(2):635-643. [6] Pinel P et al. BMC Neurosci. 2007 Oct 31;8:91.Figures
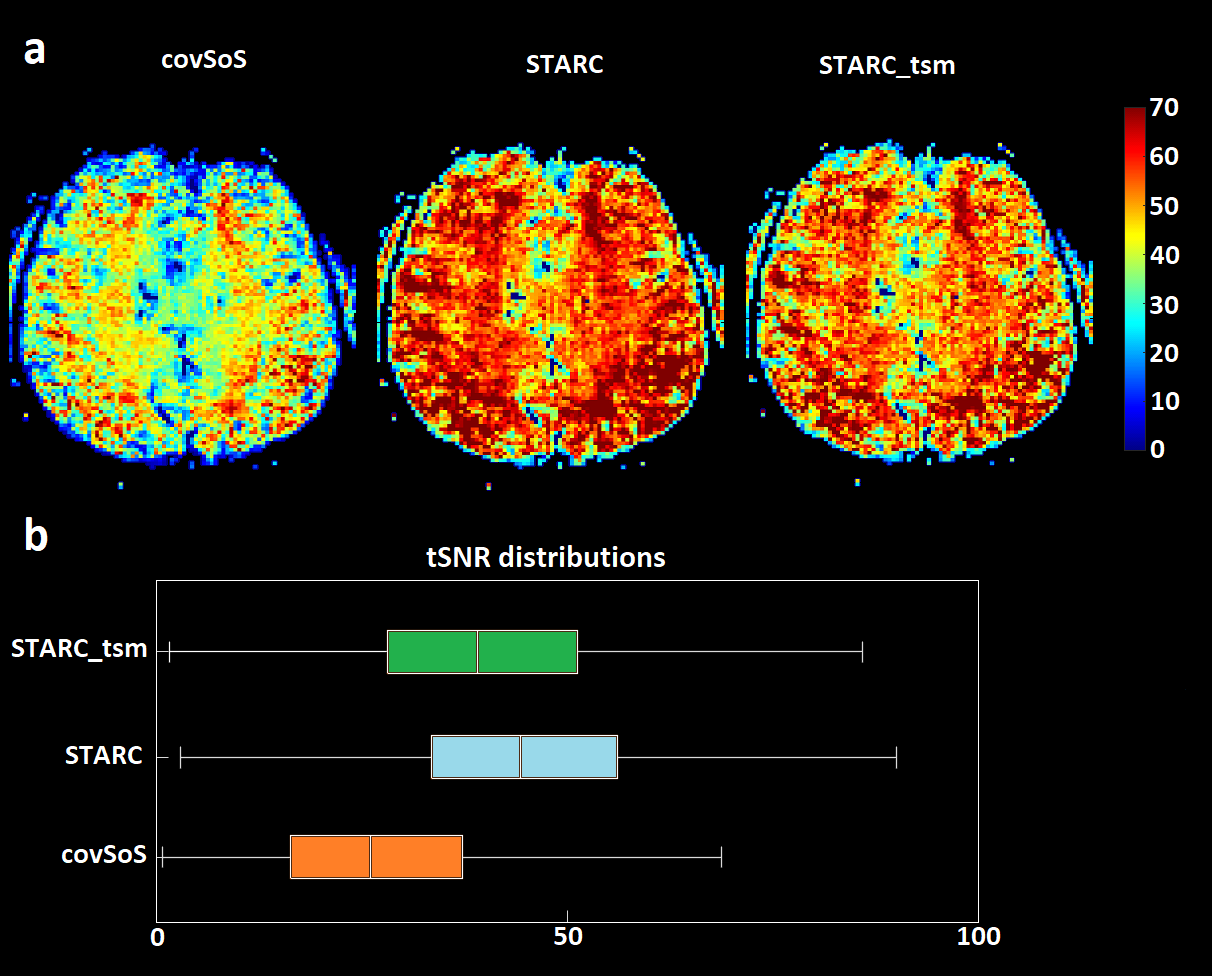
tSNR results. a – tSNR map
from the same raw data but combined with covSoS, STARC and STARCtsm. STARC
yields the highest tSNR with an improvement of 50% and more across multiple
regions. b – tSNR distributions pooled across the four volunteers for each RF
coil combination. A threshold mask was used to remove non brain voxels. STARC yields the highest tSNR.
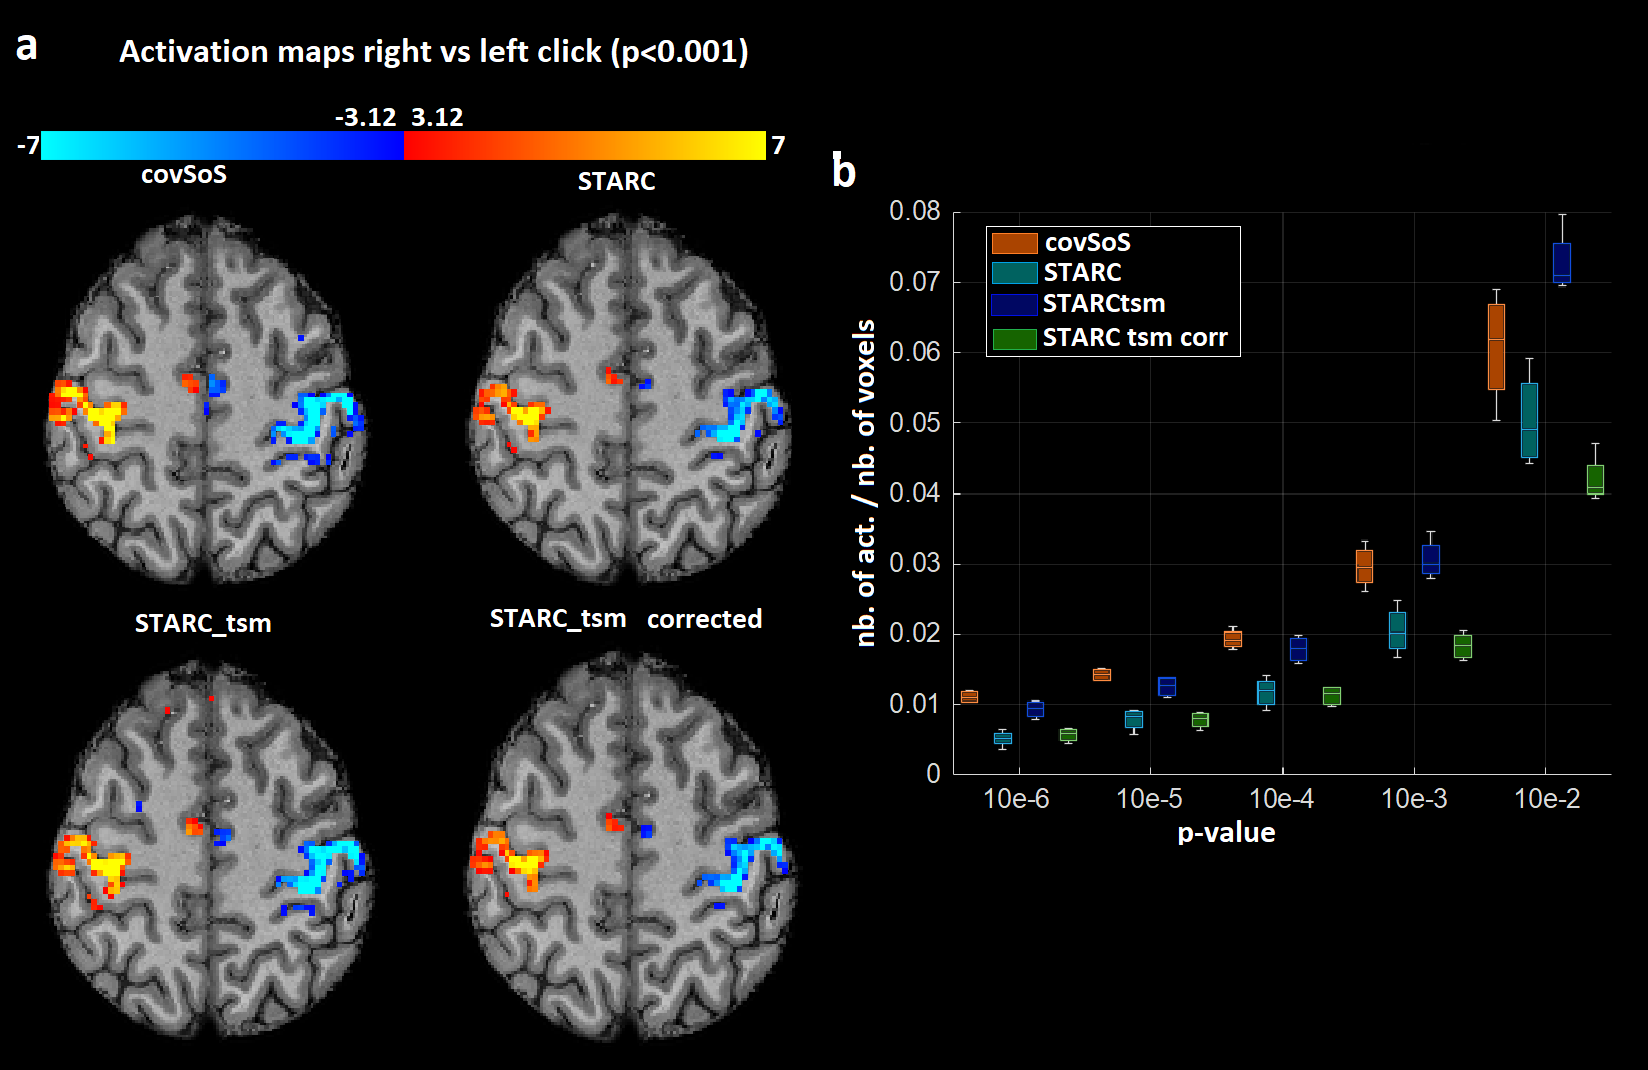
Activation results. a –
Activation maps for a motor contrast (p < 0.001 uncorrected) from covSoS,
STARC and STARCtsm with double dipping correction. b – Proportion of activated voxels for
visual, auditory and motor contrasts pooled on the four volunteers. Despite a
much better tSNR, STARC has weaker t-scores and thus less activations. STARCtsm
has comparable performance to covSoS but after double dipping correction it has
the weakest performance.
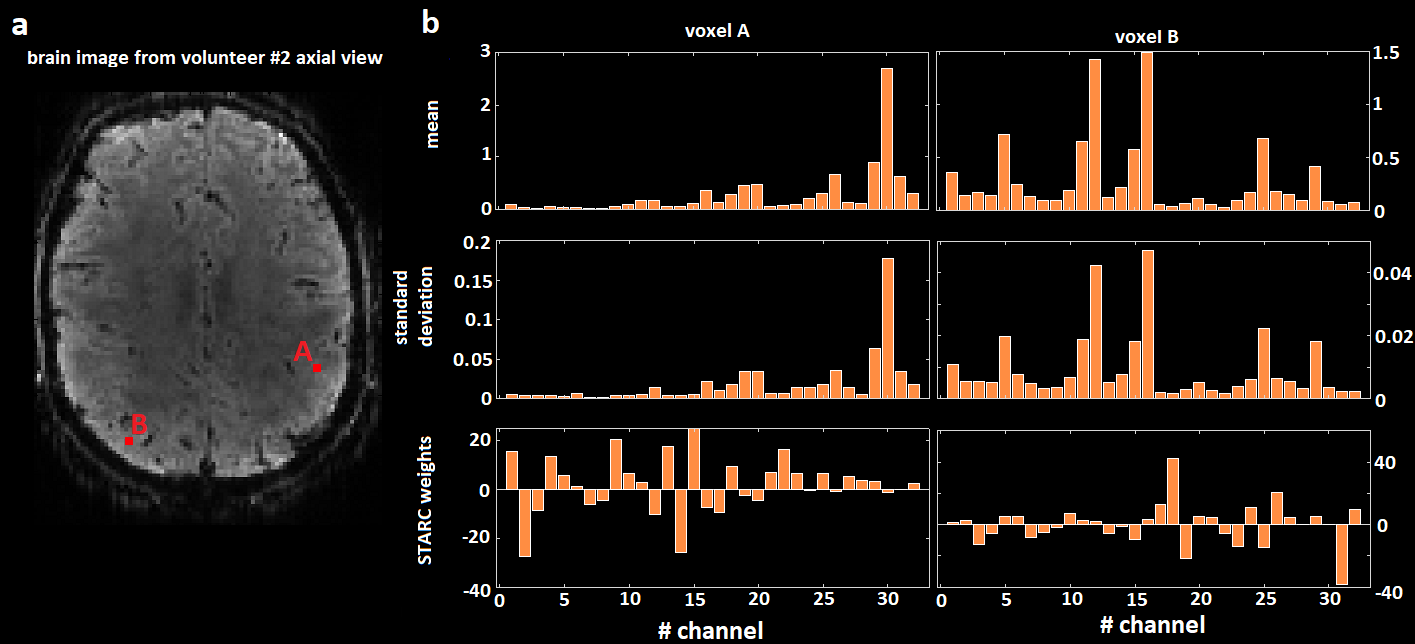
STARC weights for two voxels in grey matter. a – Brain image from volunteer #4, axial view. b – For
each voxel, bar plots of the mean, standard deviation of each receive channel
and STARC weights. Bar plots show that the stronger the signal the less stable it
is. Therefore STARC seems to penalize the strongest channels. Negative weights
suggest that the algorithm might subtract one signal to another to remove any
correlated variation and thus maximize stability but destroy potential activations.
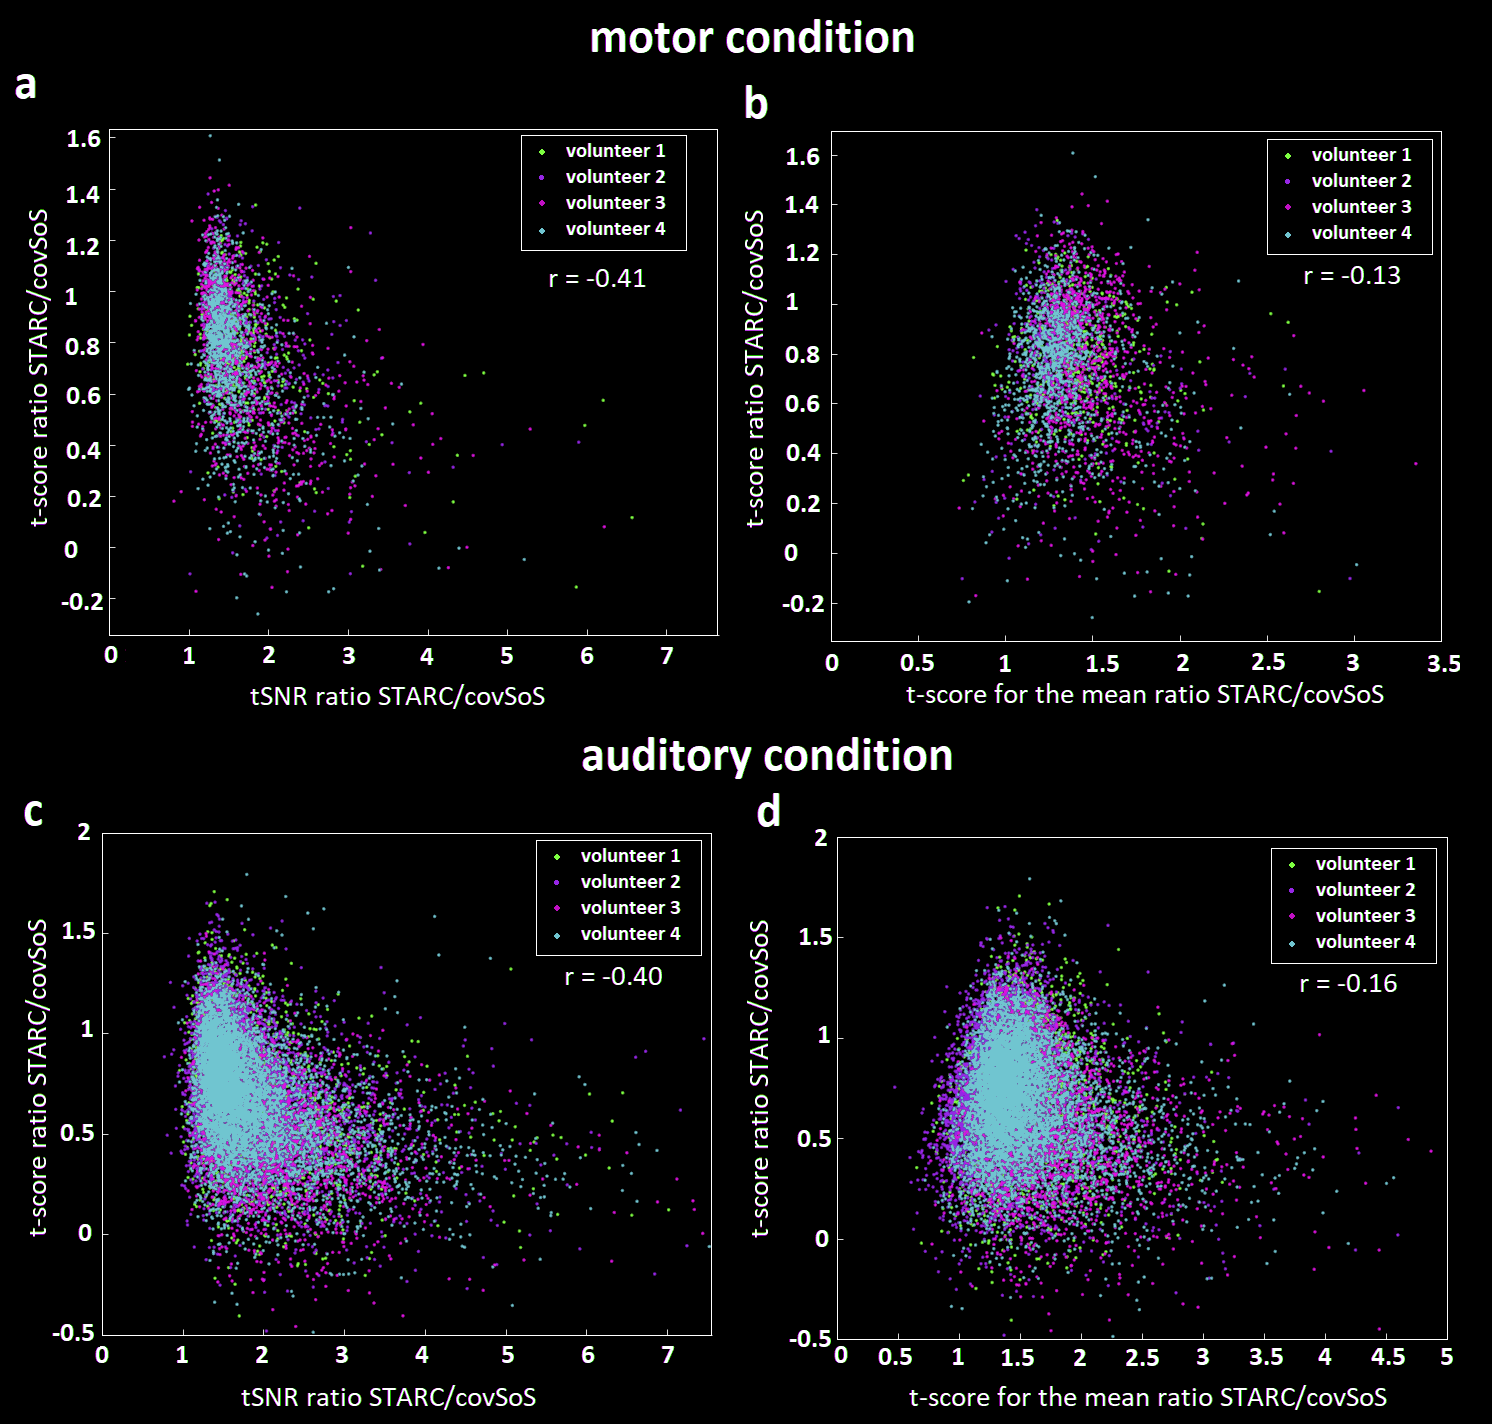
t-score gains
versus tSNR or t-score for the mean gains. a – Scatter plot of the tSNR gain
with STARC versus its t-score gain for motor contrast. b – Scatter plot of the
TSM gain with STARC to its t-score gain for motor contrast. c – Same plot than
a but with auditory contrast. d – Same plot than b but with auditory contrast.
Each point corresponds to an activated voxel (p<0.001) according to the
covSoS combination maps. In general, an increase of tSNR or TSM does not lead to an
increase in t-scores.
DOI: https://doi.org/10.58530/2022/1609