1607
Applying L+S decomposition to improve sensitivity to dynamic changes in functional MR spectroscopy
Adam Berrington1 and I. Betina Ip2
1Sir Peter Mansfield Imaging Centre, University of Nottingham, Nottingham, United Kingdom, 2Wellcome Centre for Integrative Neuroimaging, University of Oxford, Oxford, United Kingdom
1Sir Peter Mansfield Imaging Centre, University of Nottingham, Nottingham, United Kingdom, 2Wellcome Centre for Integrative Neuroimaging, University of Oxford, Oxford, United Kingdom
Synopsis
Functional MRS (fMRS) is a powerful technique to measure metabolite responses over time. However, noise and spectral contamination limit the ability to study individual metabolite time-courses. In this work, we propose to model fMRS spectra as a superposition of low-rank (L) and sparse components (S). L+S decomposition resulted in separation of temporally-correlated signal from noise in simulation. In vivo, L+S spectra had higher SNR compared to original data (P=0.007) and the mean glutamate time-course, using L+S spectra, was more strongly correlated to stimulus. L+S decomposition is a promising data-driven method to enhance sensitivity to dynamic changes in fMRS.
Introduction
Functional MRS (fMRS) can detect task-induced changes in metabolite concentrations, such as glutamate (Glu), lactate and GABA1–3. However, spectra are noise-limited and vary shot-to-shot, thus temporal responses are often analysed at group-level or over many averages. Low rank plus sparse (L+S) decomposition can extract variation from corrupted data by decomposing them into slow-varying, temporally-correlated (low-rank) plus uncorrelated (sparse) components4 and has been applied in MR, e.g. in cardiac motion5,6 and dynamic reconstruction7. In this work, we propose using an L+S approach to improve sensitivity to underlying signal changes in fMRS. We optimise the approach in simulation and then apply it in a real in vivo fMRS dataset.Theory
Spectral vectors of length $$$[N_p \times 1]$$$ from $$$N_t$$$ transients are concatenated into a $$$[N_p \times N_t]$$$ complex data matrix $$$M$$$, which is decomposed into a superposition of low-rank ($$$L$$$) plus sparse ($$$S$$$) components, such that $$$M = L+S$$$. Suitable $$$L$$$, $$$S$$$ matrices are found by solving4,$$ \min_{L,S} ||L||_{*} + \lambda ||S||_{1} \quad \textrm{s.t.} \quad M = L + S $$
where $$$||L||_{*}$$$ is the sum of singular values and $$$||S||_{1}$$$ is the $$$\ell^{1}$$$-norm. The regularization parameter, $$$\lambda$$$, controls the relative contribution of $$$S$$$ in the $$$L+S$$$ solution. We use an algorithmic solution to the above minimisation based on principle-component pursuit4, such that,
$$ \min_{L,S} \frac{1}{2} ||L+S-M||^{2}_{2} + \lambda ||S||_{1} \quad \textrm{s.t.} \quad \textrm{rank}(L)=k $$
where the first term ensures data consistency6. To solve, singular-value-decomposition (SVD) is applied to obtain rank-$$$k$$$ estimates for $$$L$$$ and then $$$S$$$ is updated using sparse thresholding4. In this work, the combined solution ($$$L+S$$$) is desired to capture any static or temporally-correlated low-rank signals ($$$L$$$) plus any novel shot-to-shot metabolite variation ($$$S$$$).
Methods
AlgorithmThe algorithm was implemented in Matlab (The Mathworks, Natick, MA) and was adapted from available code6,8. At each iteration, $$$k$$$, was increased until the contribution of the final singular vector fell below a threshold, $$$\epsilon$$$= 0.001. The algorithm was initialized with $$$k=1$$$ and ran until convergence or for a maximum of 100 iterations.
Simulations
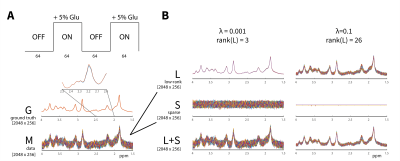
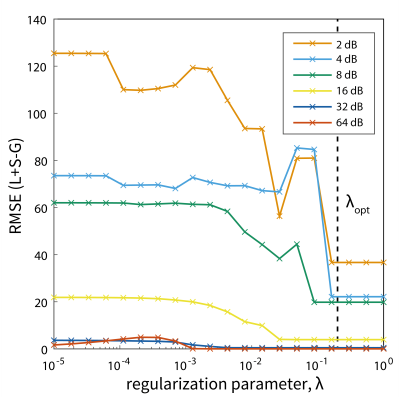
Performance was assessed using a simulated block-design paradigm (OFF-ON) x 2 (Fig. 1A). The experiment comprised of 256 identical spectra, simulated using a density-matrix approach (STEAM, 7 T, TE = 14ms, $$$N_p$$$ = 2048) with measured macromolecular baseline signal and scaled using literature values9. The concentration of glutamate was increased 5% during ON periods. 6 fMRS experiments were simulated with random Gaussian noise (2, 4, 8, 16, 32, 64) dB added to each transient. The effect of regularization parameter, $$$\lambda$$$, on the accuracy of the reconstructed $$$L+S$$$ spectra was measured using the RMSE from ground truth ($$$G$$$) ‘noiseless’ case over $$$\lambda$$$ = 10$$$^{-5}$$$ to 1.
In vivo
The L+S algorithm was applied to an existing fMRS dataset10 of 13 healthy volunteers who underwent visual stimulation with a repeated block design (OFF-ON, block duration = 64s) x 4. MRS data were acquired using semi-LASER ($$$N_t$$$ = 128, TE/TR = 36ms/4s, 7 T). Spectra were firstly aligned and phase corrected. For each subject, individual transients of $$$M$$$ and $$$L+S$$$ were fit with LCModel11. A moving average (window = 8) was applied to measured Glu concentrations (% change) to generate time-series, which were cross-correlated to the stimulus paradigm. No linewidth corrections were applied. Significance threshold was set to P<0.05.
Results
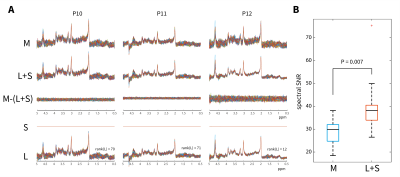
The reconstruction of $$$L$$$, $$$S$$$ and $$$L+S$$$ spectra from simulated data are shown in Fig 1B. $$$L$$$ was observed to contain correlated background signal, whereas noise dominated the sparse component ($$$S$$$) for small values of $$$\lambda$$$. A cut-off value of $$$\lambda_{\textrm{opt}}$$$ ≥ 0.2 was found to minimise the RMSE of the combined $$$L+S$$$ solution from ground-truth ($$$G$$$) across all noise values in simulations (Fig. 2).When applying the algorithm to in vivo fMRS data (Fig. 3A), mean spectral SNR was significantly higher for $$$L+S$$$ spectra than for the original data (40±12 vs 29±5, P=0.007, Fig. 3B). The rank of $$$L$$$ was 64±16 on average and $$$S$$$ was zero for $$$\lambda_{\textrm{opt}}$$$ = 0.2 (Fig. 3).
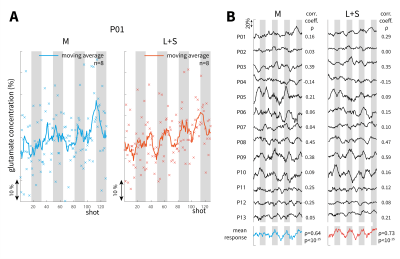
Fig 4A shows the glutamate concentration after fitting each transient and applying the sliding window analysis in one subject (P01). Several datasets resulted in periodic Glu time-courses using $$$M$$$ and $$$L+S$$$ data. The mean Glu time-course over 13 subjects correlated more strongly to the stimulus using $$$L+S$$$ (ρ=0.73) compared to $$$M$$$ (ρ=0.64), although both were highly significant (P<10$$$^{-15}$$$). A Glu increase in the first stimulation period was visible using $$$L+S$$$ and was not present using the original data (Fig. 4B).
Discussion & Conclusion
The proposed L+S approach resulted in higher SNR spectra by removing noise contribution, and led to a stronger correlation between the mean glutamate time-course and stimulus in vivo. The use of L+S may capture temporally correlated background- and novel signal in each shot (Fig. 1). However, optimisation in simulations (Fig. 2) led to L+S solutions with negligible sparse components (Fig. 3A), thus changes in L+S spectra were purely driven by low-rank approximation. Future work will consider fitting $$$L$$$ and $$$S$$$ components separately and improving sparse representations of dynamic signal changes compared to noise. L+S represents a powerful data-driven approach to explore signal dynamics over the course of an fMRS experiment.Acknowledgements
AB would like to acknowledge support of a Royal Academy of Engineering Research Fellowship. IBI is funded by a Royal Society Dorothy Hodgkin Research Fellowship (DHF\R1\201141).References
1. Stanley JA, Raz N. Functional magnetic resonance spectroscopy: The “new” MRS for cognitive neuroscience and psychiatry research. Front. Psychiatry 2018;9 doi: 10.3389/fpsyt.2018.00076.2. Mullins PG, Rowland LM, Jung RE, Sibbit Jr WL. A novel technique to study the brain’s response to pain: Proton magnetic resonance spectroscopy. Neuroimage 2005;26:642–646 doi: 10.1016/j.neuroimage.2005.02.001.
3. Mangia S, Tkáč I, Gruetter R, et al. Sensitivity of single-voxel 1H-MRS in investigating the metabolism of the activated human visual cortex at 7 T. Magn. Reson. Imaging 2006;24:343–348 doi: 10.1016/j.mri.2005.12.023.
4. Candès EJ, Li X, Ma Y, Wright J. Robust principal component analysis? J. ACM 2011;58 doi: 10.1145/1970392.1970395.
5. Gao H, Rapacchi S, Wang D, et al. Compressed sensing using prior rank, intensity and sparsity model (PRISM): Applications in cardiac cine MRI. In: Proc. Int. Soc. Magn. Reson. Med. ; 2012. p. #2242.
6. Otazo R, Candès E, Sodickson DK. Low-rank plus sparse matrix decomposition for accelerated dynamic MRI with separation of background and dynamic components. MRM 2015;73:1125–1136 doi: 10.1002/mrm.25240.
7. Tremoulheac B, Dikaios N, Atkinson D, Arridge SR. Dynamic MR image reconstruction-separation from undersampled (k,t)-Space via low-rank plus sparse prior. IEEE Trans. Med. Imaging 2014;33:1689–1701 doi: 10.1109/TMI.2014.2321190.
8. Sobral A, Bouwmans T, Zahzah E. LRSLibrary: Low-Rank and Sparse tools for Background Modeling and Subtraction in Videos. In: Robust Low-Rank and Sparse Matrix Decomposition: Applications in Image and Video Processing. ; 2016.
9. Emir UE, Auerbach EJ, Moortele P-F Van De, et al. Regional neurochemical profiles in the human brain measured by 1H MRS at 7 T using local B1 shimming. NMR Biomed. 2012;25:152–160 doi: 10.1002/nbm.1727.
10. Ip IB, Berrington A, Hess AT, Parker AJ, Emir UE, Bridge H. Combined fMRI-MRS acquires simultaneous glutamate and BOLD-fMRI signals in the human brain. Neuroimage 2017;155:113–119 doi: 10.1016/j.neuroimage.2017.04.030.
11. Provencher SW. Estimation of metabolite concentrations from localized in vivo proton NMR spectra. MRM 1993;30:672–679 doi: 10.1002/mrm.1910300604.
Figures

Fig.1 A: A
simulated fMRS experiment comprising 256 identical STEAM spectra with 5%
glutamate increase in ON periods. Ground truth (G) with added Gaussian noise
(M). Inset figure shows small glutamate increase in spectral range (2-2.5 ppm).
B: Using the L+S approach, M is decomposed into (low-rank) L, (sparse)
S and low-rank + sparse (L+S) spectra. Results, plotted for λ=10-3 and 10-1, show that a separation of stable background and sparse noise components is achieved for small λ, whereas higher λ constrained the
sparse component leading to higher rank L.

Fig.2. Determination of the optimum regularization constant, λ,
calculated for different noise levels in simulation. The RMSE of the
reconstructed L+S data matrix is compared to the ground truth simulation without
noise, G. An optimal λopt = 0.2 was found to produce minimal RMSE across noise-values.

Fig 3. Application of the L+S algorithm on an in vivo
dataset using regularization constant λopt = 0.2. A: Data from 3
subjects show the original data (M), low-rank + sparse (L+S) decomposition, the
difference between these as well as individual S and L components for P10, P11,
P12. B: The mean SNR measured in M and L+S spectra across all subjects,
showing a significant increase for L+S representation (P=0.007, paired
t-test). The range (dotted lines) and 25th percentiles (box) are
shown.

Fig. 4. LCModel fit for glutamate for each individual
time-point in the in vivo fMRS experiment comparing original data (M; blue) vs.
low-rank + sparse model (L+S; orange). Data normalised to first time-point. Grey
regions indicate stimulus on periods. Time-course is a sliding window (width =
8) of glutamate concentrations. A: Estimated Glu concentration change (%) in a
single subject (P01) for M and L+S. B: Glu changes in all 13 subjects together
with the mean time-course. The correlation coefficient with the stimulus
paradigm, ρ, is given for each time-course.
DOI: https://doi.org/10.58530/2022/1607