1601
Quantitative MR of the Distal Radius Bone Marrow as a marker of Osteoporosis1Department of Biomedical Engineering, Tel Aviv University, Tel-Aviv, Israel, 2Sackler Faculty of Medicine, Tel Aviv University, Tel-Aviv, Israel, 3Skeletal Imaging Division, Tel Aviv-Sourasky Medical Center, Tel-Aviv, Israel, 4Institute of Endocrinology, Metabolism and Hypertension, Tel Aviv-Sourasky Medical Center, Tel-Aviv, Israel, 5The Sagol School of Neuroscience, Tel Aviv University, Tel-Aviv, Israel, 6The Sagol Center for Epigenetics, Tel Aviv-Sourasky Medical Center, Tel-Aviv, Israel, 7Department of Oral Biology, School of Dental Medicine, Tel Aviv University, Tal-Aviv, Israel
Synopsis
In-vivo detection of osteoporosis-related changes in the distal radius bone marrow, using MR protocols, could provide safe and accessible means for screening and monitoring. A clinical trial was performed, including 26 women assigned into three study groups: healthy premenopausal (n=7), healthy postmenopausal (n=10) and osteoporotic postmenopausal (n=9). Fat composition was evaluated using T2 maps, two-compartment model of T1 and Dixon sequence. The osteoporotic group exhibited higher fat content and lower T2 values compared to the healthy premenopausal group. This study provides proof of concept for the use of the distal radius bone marrow as probing site for osteoporosis.
Introduction
Osteoporosis is a metabolic disease characterized by a decline in Bone Mineral Density (BMD) making it susceptible to fractures, one of the hallmark fracture sites being the distal Radius 1.The World Health Organization (WHO) defines osteoporosis by BMD value measured via dual-energy-X-ray-absorptiometry (DEXA), T-score ≤ –2.5 defines osteoporotic patient 2.
Studies have shown that BMD is inversely correlated to bone marrow fat fraction, and MRI can detect changes in bone marrow composition of the axial Skeleton 3-5. Previous studies by our group used animal models in-vitro and suggested that stray field NMR can detect changes in bone marrow composition of long bones 6,7.
This study is meant to explore the feasibility of scanning the bone marrow of the human distal radius in-vivo to detect osteoporosis-related changes using magnetic resonance. Our incentive is to evaluate whether the radius may serve as an accessible site, allowing screening and monitoring of the disease using an affordable, accessible means such as portable NMR scanner.
Methods
Clinical Scans26 women were recruited and assigned into three study groups according to their menopausal status and BMD T-scores measured by DEXA: healthy premenopausal (n=7), healthy postmenopausal (n=10) and osteoporotic postmenopausal (n=9). Scans were performed on a 3T Siemens Magnetom Prisma scanner. T1 maps were obtained using Turbo Spin Echo sequence with 7 TRs between 416-5500 msec, TE 8.5 msec, Slice thickness 4.5 mm, in plane resolution 0.83 mm. T2 was scanned using Multi-Slice Multi-Echo sequence with 22 TEs between 12-264 msec, TR 3659 msec, slice thickness 4.5 mm, in plane resolution 0.85 mm. T1 weighted two-point VIBE Dixon sequence was used with TR of 5.23 msec, TE 2.46 and 3.69 msec, flip angle of 90, slice thickness of 4.5 mm, in plane resolution of 0.85 mm.
Data Analysis
The region of interest (ROI) of the bone marrow was manually selected for each examinee to avoid edge effects. A two-compartment model was applied referring to water and fat as two separate compartments of the bone marrow. T2 was fit to a mono-exponent. Fat fraction (FF) and T1 relaxometry values of fat (T1f) and water (T1w), were calculated using bi-exponential fit according to Eq. 1 (with restrictions set on the fit variables).
(1) $$$s=s_0\cdot(FF\cdot(1-e^{-\frac{t}{T1_f}} )+(1-FF)\cdot(1-e^{-\frac{t}{T1_w}} ))$$$
The combination of relaxometry values providing the highest R2 value was chosen. Fat fraction image was calculated from the Dixon images according to Eq. 2. Average Fat Fraction of the ROI was computed after exclusion of outliers.
(2) $$$FF=\frac{F}{W+F}$$$
Results
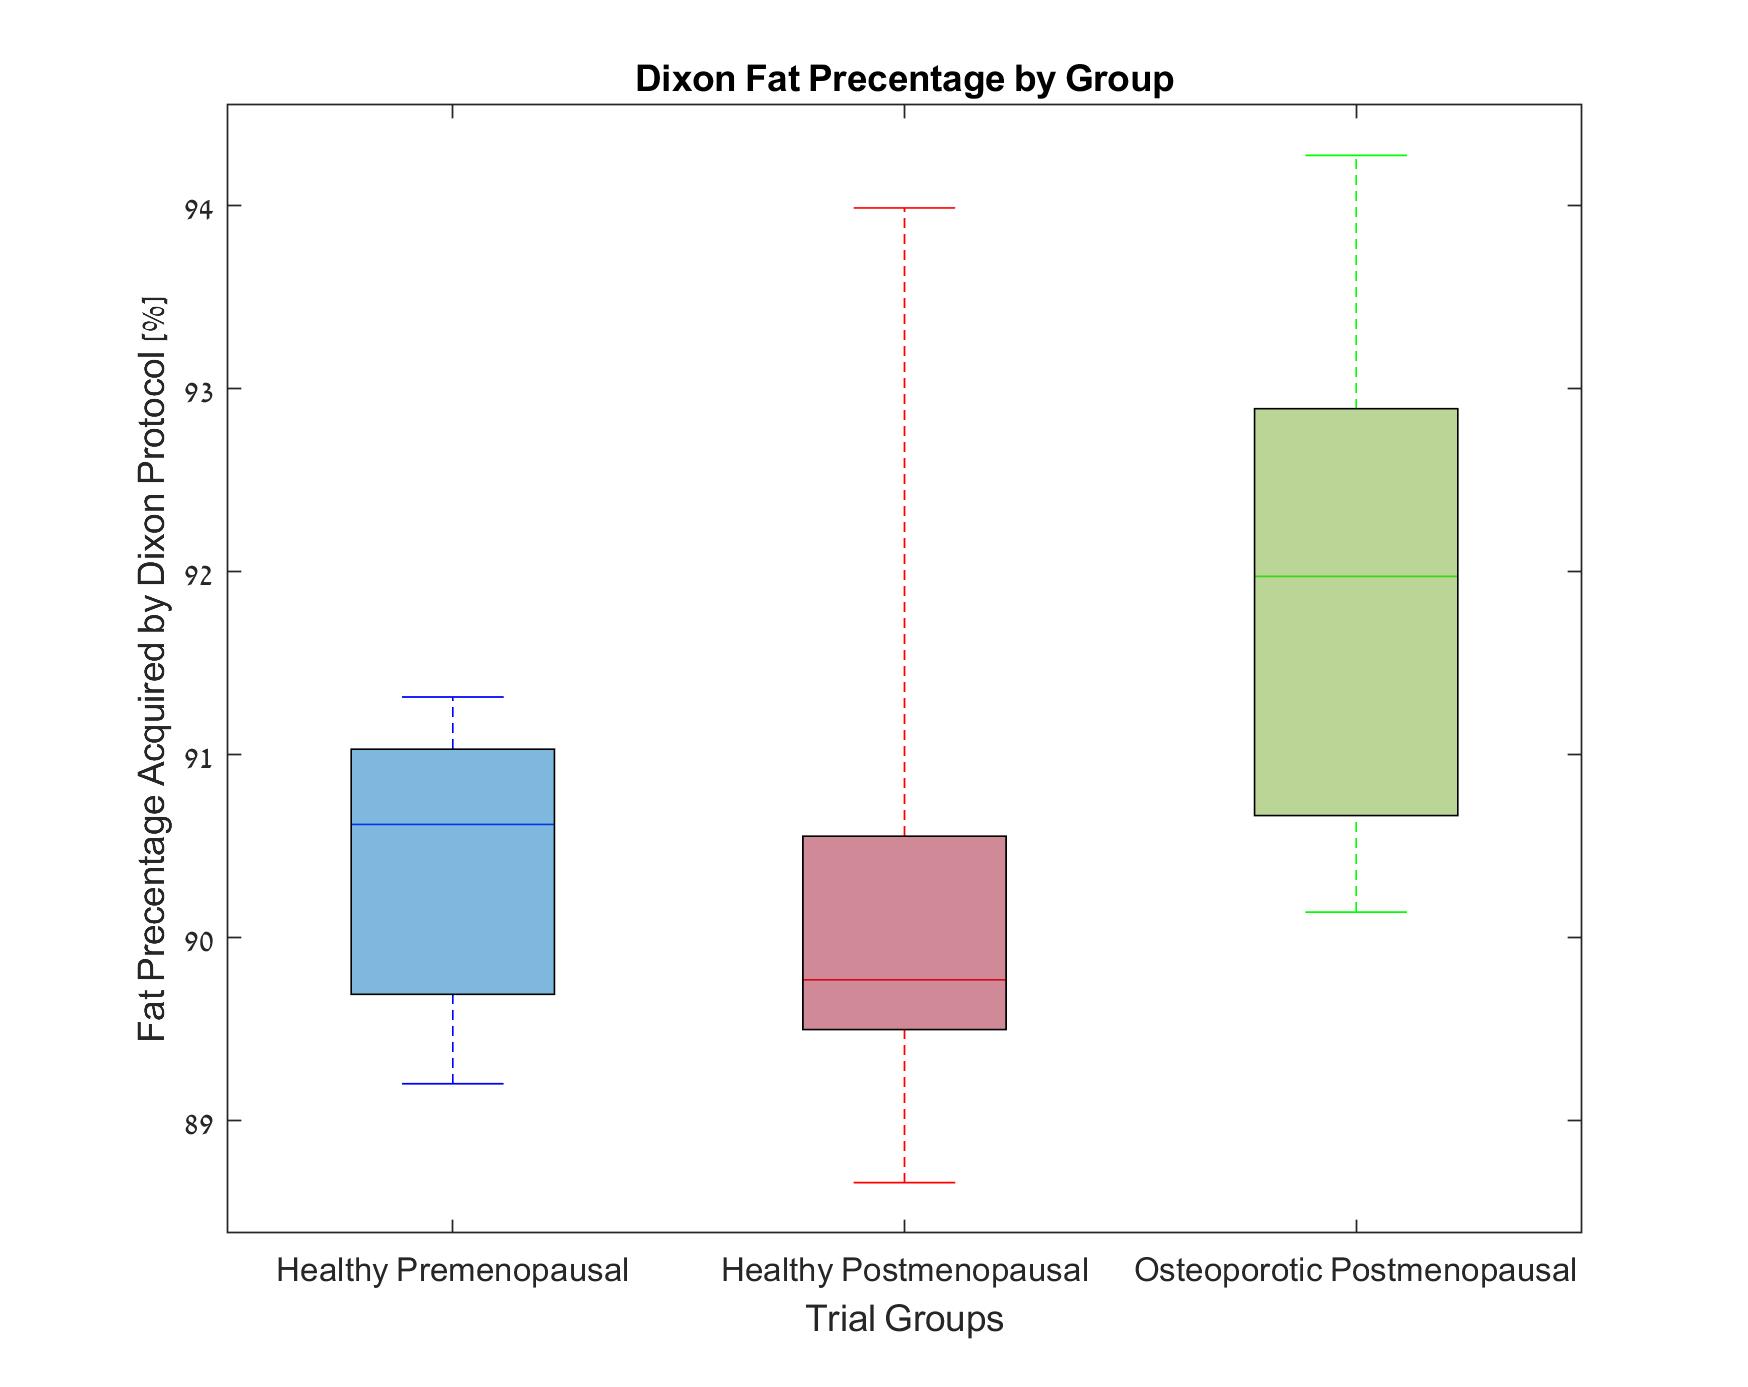
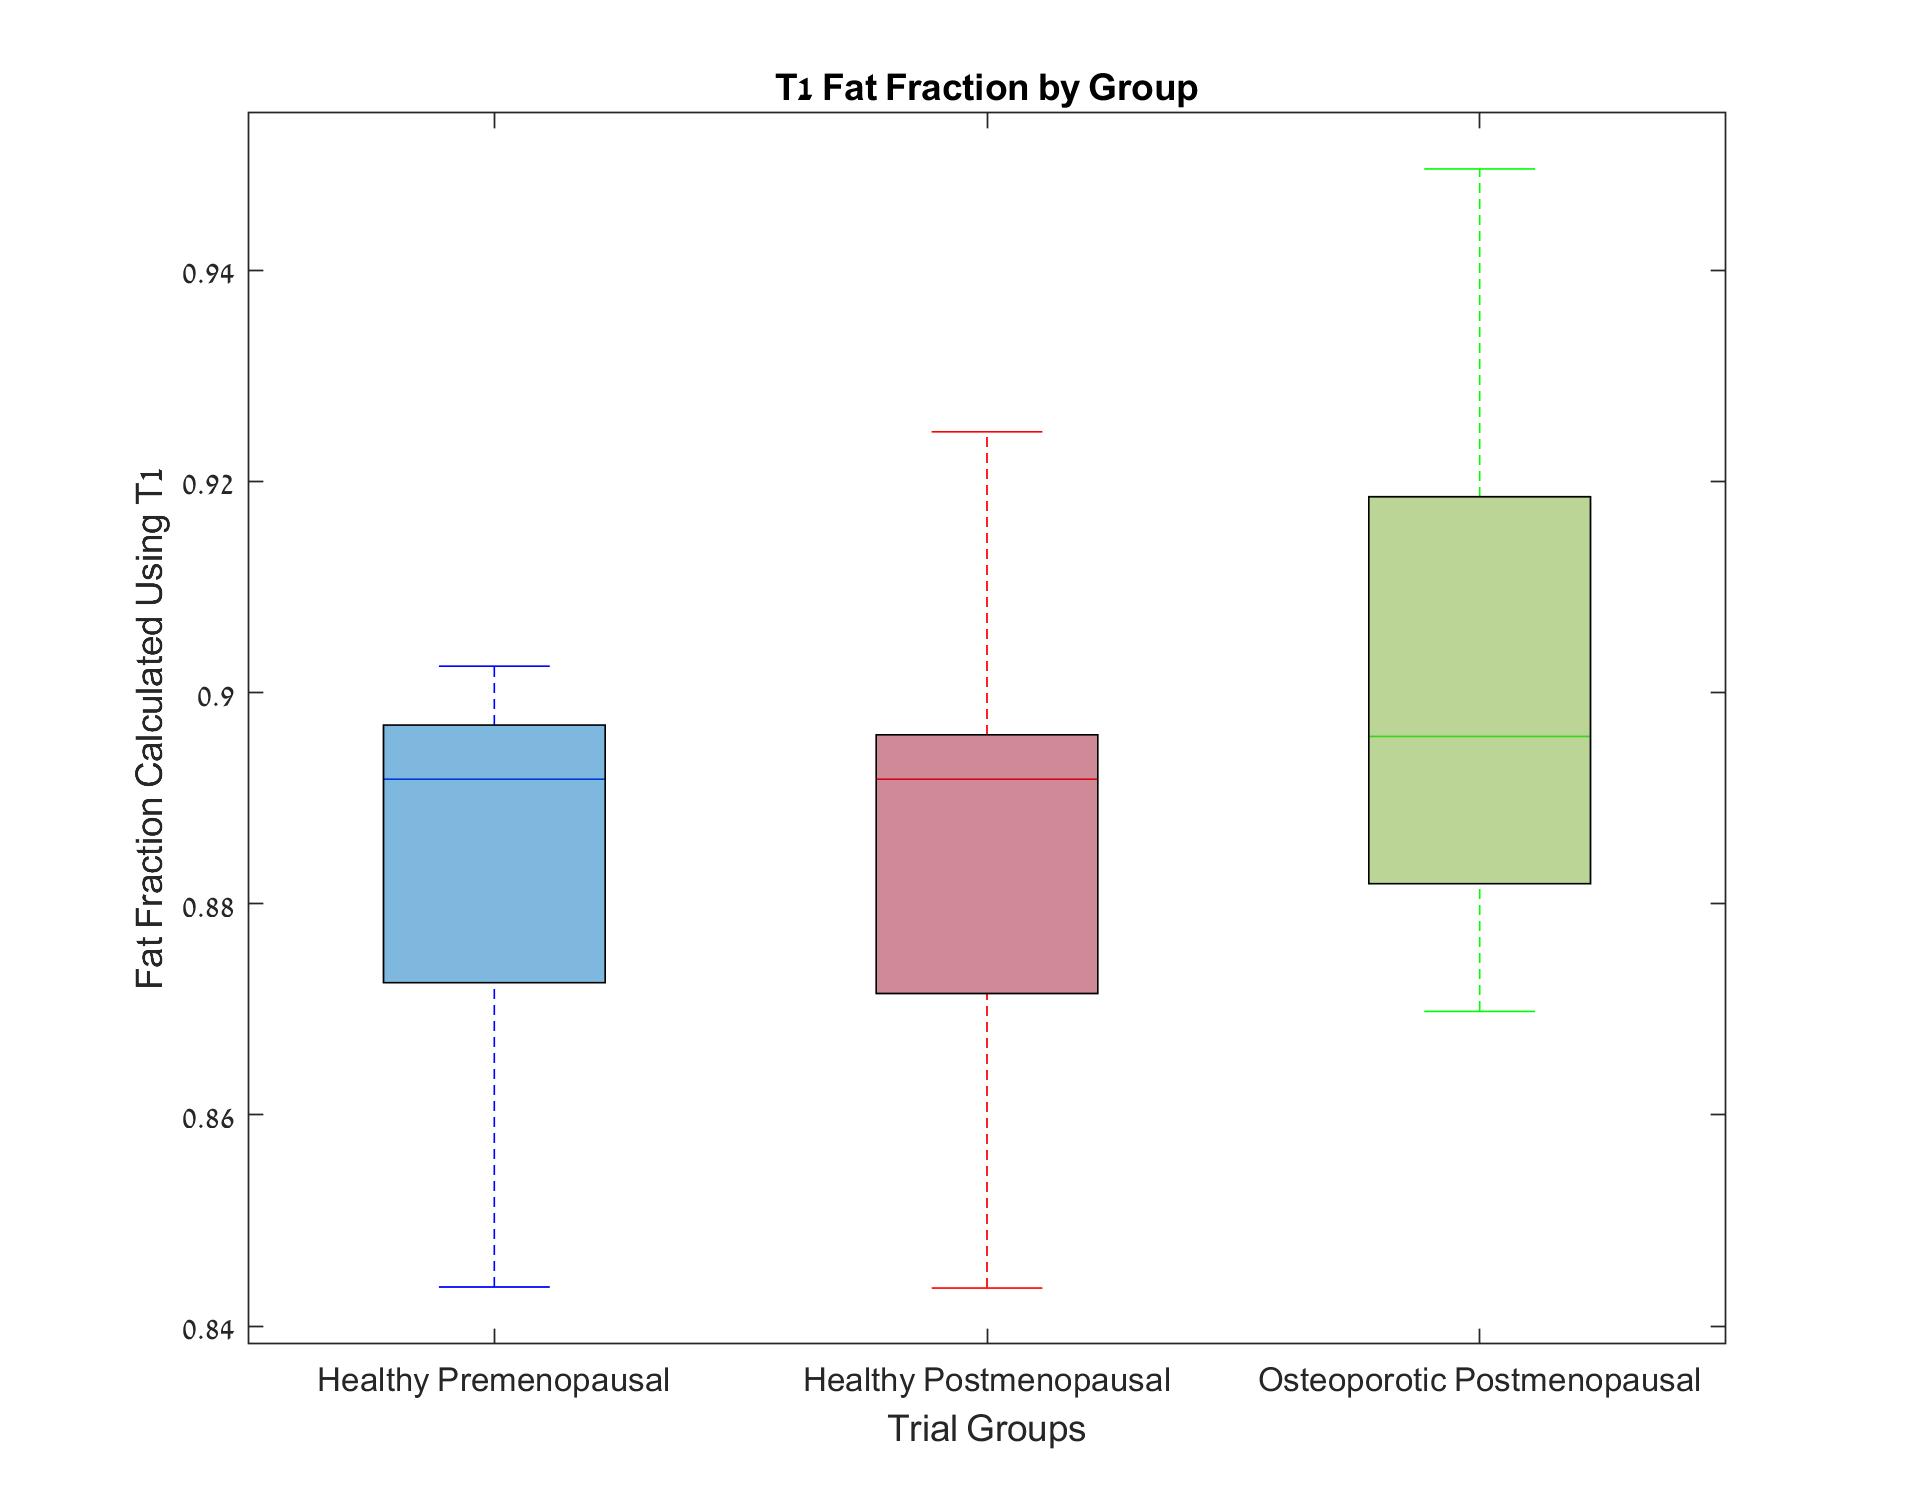
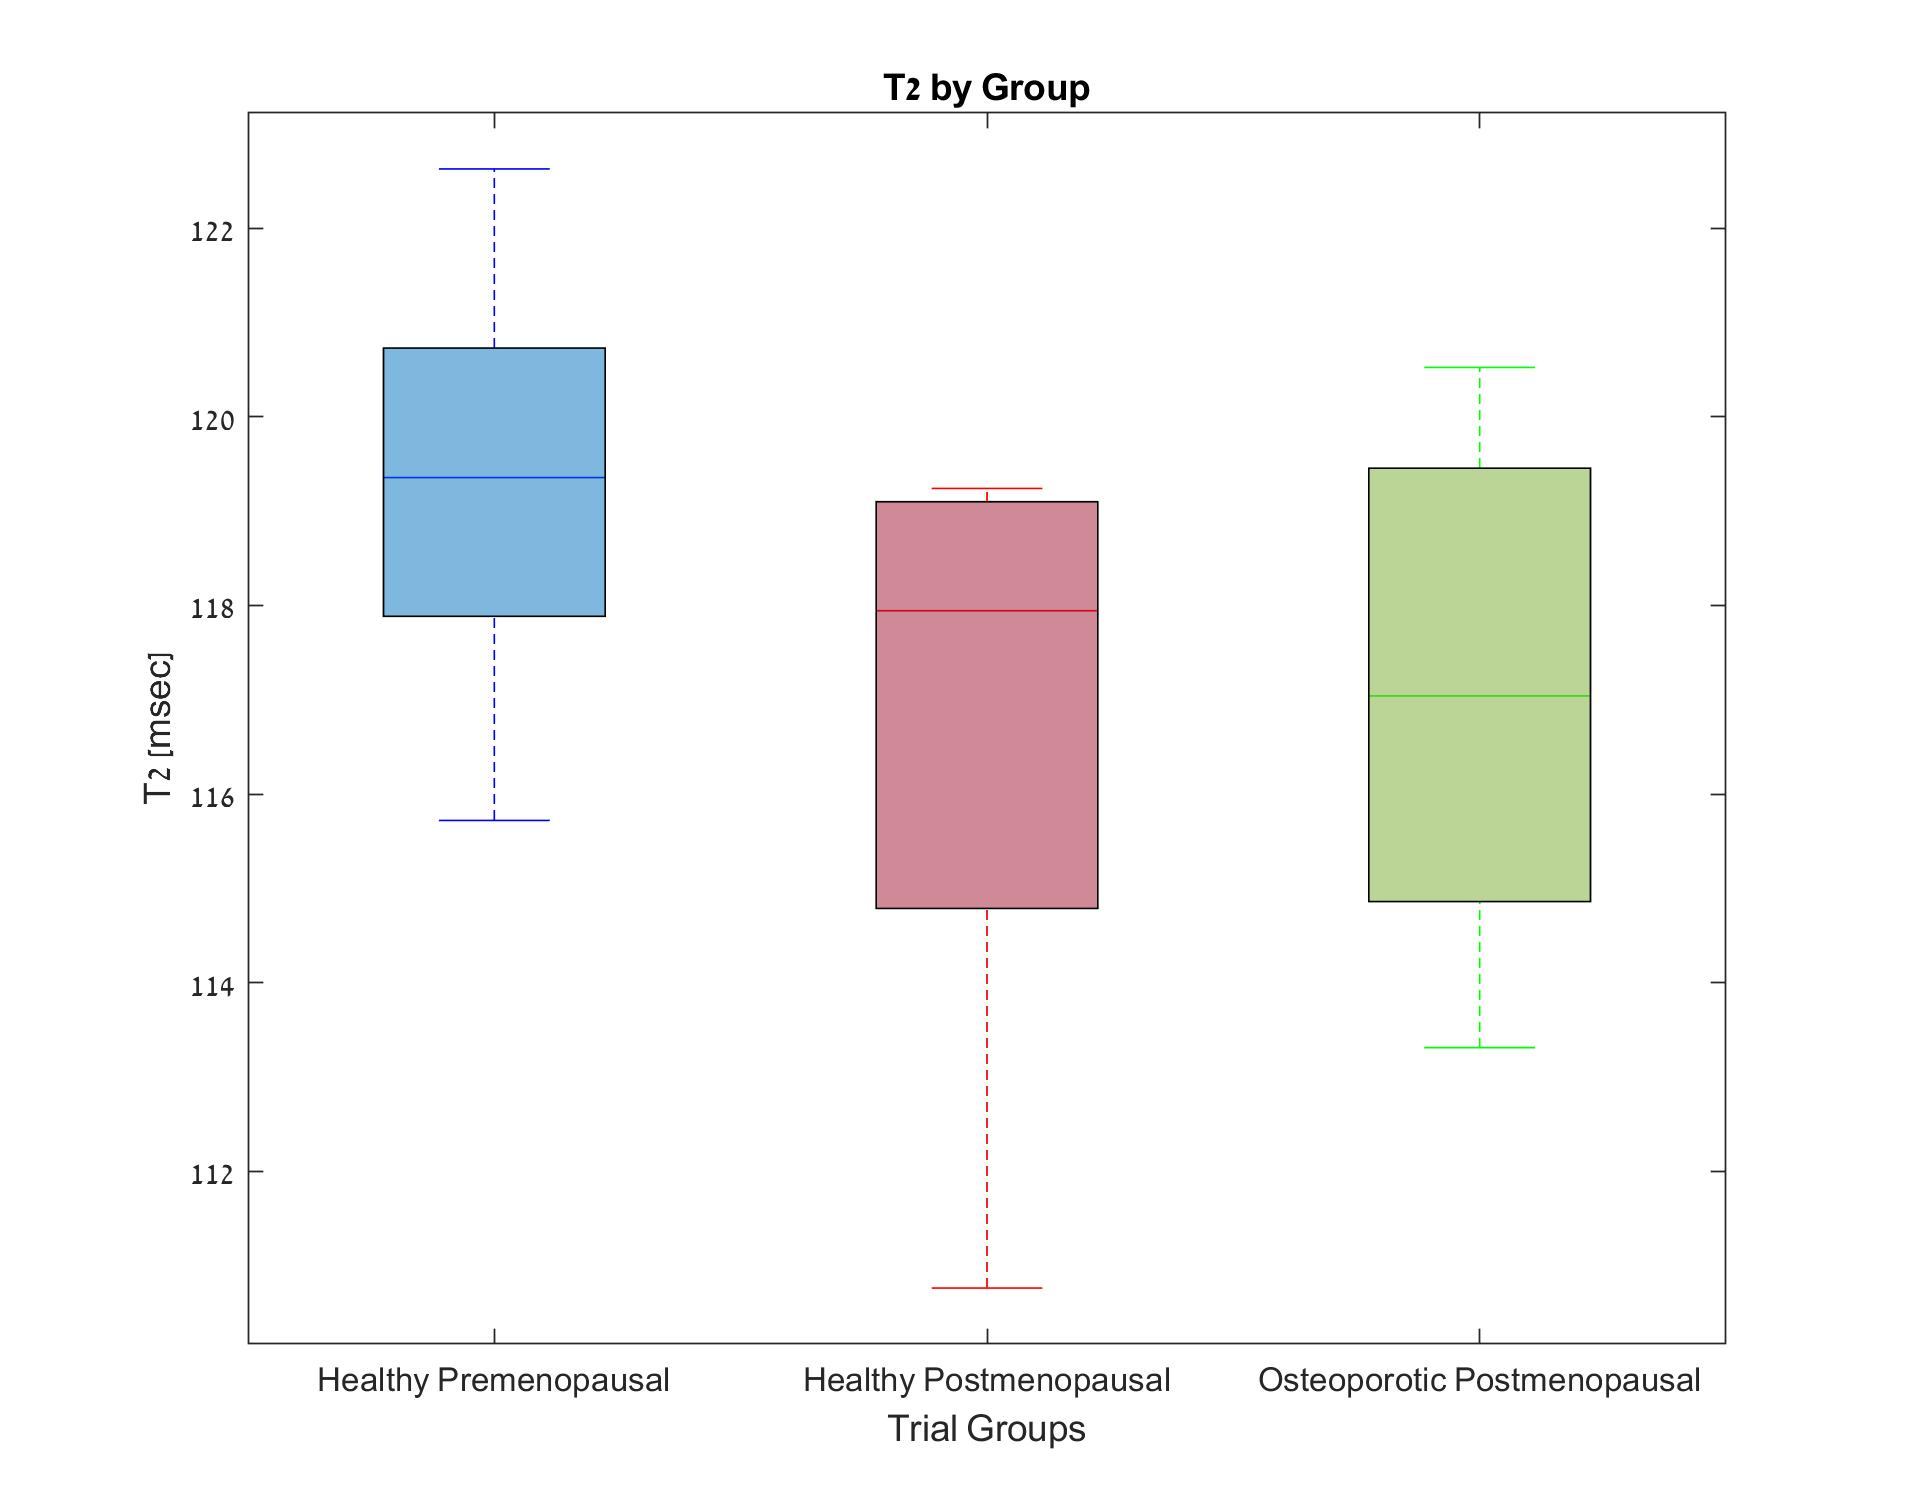
Figures 1-3 show the group distribution of fat percentage values as acquired by Dixon protocol, FF values obtained by a two-compartment model of T1, and T2 values.As expected, the osteoporotic postmenopausal group shows higher fat percentage (Fig 1), higher fat fraction (Fig 2) and lower T2 value (Fig 3) in comparison with the healthy premenopausal group.
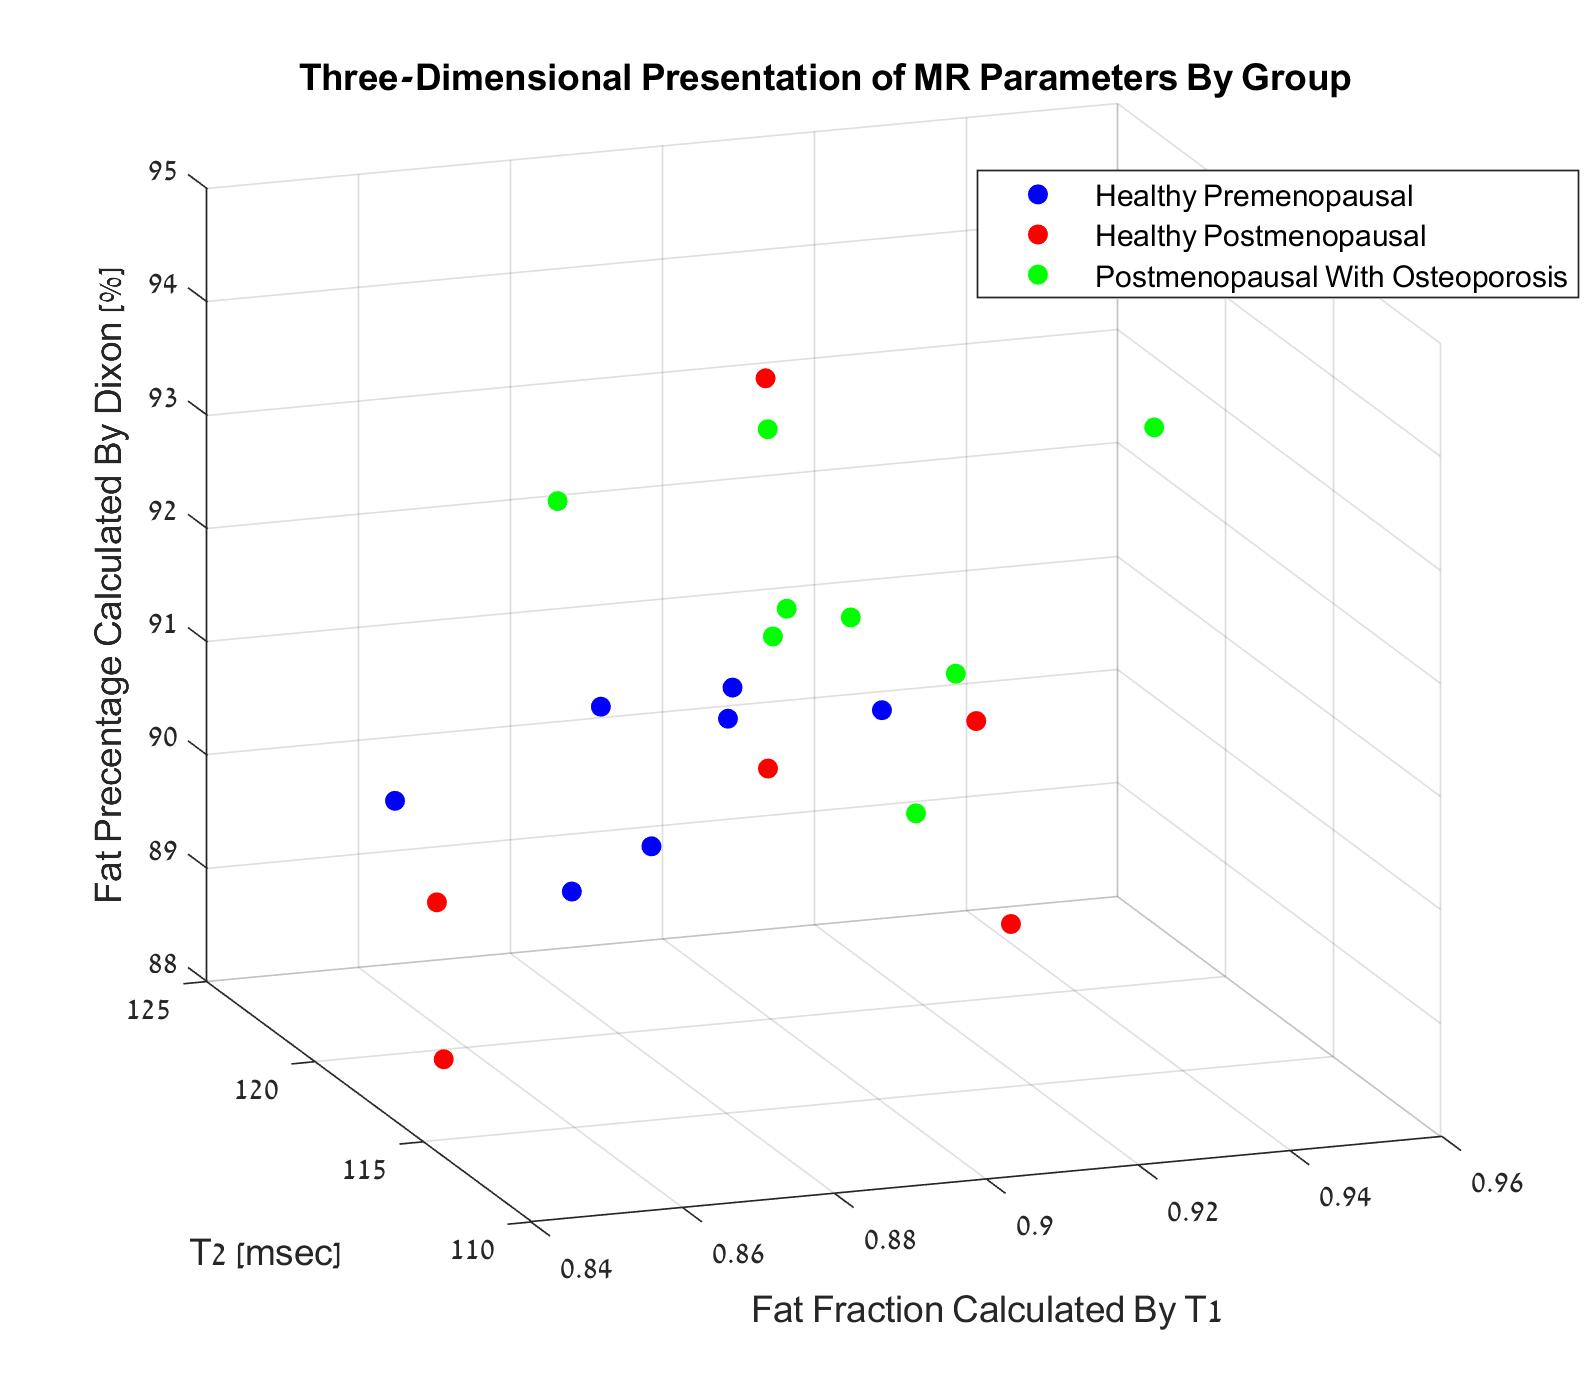
A three-dimensional presentation of the results is shown in Figure 4. The healthy premenopausal group is notably separated from the osteoporotic postmenopausal group, whereas the results of the healthy postmenopausal group remarkably diverge.
In an ordinal regression model, none of the independent variables was found as significantly related to the trial group assortment (P-Values > 0.05). A possible explanation is the small sample size. Owing to technical acquisition artifacts, only 21 of the 26 cases were included in this model.
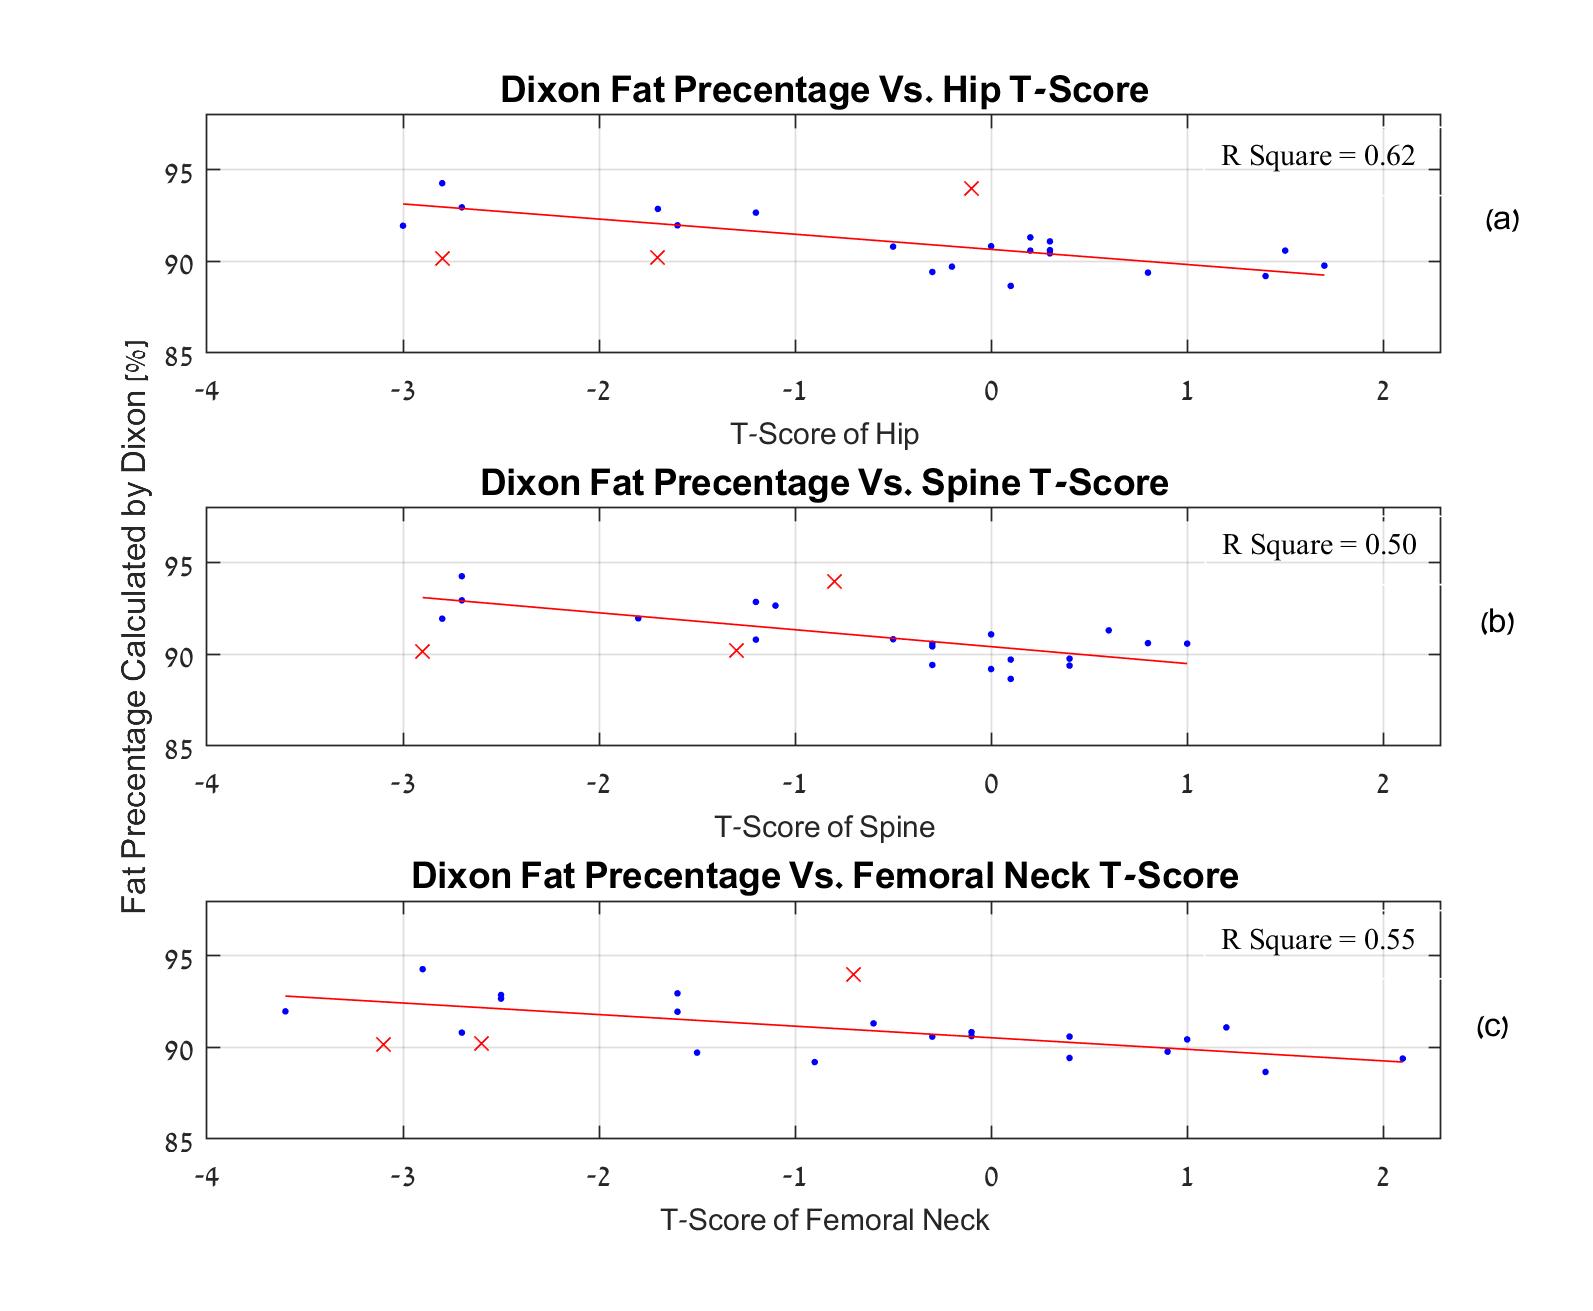
Figure 5 shows the correlation between fat percentage values acquired using Dixon, and the separate axial T-scores of each examinee. A linear trend is evident.
Discussion
The detected differences between the healthy premenopausal and osteoporotic group may be easily explained by the higher fat content of the fatty bone marrow associated with osteoporosis.The relative diversity of the results of the healthy postmenopausal group may be attributed to competing effects caused by changes in the microstructure of aging bones, including increased porosity, bone marrow oedema etc.
Nevertheless, the identified separation between the healthy premenopausal group and the Osteoporotic group, along with the evident correlation between the Dixon obtained fat percentage and axial skeleton T-Scores suggests that the Radius bone marrow may serve as a probing site for detection of osteoporosis related changes in vivo, using MR techniques.
Conclusions
Osteoporosis-related changes in the composition of the distal Radius bone marrow may be detected in-vivo using MRI protocols.The MRI scanning protocols chosen in this study design are ones that can later be repeated using stray field NMR, thus offering the potential for early detection and monitoring of treatment, using an accessible, affordable means that may be used in small clinics.
Acknowledgements
This study was funded by the Israeli Ministry of Science (to UN and IB).
All examinees were recruited by the Dept of Endocrinology at the Sourasky Medical Center (Tel Aviv, Israel).
The study was approved by the ethics committee of The Sorasky Medical Center and Tel Aviv University.
All MRI scans were performed at the Alfredo Federico Strauss Imaging Center in Tel Aviv University.
References
1. Riggs BL, Melton LJ 3rd. The worldwide problem of osteoporosis: insights afforded by epidemiology. Bone. 1995;17(5 Suppl):505S-511S.
2. Kanis JA, Melton III LJ, Christiansen J, Johnston CC, Khaltaev N. The diagnosis of osteoporosis. J Bone Miner Res. 1994;9:1137–1141.
3. Griffith JF, Yeung DK, Antonio GE, et al. Vertebral bone mineral density, marrow perfusion, and fat content in healthy men and men with osteoporosis: dynamic contrast-enhanced MR imaging and MR spectroscopy. Radiology. 2005;236(3):945-951.
4. Karampinos DC, Ruschke S, Gordijenko O, et al. Association of MRS-Based Vertebral Bone Marrow Fat Fraction with Bone Strength in a Human In Vitro Model. J Osteoporos. 2015;2015:152349.
5. Wei Shen 1, Xiuqun Gong, Jessica Weiss, Ye Jin. Comparison among T1-weighted magnetic resonance imaging, modified dixon method, and magnetic resonance spectroscopy in measuring bone marrow fat. J Obes, 2013;2013:298675.
6. Sarda Y, Bergman E, Hillel I, Binderman I, Nevo U. Detection of bone marrow changes related to estrogen withdrawal in rats with a tabletop stray-field NMR scanner. Magn Reson Med. 2017;78(3):860-870.
7. Hillel I, Binderman I, Sarda Y, Nevo U. Monitoring of Cellular Changes in the Bone Marrow following PTH(1-34) Treatment of OVX Rats Using a Portable Stray-Field NMR Scanner. J Osteoporos. 2017;2017:7910432.
Figures