1600
Texture analysis using chemical shift imaging improves differentiation between patients with and without osteoporotic vertebral fractures1Department of Diagnostic and Interventional Radiology, University Hospital Ulm, Ulm, Germany, 2Department of Diagnostic and Interventional Neuroradiology, Technical University of Munich, Munich, Germany, 3Department of Radiology and Biomedical Imaging, University of California San Francisco, San Francisco, CA, United States, 4Department of Diagnostic and Interventional Radiology, Technical University of Munich, Munich, Germany, 5Engineering Product Development (EPD) Pillar, Singapore University of Technology and Design, Singapore, Singapore
Synopsis
Osteoporosis is characterized by increased skeletal fragility with vertebral fractures (VFs). Areal bone mineral density (BMD) from dual-energy X-ray absorptiometry (DXA) is the reference standard but has well-known limitations. Texture analysis (TA) can provide parameters of tissue microstructure using spine chemical shift encoding-based water-fat MRI (CSE-MRI) and computed tomography (CT), thus potentially improving fracture risk estimation. This study found that a model including volumetric BMD (vBMD) and several texture features (TFs) from CSE-MRI and CT predicts 81% of the variance regarding osteoporotic VF status, compared to 47% when based on vBMD and the proton density fat fraction (PDFF) only.
Introduction
Osteoporosis is a highly prevalent skeletal disease that is characterized by fragility fractures1. Among those, VFs are particularly common, but can stay clinically asymptomatic2,3. This condition delays diagnosis, timely treatment initiation, and approaches to avoid secondary osteoporotic VFs2,3.In clinical routine, DXA-based measurements of areal BMD are used to assess fracture risk1,4. However, DXA has proven to have some inherent limitations, including inaccuracies in differentiating patients with and without prevalent VFs5,6. Hence, alternatives to DXA are required, including MRI and CT7,8. Particularly CSE-MRI has been developed into a valuable tool to determine a vertebral body’s PDFF, which is considered a biomarker of bone health8. However, susceptibility to fragility fractures is not solely explained by decreased BMD or alterations in fat content of bone marrow, given that bone strength and resistance to fracture are also determined by other factors, including bone geometry and microstructural architecture9.
Image-based TA is an advanced image analysis technique that provides spatially resolved information on a vertebral body’s bone structure, which is compromised in osteoporosis7,8. It represents an objective and quantitative approach to analyze the distribution and relationship of pixel or voxel gray levels10,11. Yet, it is largely unknown whether CSE-MRI-derived TA can predict vBMD or whether a model incorporating TA based on CSE-MRI and CT may improve performance in differentiating patients with and without osteoporotic VFs. Therefore, we hypothesize that combining CSE-MRI-based and CT-based TA may improve the differentiation between patients with and without osteoporotic VFs compared to PDFF and vBMD alone.
Methods
Twenty-six patients who had clinical routine CT and 3-Tesla CSE-MRI available were analyzed. For CSE-MRI, a sagittal six-echo time-interleaved 3D spoiled gradient echo sequence of the thoracolumbar spine was acquired12. The six echoes of the CSE-MRI sequence were acquired in two interleaves acquiring 3 echoes per TR, using flyback (monopolar) read-out gradients (Table 1). A flip angle of 3° was used to minimize T1-bias effects13. ReconFrame (https://www.gyrotools.com/gt/index.php/products/reconframe) was used for raw data handling and reconstruction. Water-fat separation was performed using a graph-cut algorithm, employing a multi-peak fat model specific to bone marrow and a single T2* decay model14. The PDFF maps were computed as the ratio of the fat signal over the sum of fat and water signals8,15.Vertebral bodies that were imaged by both CSE-MRI and CT were segmented (Figures 1&2), using manual delineation of whole vertebral bodies for CSE-MRI (extraction of PDFF and T2*) and an automatic convolutional neural network (CNN)-based framework for CT (extraction of vBMD; https://anduin.bonescreen.de). First-order, second-order, and higher-order TFs were derived from TA for CSE-MRI and CT using a MATLAB-based radiomics toolbox (https://github.com/mvallieres/radiomics; Table 2). Stepwise multivariate linear regression models were computed using vBMD or VF status as dependent variables. Patient age, sex, the number of independent variables, and the vertebral level (T1-L5) were considered for adjustment.
Results
Analyses included 171 vertebral bodies of the thoracolumbar spine, derived from 26 patients (mean age±SD: 67.7±15.2 years, 15 females, 11 patients showed at least one osteoporotic VF; median interval between CSE-MRI and CT acquisitions: 4 days). Patients with and without VFs did not statistically significantly differ in age or sex distribution (p>0.10 each). Patients with osteoporotic VFs showed significantly lower vBMD when compared to patients without fractures (p<0.001). For the model with vBMD as the dependent variable, T2* combined with three PDFF-based TFs explained 40% of the variance (adjusted R2 [R2a]=0.40; p<0.001). Furthermore, a model including TFs from CSE-MRI and CT considerably improved the differentiation between patients with and without osteoporotic VFs compared to a model based on vBMD and PDFF only (R2a=0.47 vs. R2a=0.81; included TFs in the final model: vBMD, CT_SRE, CT_Varianceglobal, and PDFF_Variance; Table 3).Discussion
As hypothesized, combining CSE-MRI-based and CT-based TA resulted in improved differentiation between patients with and without osteoporotic VFs compared to PDFF and vBMD alone. Thus, the results of this study indicate that TA based on CSE-MRI and CT data can provide parameters potentially valuable for improving image-based osteoporosis diagnostics and fracture prediction. Specifically, a model incorporating T2* and three TFs based on CSE-MRI predicted the variation in vBMD by a proportion of 40%, while PDFF alone was no significant predictor in the model. T2* represents an MRI-based parameter related to bone microstructure and density16-18. It has previously been demonstrated that T2* correlates with the density and orientation of trabecular bone17. The exclusion of PDFF in the final model may be particularly considered as evidence for the need for more advanced analyses of CSE-MRI data beyond mere PDFF. In this regard, the feasibility of TA based on PDFF maps has been presented recently for other purposes than for differentiating between patients with and without osteoporotic VFs, revealing vertebral bone marrow heterogeneity related to age, sex, and anatomical location19,20.Conclusion
A model consisting of vBMD and several TFs for CSE-MRI and CT data predicted 81% of the variance for osteoporotic VF status, compared to 47% when the model was based on vBMD and PDFF only. Thus, TA may improve the differentiation of patients according to their fracture status compared to vBMD and PDFF alone, having implications for estimation of the individual fracture risk in osteoporosis.Acknowledgements
The present work was supported by the European Research Council (grant agreement No. 677661 – ProFatMRI: D.C.K. & grant agreement No. 637164 – iBack: J.S.K.), the German Research Foundation (Deutsche Forschungsgemeinschaft, DFG; project 432290010: J.S.K. & T.B.), the German Society of Musculoskeletal Radiology (Deutsche Gesellschaft für Muskuloskelettale Radiologie, DGMSR: N.S. & M.D.), the B. Braun Foundation (project BBST-D-19-00106: N.S.), and the German Academic Exchange Service (Deutscher Akademischer Austauschdienst, DAAD: N.S.).References
- Compston JE, McClung MR, Leslie WD. Osteoporosis. Lancet 2019;393:364-76.
- Melton LJ, 3rd, Atkinson EJ, Cooper C, O'Fallon WM, Riggs BL. Vertebral fractures predict subsequent fractures. Osteoporos Int 1999;10:214-21.
- Haczynski J, Jakimiuk A. Vertebral fractures: a hidden problem of osteoporosis. Med Sci Monit 2001;7:1108-17.
- Jain RK, Vokes T. Dual-energy X-ray Absorptiometry. J Clin Densitom 2017;20:291-303.
- Arabi A, Baddoura R, Awada H, et al. Discriminative ability of dual-energy X-ray absorptiometry site selection in identifying patients with osteoporotic fractures. Bone 2007;40:1060-5.
- Maricic M. Use of DXA-based technology for detection and assessment of risk of vertebral fracture in rheumatology practice. Curr Rheumatol Rep 2014;16:436.
- Loffler MT, Sollmann N, Mei K, et al. X-ray-based quantitative osteoporosis imaging at the spine. Osteoporos Int 2019.
- Sollmann N, Loffler MT, Kronthaler S, et al. MRI-Based Quantitative Osteoporosis Imaging at the Spine and Femur. Journal of magnetic resonance imaging : JMRI 2020.
- Ammann P, Rizzoli R. Bone strength and its determinants. Osteoporos Int 2003;14 Suppl 3:S13-8.
- Lubner MG, Smith AD, Sandrasegaran K, Sahani DV, Pickhardt PJ. CT Texture Analysis: Definitions, Applications, Biologic Correlates, and Challenges. Radiographics 2017;37:1483-503.
- Castellano G, Bonilha L, Li LM, Cendes F. Texture analysis of medical images. Clin Radiol 2004;59:1061-9.
- Ruschke S, Eggers H, Kooijman H, et al. Correction of phase errors in quantitative water-fat imaging using a monopolar time-interleaved multi-echo gradient echo sequence. Magnetic resonance in medicine : official journal of the Society of Magnetic Resonance in Medicine / Society of Magnetic Resonance in Medicine 2017;78:984-96.
- Karampinos DC, Yu H, Shimakawa A, Link TM, Majumdar S. T(1)-corrected fat quantification using chemical shift-based water/fat separation: application to skeletal muscle. Magnetic resonance in medicine : official journal of the Society of Magnetic Resonance in Medicine / Society of Magnetic Resonance in Medicine 2011;66:1312-26.
- Boehm C, Diefenbach MN, Makowski MR, Karampinos DC. Improved body quantitative susceptibility mapping by using a variable-layer single-min-cut graph-cut for field-mapping. Magnetic resonance in medicine : official journal of the Society of Magnetic Resonance in Medicine / Society of Magnetic Resonance in Medicine 2021;85:1697-712.
- Reeder SB, Hu HH, Sirlin CB. Proton density fat-fraction: a standardized MR-based biomarker of tissue fat concentration. Journal of magnetic resonance imaging : JMRI 2012;36:1011-4.
- Wehrli FW, Ford JC, Attie M, Kressel HY, Kaplan FS. Trabecular structure: preliminary application of MR interferometry. Radiology 1991;179:615-21.
- Wehrli FW, Song HK, Saha PK, Wright AC. Quantitative MRI for the assessment of bone structure and function. NMR in biomedicine 2006;19:731-64.
- Majumdar S, Thomasson D, Shimakawa A, Genant HK. Quantitation of the susceptibility difference between trabecular bone and bone marrow: experimental studies. Magnetic resonance in medicine : official journal of the Society of Magnetic Resonance in Medicine / Society of Magnetic Resonance in Medicine 1991;22:111-27.
- Burian E, Subburaj K, Mookiah MRK, et al. Texture analysis of vertebral bone marrow using chemical shift encoding-based water-fat MRI: a feasibility study. Osteoporos Int 2019;30:1265-74.
- Dieckmeyer M, Junker D, Ruschke S, et al. Vertebral Bone Marrow Heterogeneity Using Texture Analysis of Chemical Shift Encoding-Based MRI: Variations in Age, Sex, and Anatomical Location. Front Endocrinol (Lausanne) 2020;11:555931.
Figures
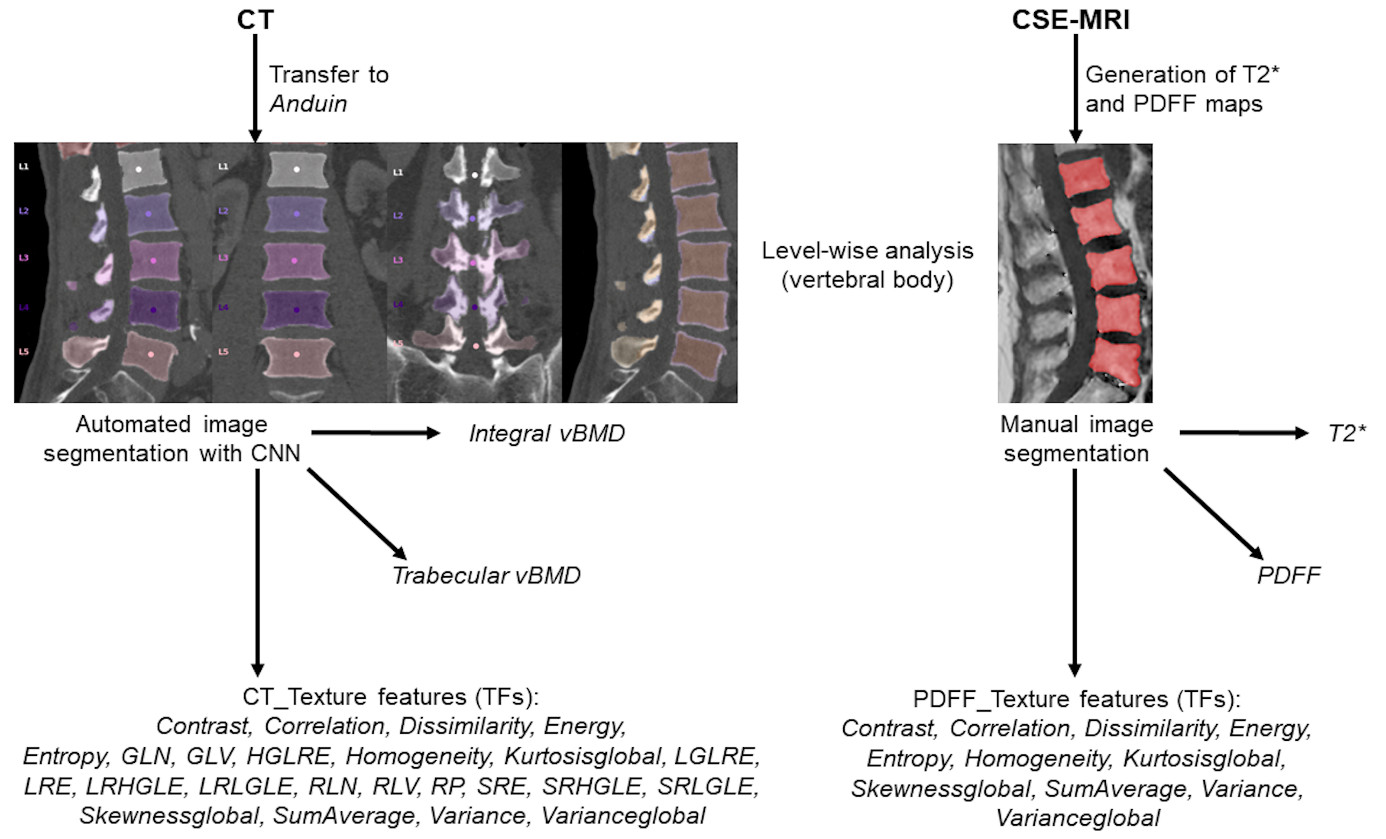
Figure 1: Overview of the study setup
Texture analysis (TA) to extract different texture features (TFs) was achieved based on chemical shift encoding-based water-fat MRI (CSE-MRI) and computed tomography (CT) data. CSE-MRI-derived data were segmented manually (extraction of level-wise PDFF and T2*), CT data were segmented using a convolutional neural network (CNN)-based framework (https://anduin.bonescreen.de; Anduin).
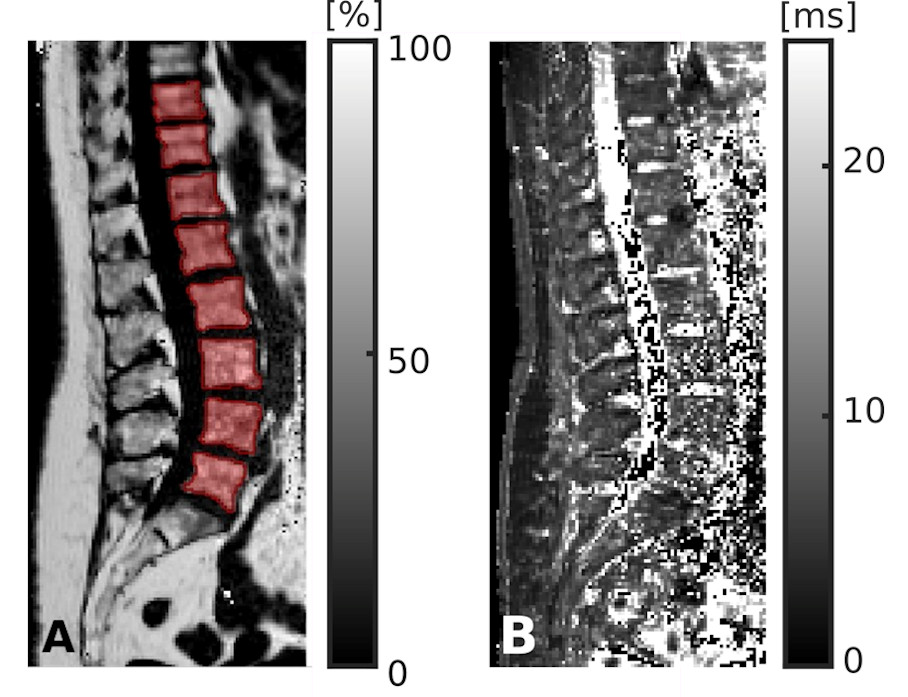
Figure 2: Segmentation of chemical shift encoding-based water-fat MRI (CSE-MRI)
CSE-MRI scan of a 74-year-old woman: proton density fat fraction (PDFF) map [%] with manually prescribed segmentation masks (A) and T2* map [ms] (B), covering the lower thoracic and lumbar vertebral bodies (T10-L5). Segmentation masks were used to extract PDFF, T2*, and texture features (TFs) following texture analysis (TA).
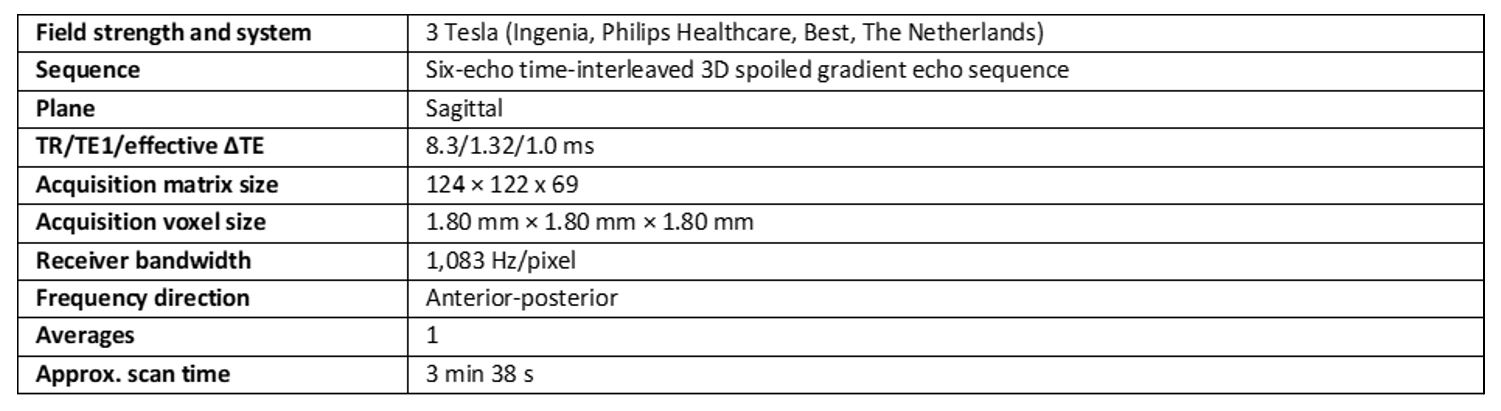
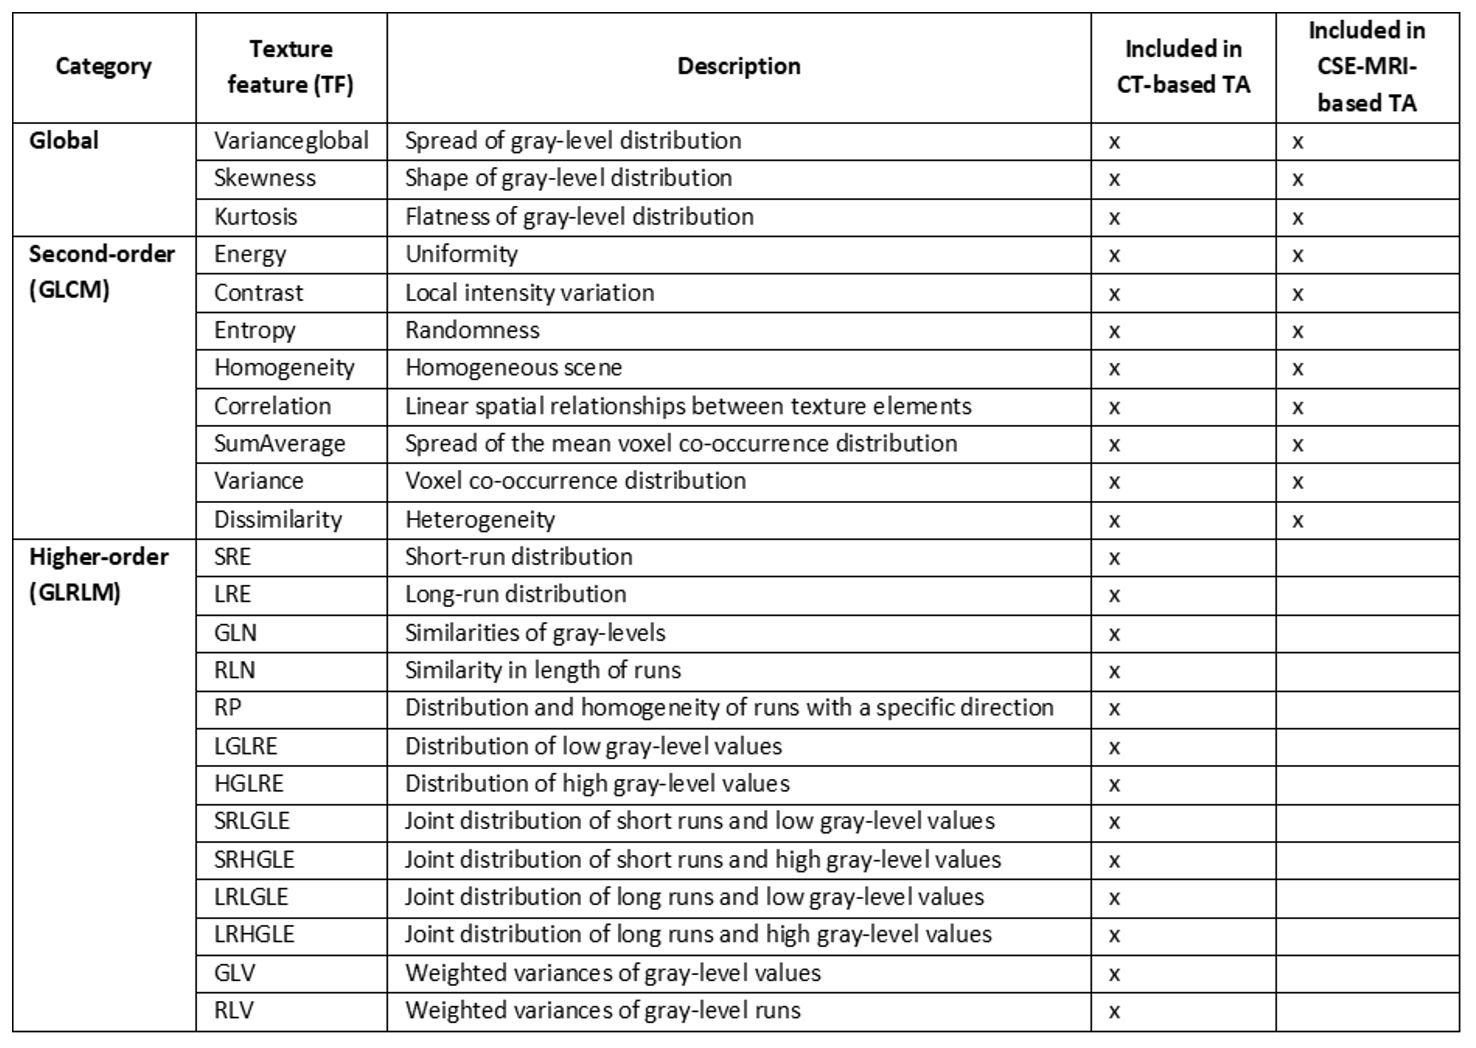
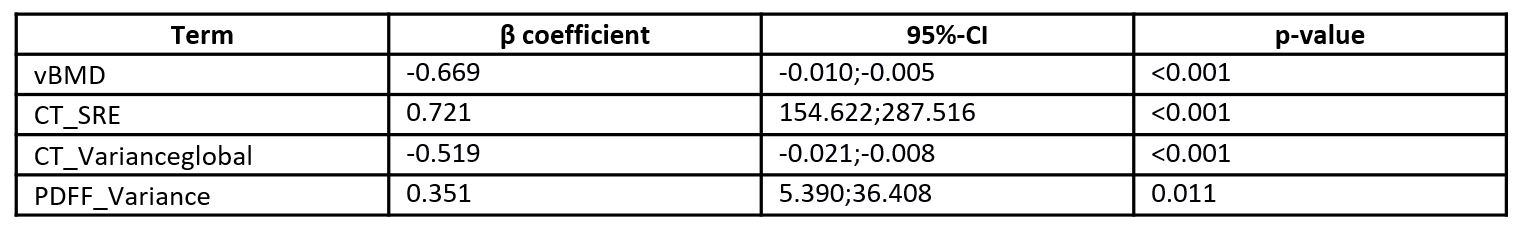
Table 3: Differentiation between patients with and without osteoporotic vertebral fractures (VFs) including texture analysis (TA)
This table shows the variables kept in the final linear regression model (adjusted R2 [R2a] = 0.81 (F(6, 19)=19.2, p<0.001) after a stepwise approach using the binary fracture status (at least one osteoporotic VF present / no osteoporotic VF present) as the dependent variable (analyses on patient level).