1599
Comprehensive Assessment of Osteoporosis in Lumbar Spine Using Compositional MR Imaging of Trabecular Bone1Department of Radiology, The Fifth Affiliated Hospital of Sun Yat-Sen University, Zhuhai, China, 2MR Research, GE Healthcare, Beijing, China, 3Department of Radiology, University of California San Diego, San Diego, CA, United States
Synopsis
Compositional MR Imaging, which is combined of a Short TR Adiabatic Inversion Recovery prepared Ultrashort Echo Time (STAIR-UTE) and the Iterative decomposition of water and fat with echo asymmetry and least squares estimation (IDEAL-IQ) techniques, is developed to measure collagen bound water proton fraction, free water proton fraction, total water proton fraction of trabecular bone in lumbar spine. These biomarkers are highly correlated with bone mineral density, T score and Fracture Risk Assessment Tool scores, which demonstrates that the compositional MR imaging has great potential in diagnosis of patient with osteoporosis.
Introduction
Osteoporosis (OP) is an increasingly common challenge in public health care, and the number of vertebral fractures continues to increase with the rapidly growth of elderly population [1]. Bone water compartments have been shown to correlate with mechanical properties of bone, including peak stress, yield stress, and elastic toughness [2]. Bone marrow fat fraction (BMFF) content has been found to be negatively correlated bone mass, which may be a potential biomarker to predict OP [3]. In this study, we propose a compositional MR imaging technique to evaluate OP. This technique is combined of a short repetition time adiabatic inversion recovery prepared ultrashort echo time (STAIR-UTE) [4] and the Iterative decomposition of water and fat with echo asymmetry and least squares estimation (IDEAL-IQ) [5]. The STAIR-UTE and IDEAL-IQ can quantify collagen bound water and fat proton contents, respectively. With the combination of STAIR-UTE and IDEAL-IQ, we can quantify all the water compartment (i.e., bound water, free water and total water) and fat proton fractions. We applied this new compositional MR imaging technique to evaluate bone quality in lumbar spine for osteoporotic patients.Methods
A total of 182 participants with a mean age of 57 (ranged from 50 to 86) years old were underwent MRI (Signa, Pioneer, GE Healthcare), quantitative computed tomography (QCT), and dual-energy X-ray absorptiometry (DXA) in lumbar spine. Informed consent was obtained from all participants in accordance with the Institutional Review Board. The STAIR-UTE sequence parameters [3] were as follows: TR/TI = 150/64 ms, TE = 0.032 ms, flip angle (FA) = 18°, FOV = 30cm × 30cm, matrix = 140 × 140, slice thickness = 4.5mm, slice number = 16, oversampling factor = 2, and scan time = 10 min. In order to measure collagen bound water proton fraction (CBWPF), a proton density weighted 3D UTE Cones sequence was applied without STAIR preparation (TR = 6 ms, TE = 0.032 ms, FA = 2°, and scan time = 1 min, other parameters are the same with STAIR-UTE). A product sequence, IDEAL-IQ, was used to quantify BMFF (TR = 7.3 ms, TEs = 1.1, 2.0, 2.9, 3.9, 4.8, and 5.7 ms, FA = 4°, FOV = 32×32 cm2, matrix = 160 × 160; number of slices = 12; slice thickness = 8 mm; and scan time = 16 sec). The IDEAL-IQ only considers fat and free water components for BMFF calculation. The collagen bound water content was not included in this calculation because the IDEAL-IQ sequence cannot detect short T2 bound water signals (T2* ~ 0.3 ms) in trabecular bone due to the relative long echo time. So with known CBWPF and nominal BMFF, we can obtain the information of the proton fractions of bound water (i.e., CBWPF), free water (FWPF) and total water (TWPF), as well as fat (1-TWPF).In this study, lumbar CBWPF, FWPF, TWPF, BMFF, bone mineral density (BMD) and T score values were calculated in three vertebrae (L2–L4) for each subject. Major fracture risk was also evaluated for all participants using Fracture Risk Assessment Tool (FRAX). CBWPF, FWPF, TWPF and BMFF were correlated with BMD, T score, and FRAX score for comparison. The performances of the CBWPF, FWPF, TWPF and BMFF to discriminate between three different cohorts, which included normal subjects, patients with osteopenia, and patients with osteoporosis, were also evaluated and compared using receiver operator characteristic (ROC) analysis.
Results and Discussion
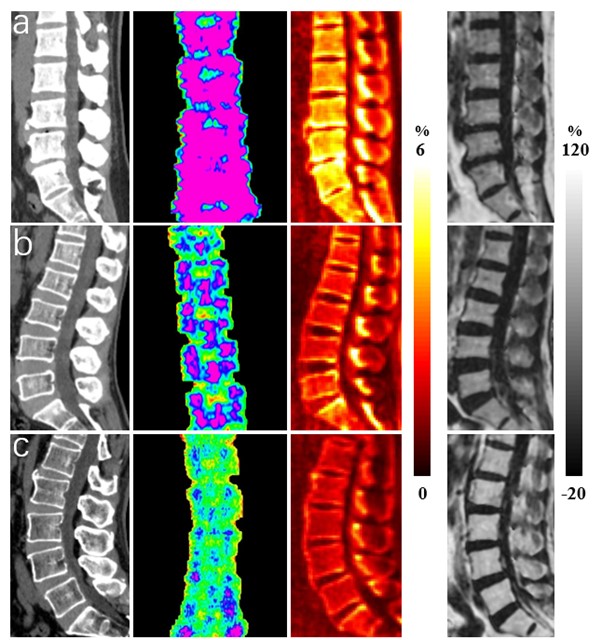
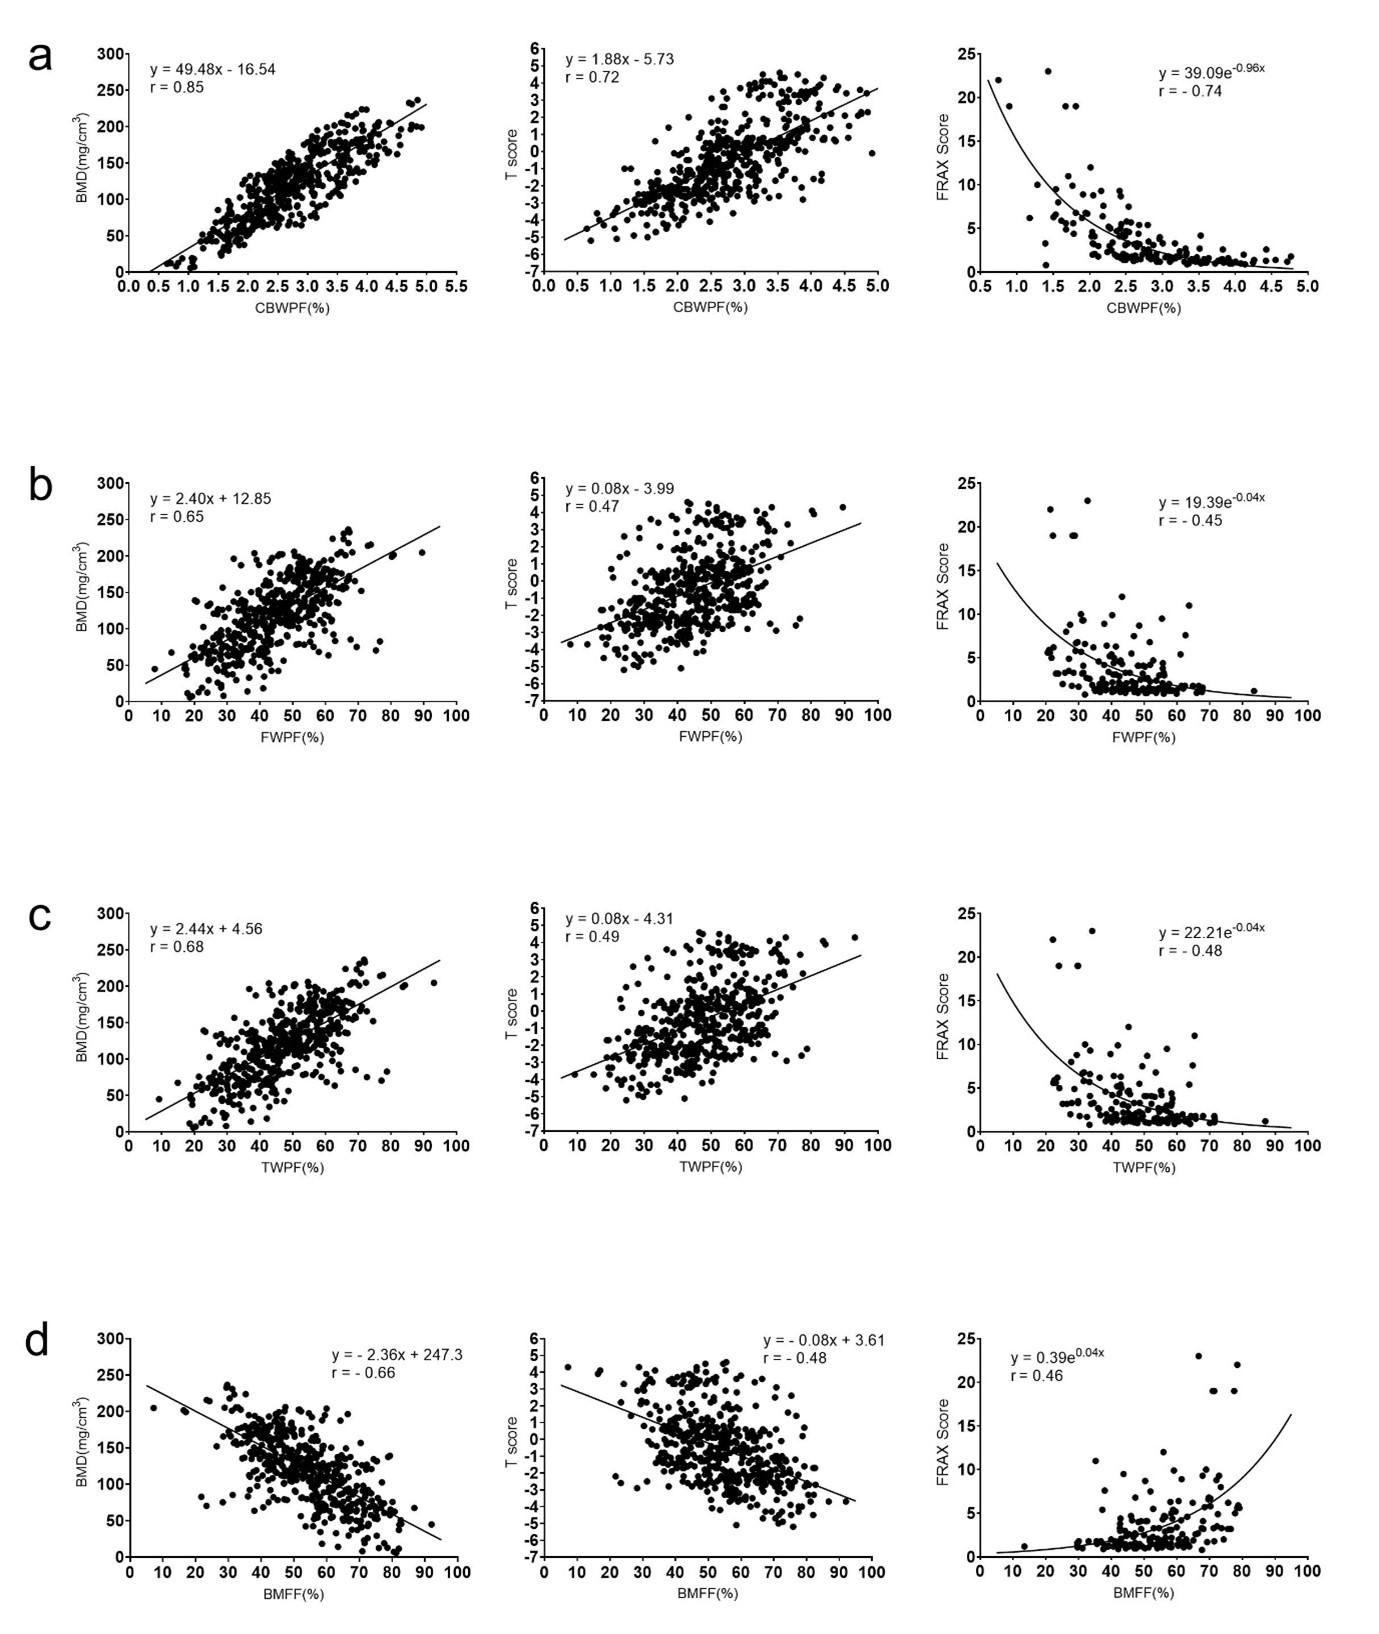
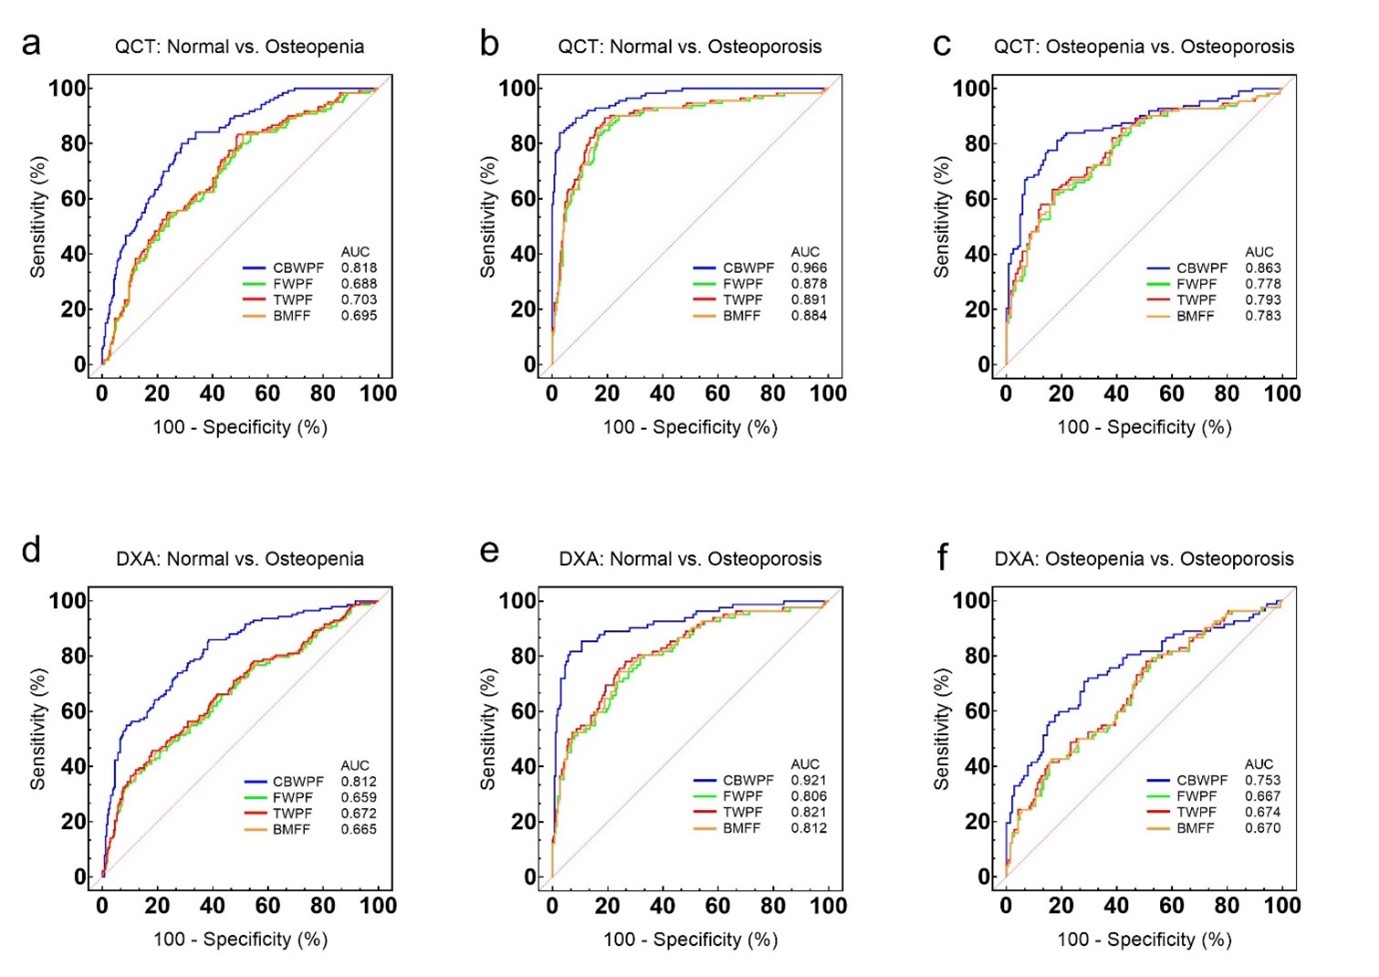
Figure 1 shows representative STAIR-UTE, QCT, DXA, and BMFF maps of the lumbar spines of three subjects: one from each cohort (normal, osteopenia, and OP). Lower CBWPF, BMD, and T score, as well as higher BMFF, were found in more osteoporotic subjects. The CBWPF showed strong correlation with standard BMD (r = 0.85, P < 0.001) and T score (r = 0.72, P < 0.001), as well as a moderate correlation with FRAX score (r = -0.74, P < 0.001) (Fig. 2a). The FWPF showed strong correlation with standard BMD (r = 0.65, P < 0.001), as well as a moderate correlation with T score (r = 0.47, P < 0.001) and FRAX score (r = -0.45, P < 0.001) (Fig. 2b). The TWPF showed strong correlation with standard BMD (r = 0.68, P < 0.001) as well as a moderate correlation with T score (r = 0.49, P < 0.001) and FRAX score (r = -0.48, P < 0.001) (Fig. 2c). High area under the curve (AUC) values obtained from ROC analysis demonstrated that the CBWPF, FWPF and TWPF was capable of well differentiating between the three different subject cohorts. Moreover, the CBWPF had better correlations with BMD, T score, and FRAX score than FWPF, TWPF and BMFF, and also performed better in cohort discrimination. This is not surprising that proton combination of free water and marrow fat can be a good biomarker for bone porosity, which is expressed as 1-CBWPF.Conclusion
The new compositional MR Imaging technique is able to quantify CBWPF, FWPF and TWPF in lumbar trabecular bone. These showed very good correlations with BMD in patients with osteoporosis, which demonstrate that the proposed compositional MR Imaging technique is promising in the assessment of bone quality and fracture risk.Acknowledgements
No acknowledgement found.References
[1] Srivastava M, Deal C. Osteoporosis in elderly: prevention and treatment. Clinics in geriatric medicine 2002;18(3):529-555.
[2] Seeman E, Delmas PD. Bone quality--the material and structural basis of bone strength and fragility. N Engl J Med 2006;354(21):2250-2261
[3] Demontiero O, Vidal C, Duque G. Aging and bone loss: new insights for the clinician. Ther Adv Musculoskelet Dis 2012;4:61-76.
[4] Ma YJ, Chen Y, Li L, Cai Z, Wei Z, Jerban S, Jang H, Chang EY, Du J. Trabecular bone imaging using a 3D adiabatic inversion recovery prepared ultrashort TE Cones sequence at 3T. Magnetic resonance in medicine 2019;00:1–12.
[5] Yu H, McKenzie CA, Shimakawa A, Vu AT, Brau AC, Beatty PJ, Pineda AR, Brittain JH, Reeder SB. Multiecho reconstruction for simultaneous water-fat decomposition and T2* estimation. J Magn Reson Imaging 2007;26(4):1153-1161.
Figures