1596
Solid-state MR based quantitative assessment of bone water and 31P differentiates between postmenopausal women with and without osteoporosis1Radiology, University of Pennsylvania, Philadelphia, PA, United States, 2Bioengineering, University of Pennsylvania, Philadelphia, PA, United States, 3Computer Science and Engineering, National Sun Yat-sen University, Kaohsiung, Taiwan, 4School of Electronics, Kyungpook National University, Daegu, Korea, Republic of, 5Department of Endocrinology, University of Pennsylvania, Philadelphia, PA, United States
Synopsis
Fifteen osteoporotic, treatment-naïve, and 19 non-osteoporotic postmenopausal women have been examined in an ongoing study to evaluate tibial cortical bone health via solid-state MRI. Proton dual-echo UTE and IR-prepared rapid-UTE sequences were used for quantification of pore and bound water concentrations, and a 31P PETRA-ZTE sequence for quantification of bone mineralization. Osteoporotics showed elevated pore and total water concentration, thinner cortices, decreased 31P content and degree of bone mineralization (DBM). Our preliminary results suggest that solid-state MR biomarkers of bone porosity and DBM may be useful in evaluating cortical bone health.
INTRODUCTION
Clinical assessment of bone based on dual-energy X-ray absorptiometry (DXA) provides measurements of areal bone mineral density (aBMD). However, aBMD is a 2D aggregate parameter that is unable to distinguish between independent contributors to bone strength[1, 2], namely, bone microstructure, macroscopic bone morphology, total bone mineral and collagen content, and the degree of mineralization of bone[3, 4]. Additionally, while different anti-osteoporosis medications are known to have varying effects on trabecular and cortical compartments[5, 6], DXA cannot differentiate between changes that occur in cortical and trabecular bone. Advanced imaging protocols, which can independently quantify the various contributors to bone fracture risk would provide more detailed insights into bone pathophysiology and guide the development of targeted osteoporosis therapeutics.Our group has previously reported on a protocol for holistic assessment of cortical bone health through ultrashort- and zero-echo-time (UTE and ZTE) pulse sequences[7]. This protocol includes surrogates for bone microstructure (pore water (PW)), collagen and organic matrix density (bound water (BW))[8-10], and bone morphology (cortical thickness (CbTh))[11] from UTE 1H MRI, as well as measurements of mineral concentration (31P content) and degree of mineralization of bone expressed as [31P]/[BW] through direct 31P ZTE imaging[7, 9, 12]. Leveraging this comprehensive cortical bone protocol, we have initiated the first study to evaluate the efficacy of 1H and 31P solid-state MRI at quantifying bone health in patients with low bone density. Here we present preliminary results from an ongoing study examining changes in bone quality between osteoporotic subjects undergoing bisphosphonate treatment and age-matched controls.
METHODS
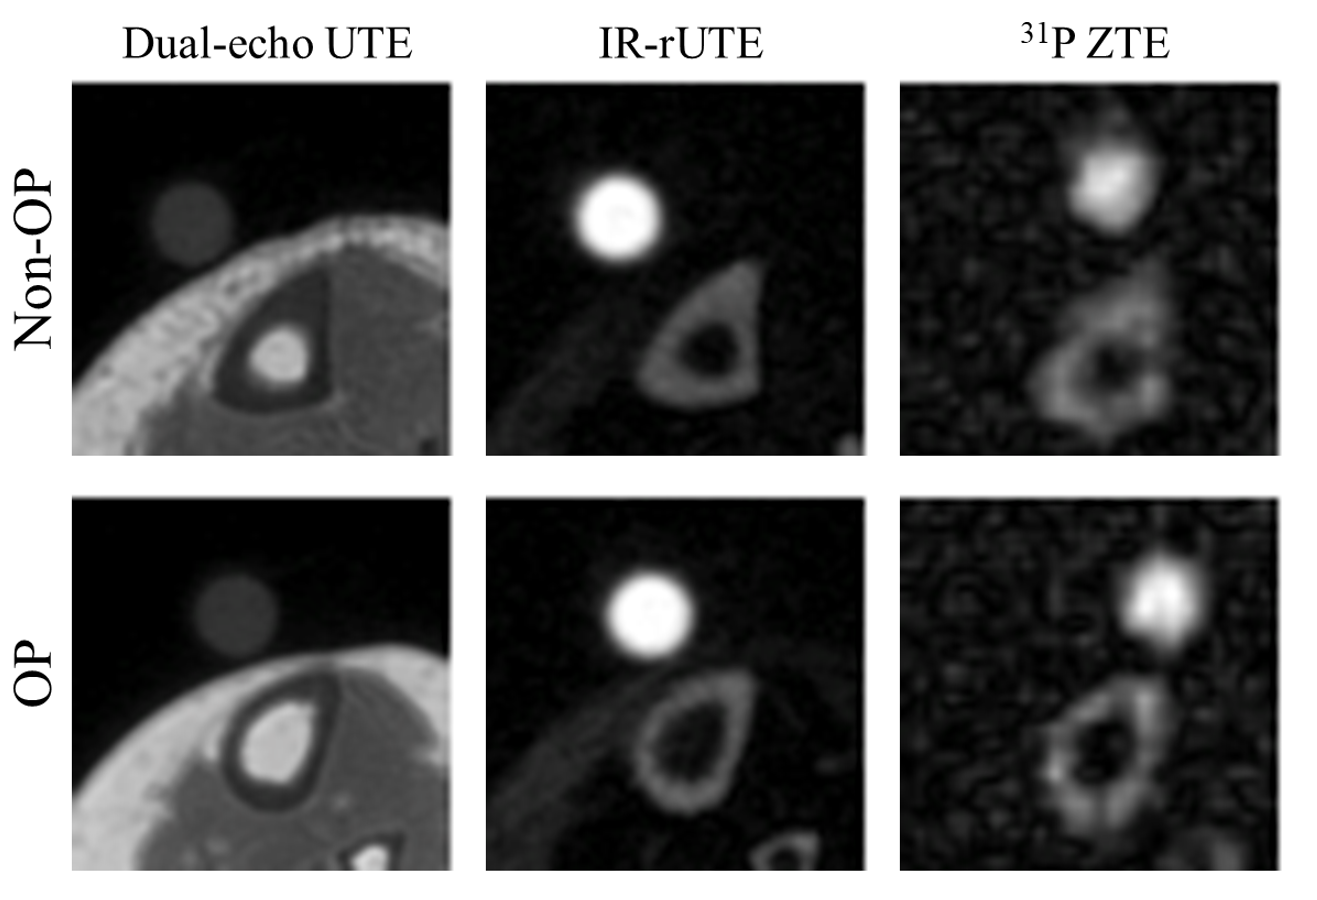
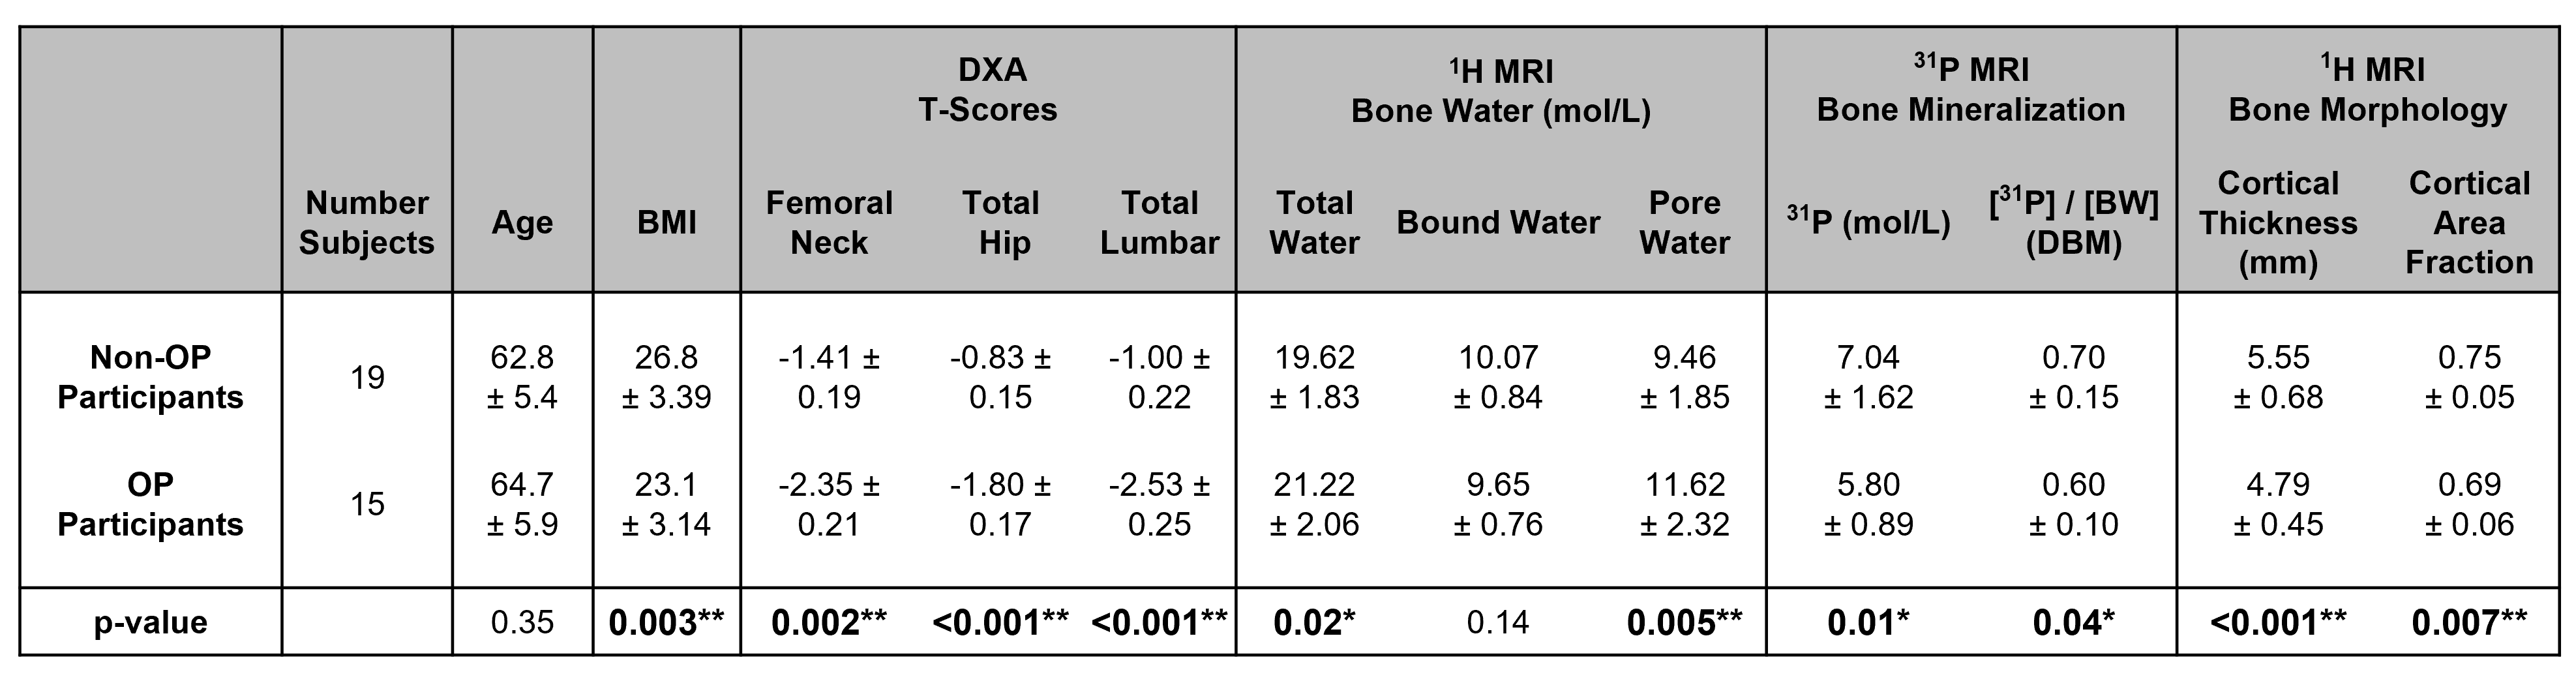
We recruited 15 treatment-naïve-osteoporotic (OP) and 19 age-matched-healthy (Non-OP) postmenopausal women in compliance with IRB protocols. The OP group was treated with a yearly injection of zoledronic acid following baseline evaluation. We have so far re-evaluated 12 OP and 12 Non-OP participants at 1-year follow-up. All participants were scanned at 3.0T (TIM Trio, Siemens, Erlangen, Germany) with a custom-built dual-tuned, transmit/receive 31P/1H birdcage calf coil (Rapid Biomedical, Rimpar, Germany). Three customized MR pulse sequences developed previously[7, 13, 14] were used to quantify concentrations of bone water and 31P density: (1) 1H dual-echo radial-UTE sequence was employed for measuring total bone water (TW), (2) bound water (BW) was quantified with 1H IR-prepared rapid radial-UTE (IR-rUTE) sequence, and (3) 31P was imaged with a custom-designed ZTE-PETRA[14] sequence (Figures 1-2). Reference samples of 1H and 31P (description in Figure 1) were placed adjacent to the tibia during MRI scans to calculate absolute concentrations. Signal intensity correction was performed based on measured relaxation constants[8, 10, 15] before using the following equation for quantification: $$\rho_{bone} = \rho_{ref} \frac{I_{bone}*F_{ref}}{ I_{ref}*F_{bone}} *e^{-TE \left( \frac{1}{T_{2,ref}^*} - \frac{1}{T_{2,bone}^*} \right)}$$, where ρ and I represent density and image voxel intensity, F are mapping functions that account for magnetization losses during excitation, respectively[7, 16]. PW was then calculated by subtracting BW from TW. The [31P]/[BW] concentration ratio was previously proposed as a surrogate for the degree of mineralization of bone (DBM)[9]. Manual contouring was performed on the second echo UTE image and cortical thickness was calculated based on previously established methods[11]. Cortical area fraction (CAF) was calculated as the ratio of the cortical area over the periosteal area. Significance was determined via one-way ANOVA in JMP16.0, with two significance thresholds at P<0.05 and P<0.01, corresponding to one and two asterisks, respectively.RESULTS
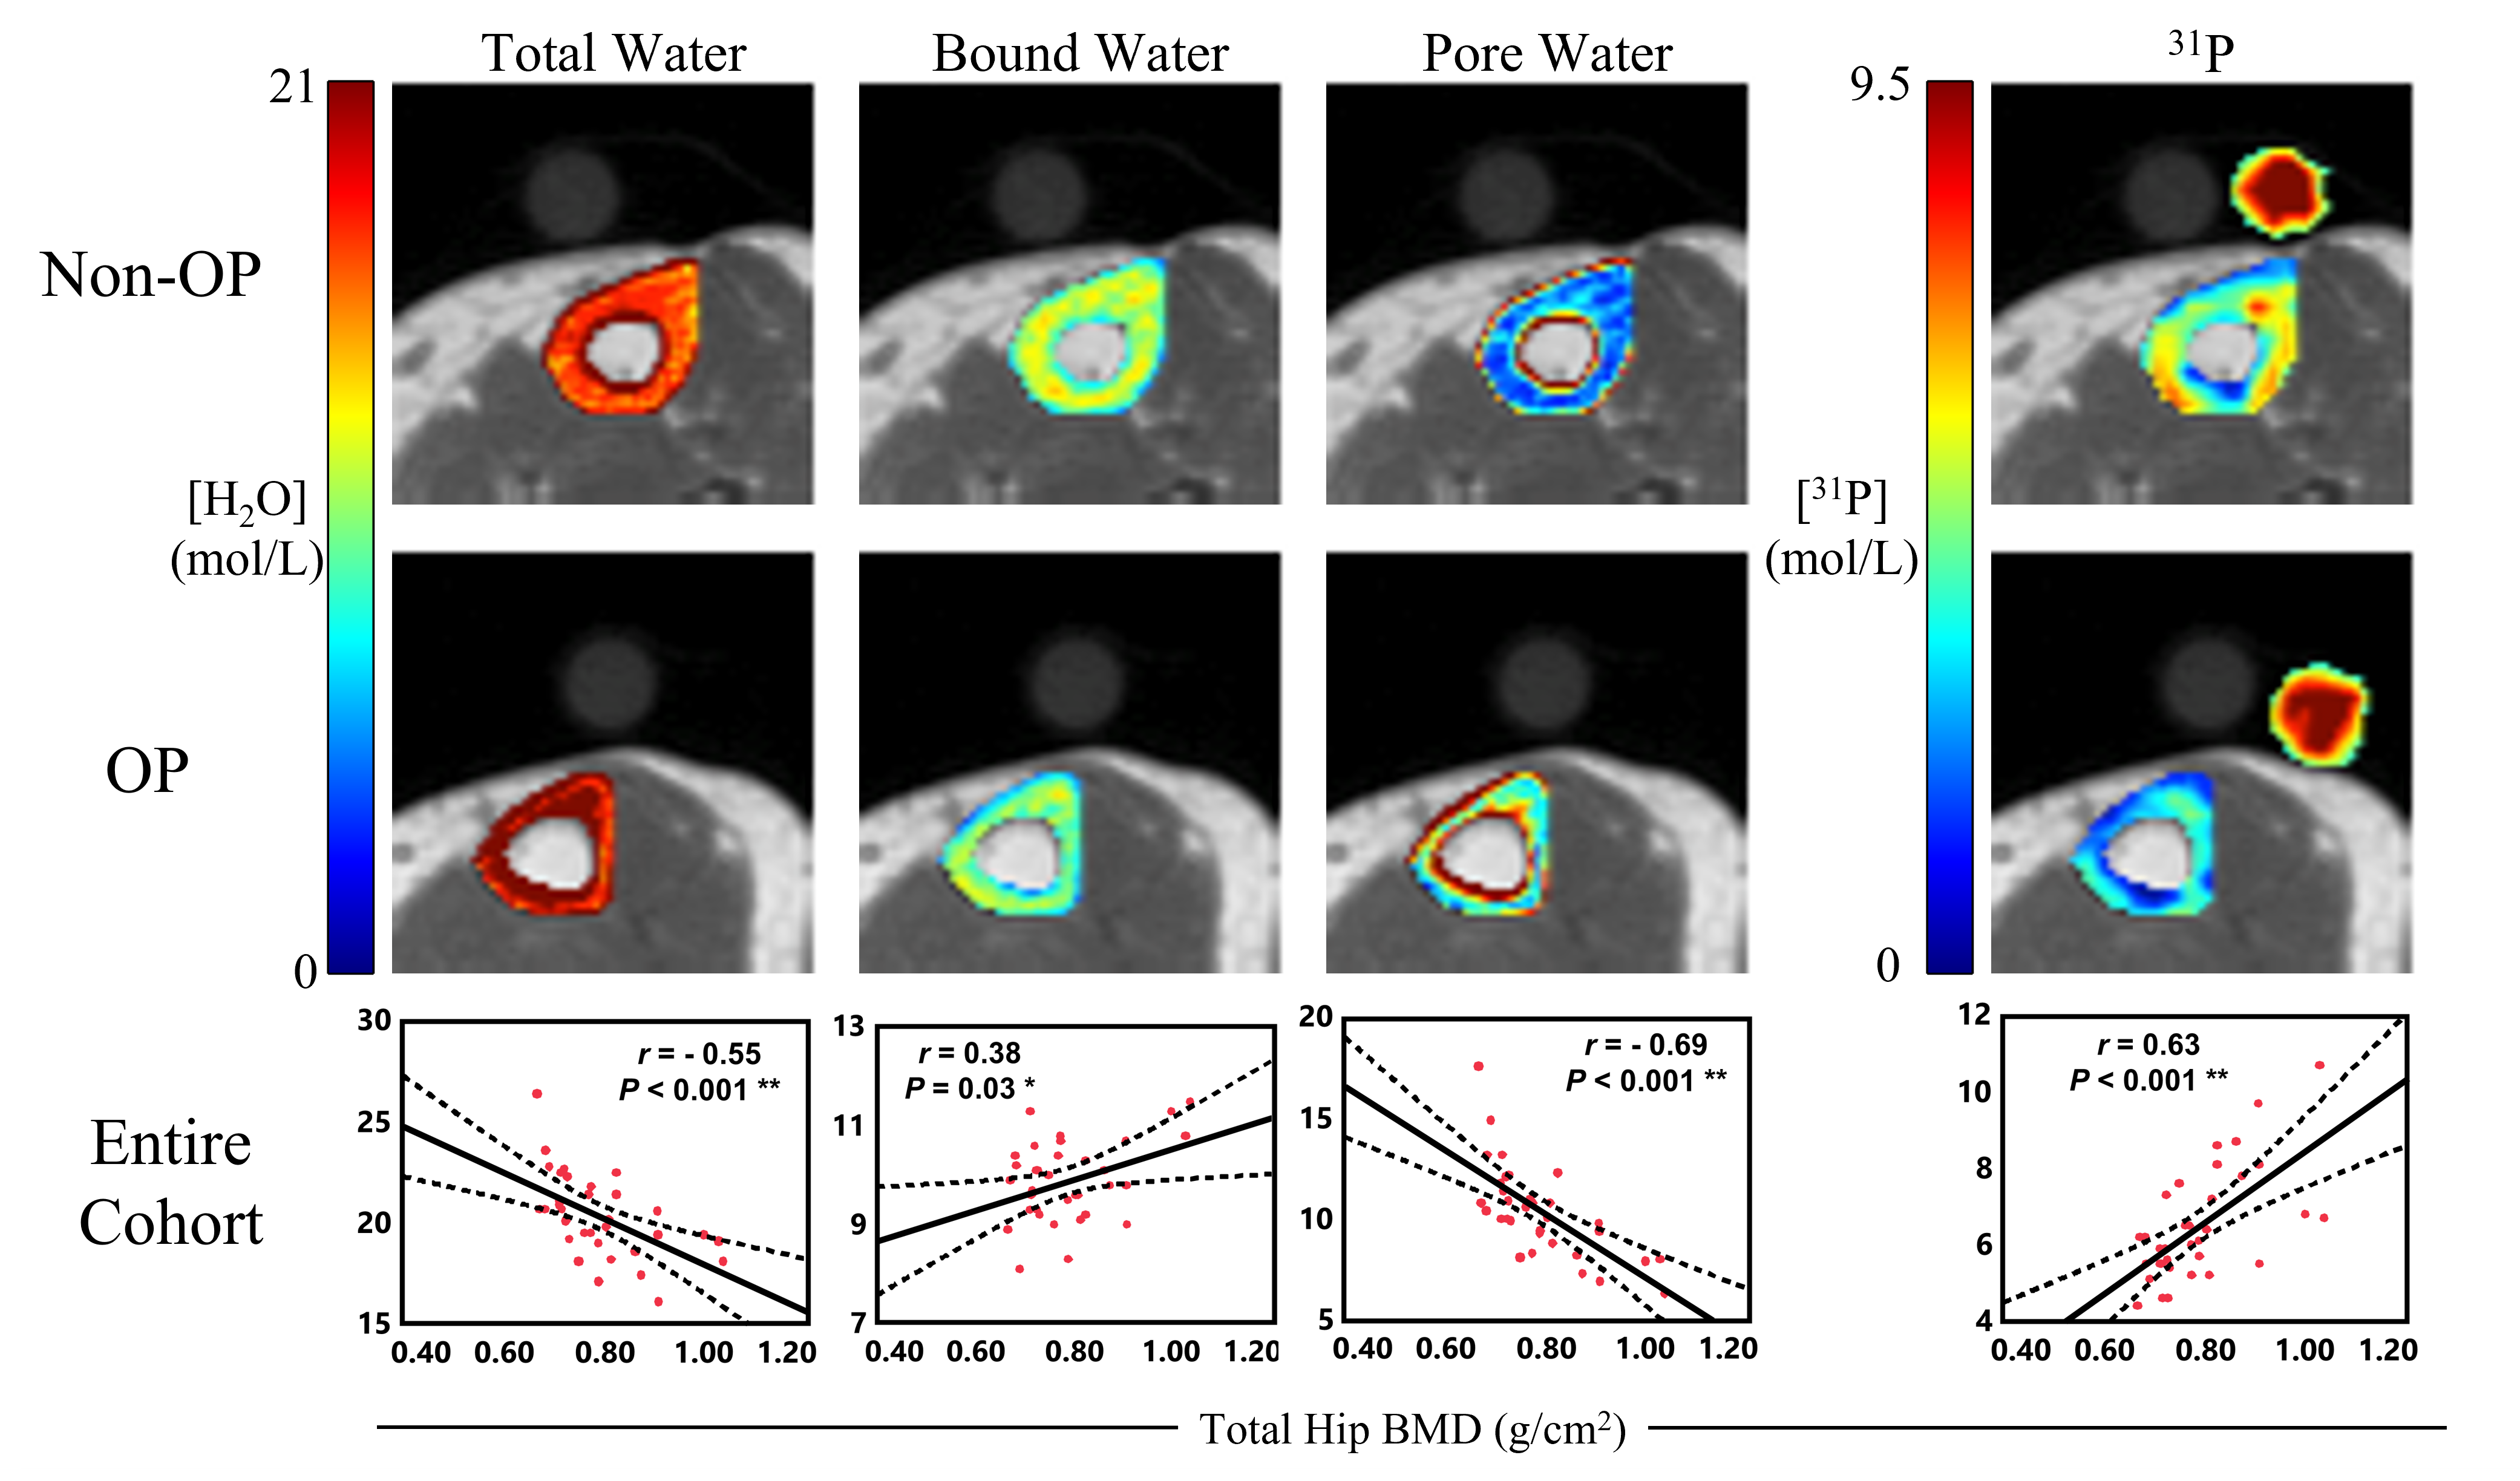
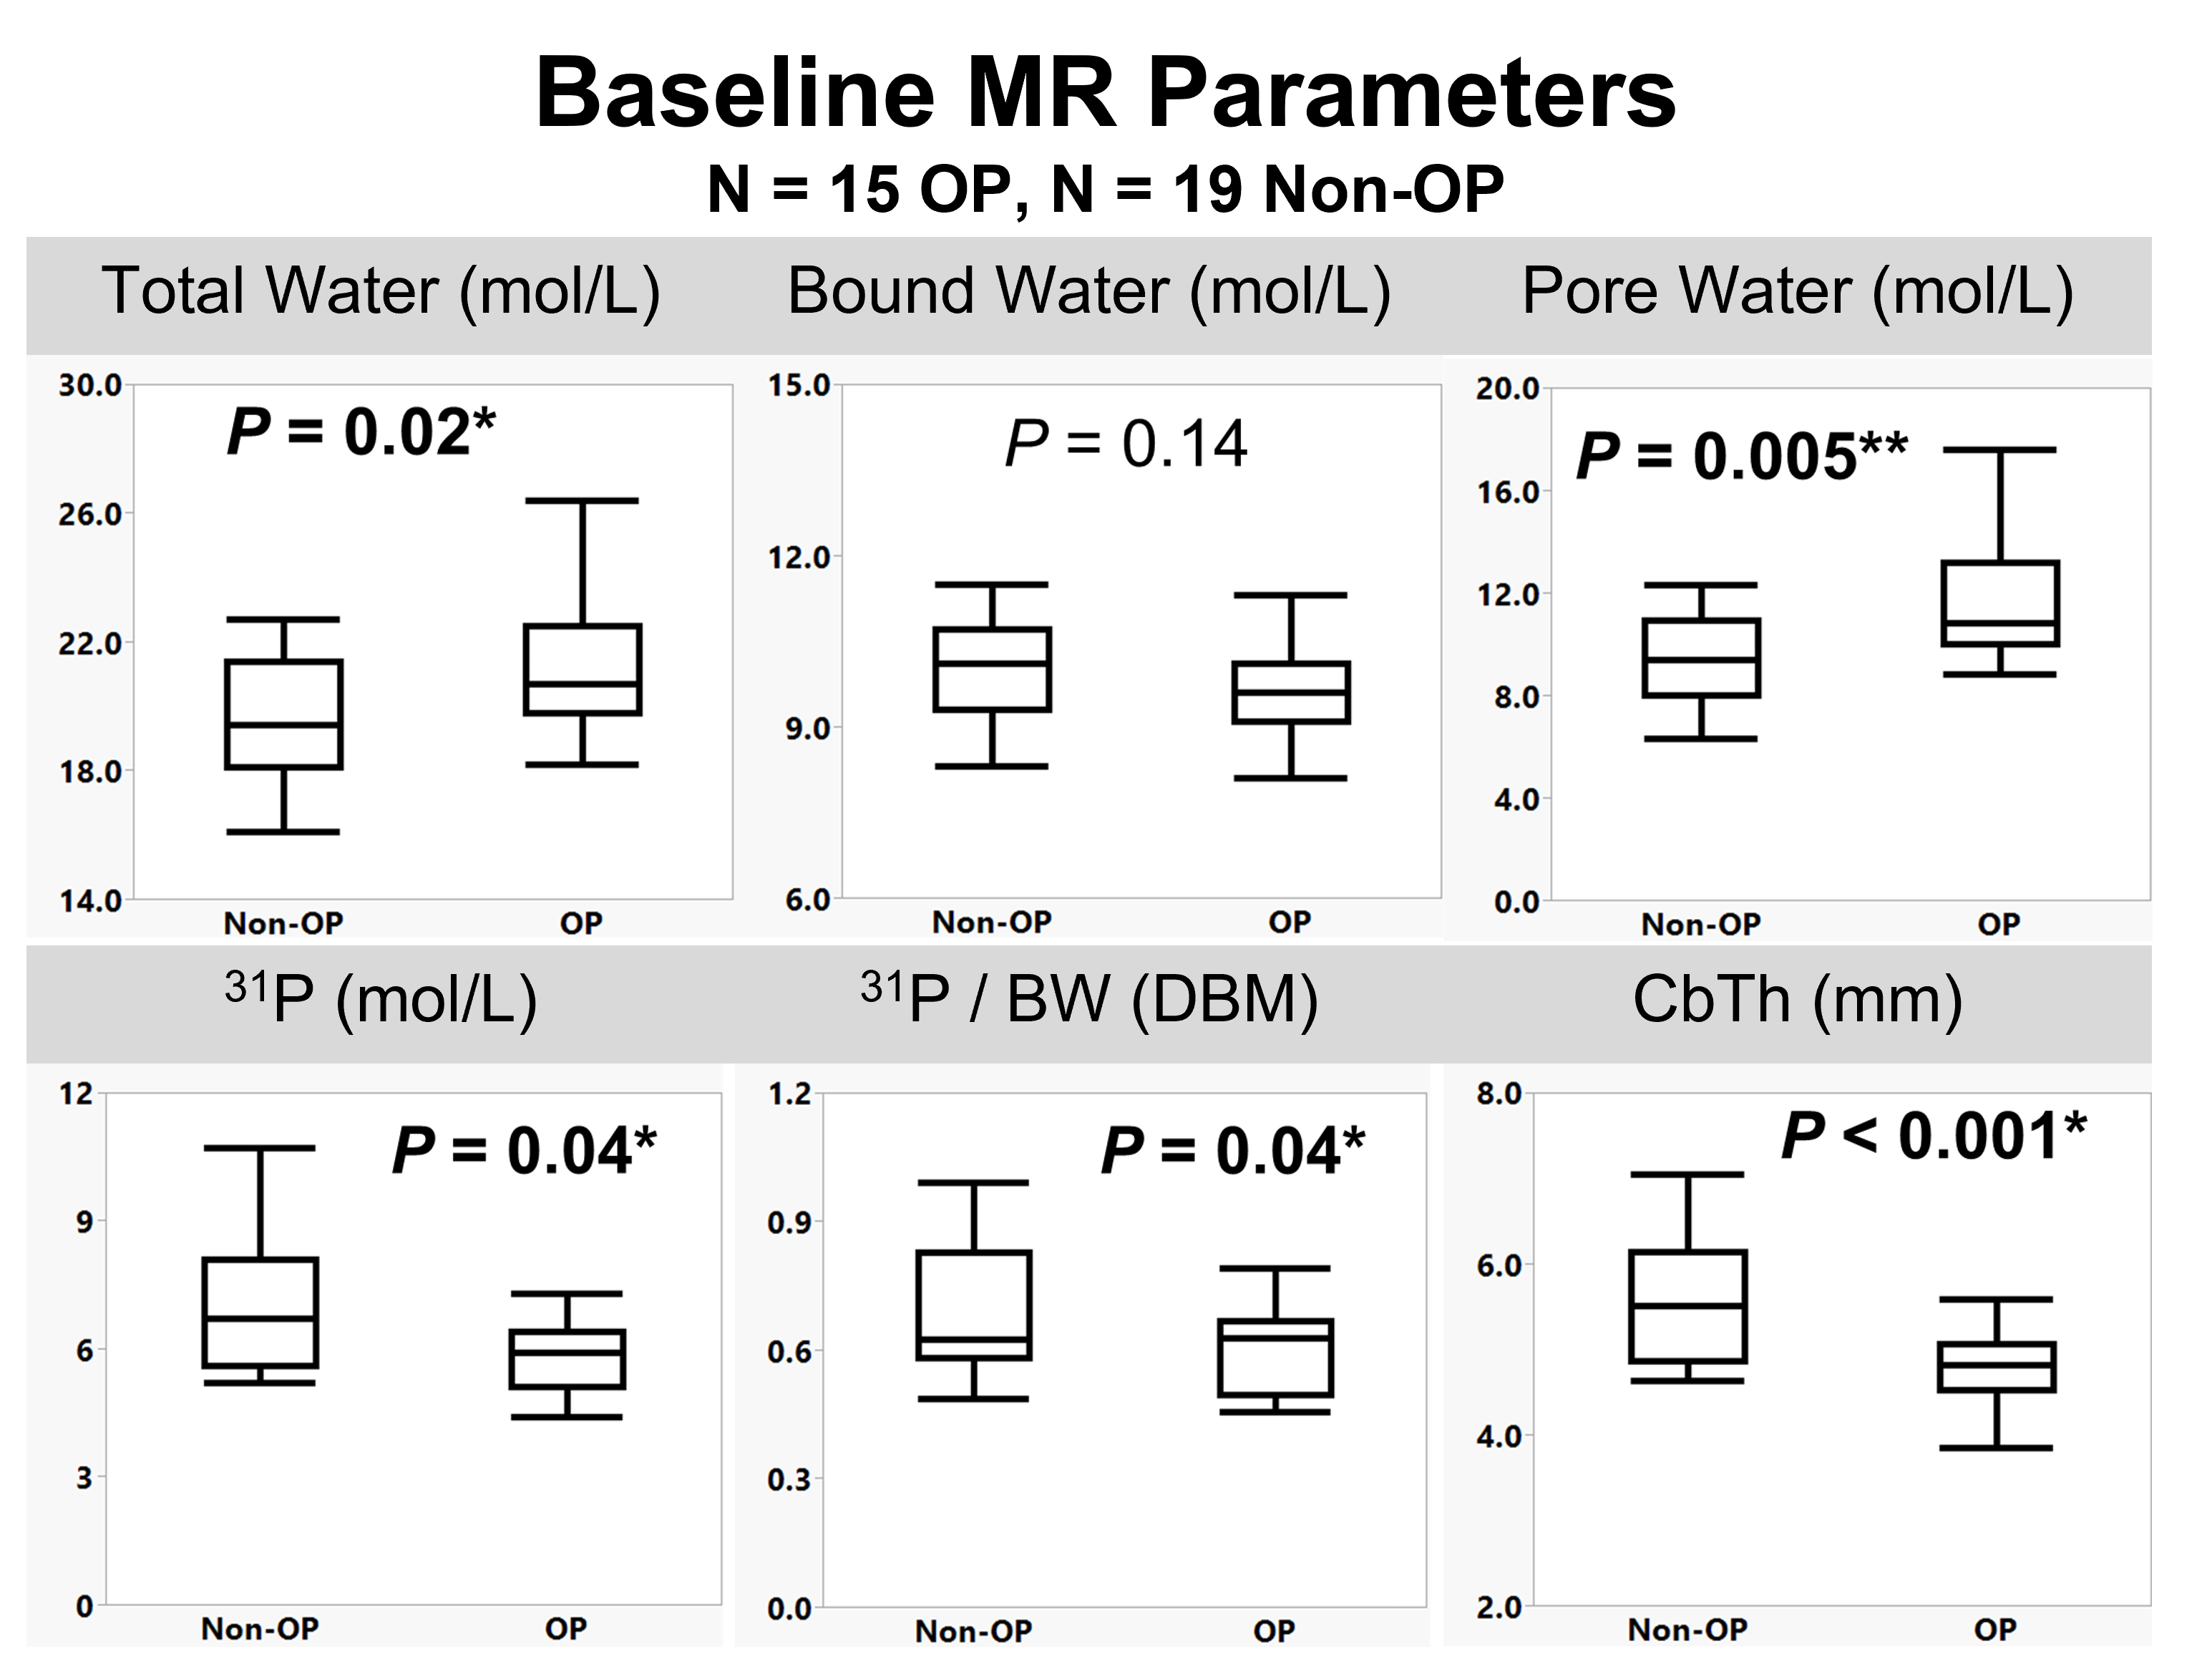
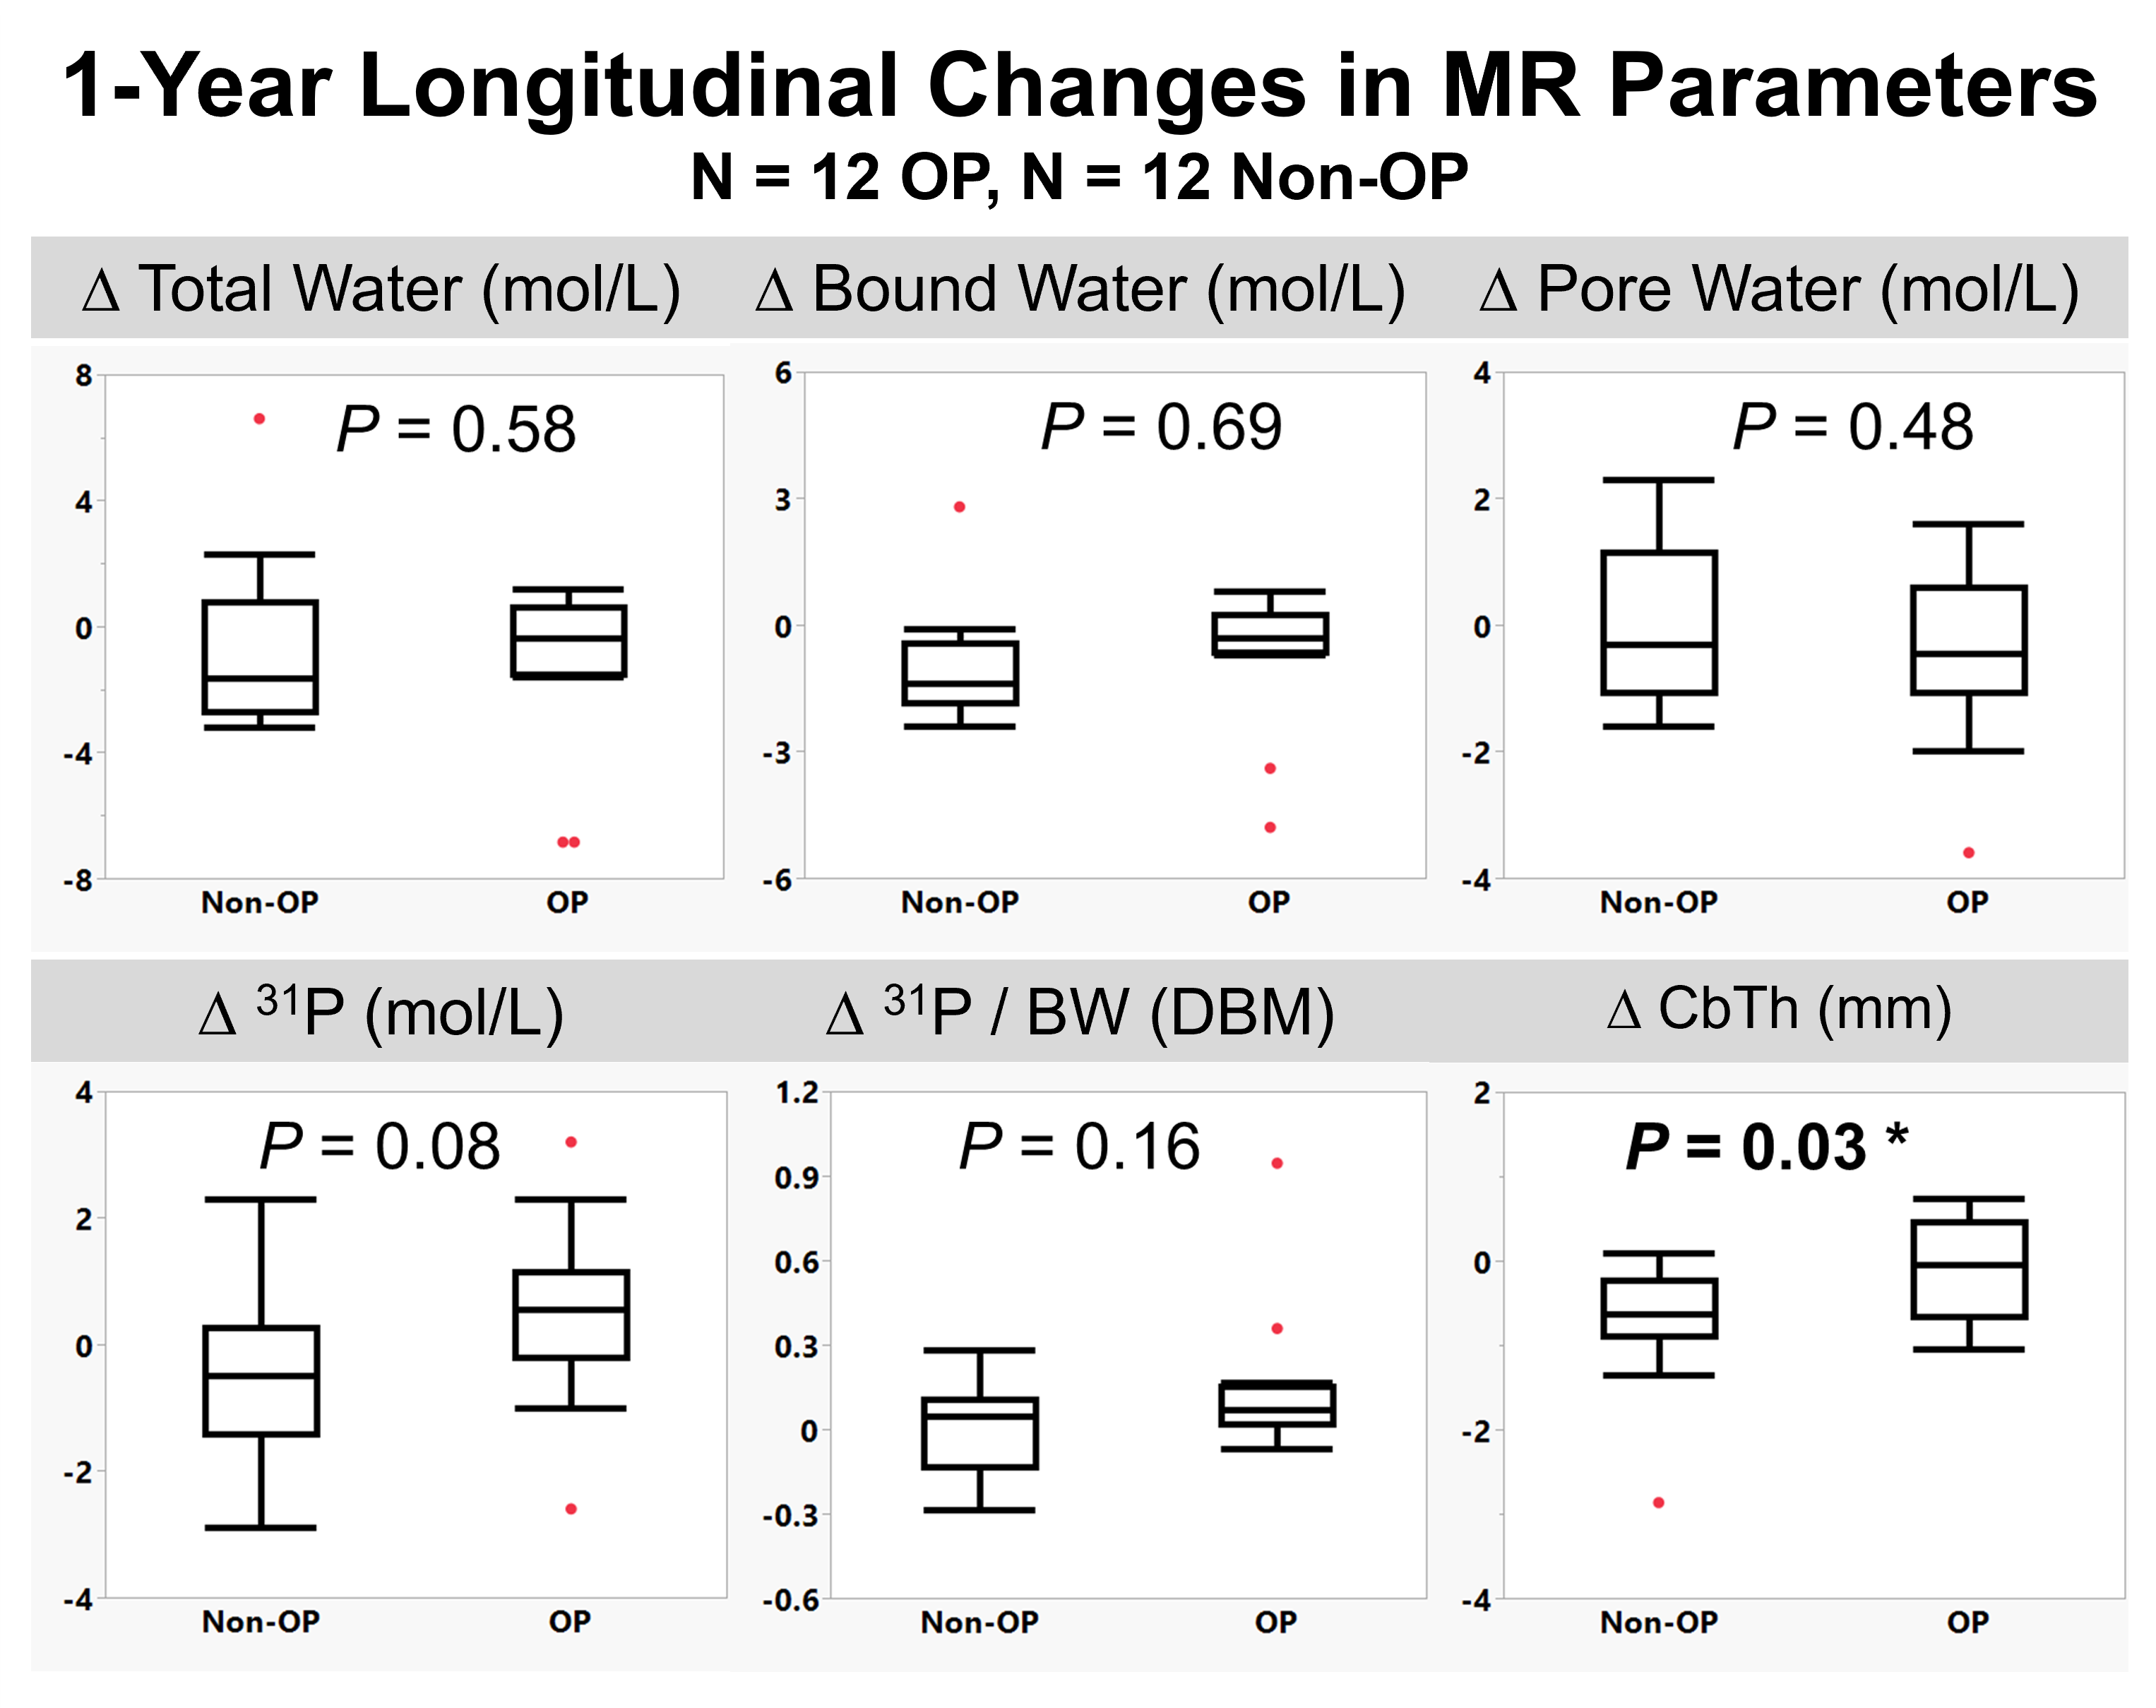
Representative images for each pulse sequence are shown for an OP and a Non-OP participant in Figure 1. MR parametric maps are displayed in Figure 2. All MR parameters were significantly associated with DXA-derived Total Hip aBMD at baseline, with BW and 31P being proportional to bone density while TW and PW were inversely related to bone density (Figure 2). Table 3 details baseline differences between OP and Non-OP groups, with significant differences shown in all 1H and 31P MR parameters except BW. Preliminary results of 1-year longitudinal changes following osteoporotic treatment are shown in Figure 5. Treatment was associated with a significant increase in CbTh (P = 0.03*).DISCUSSION
The data presented comprise preliminary results of the first study to evaluate cortical bone microstructural and mineralization MR biomarkers to gain insight into the ultrastructural implications of degenerative bone disease. As expected, we found that PW, a surrogate of bone porosity, was elevated in the OP group. Similarly, we found that OP subjects had a reduction in both 31P content and the 31P/BW ratio, suggesting that OP is associated with an impairment in bone quality in addition to the amount of bone. The morphometric parameter CbTh showed the largest difference between groups at baseline and was the only parameter to show significant changes following treatment. Although there were no significant treatment effects found for the other MR parameters, BW, PW, 31P, and 31P/BW are all trending in the expected directions.CONCLUSION
Cortical bone MR biomarkers obtainable clinically, provide new insight into the pathogenesis of bone disease and possibly reversal in response to drug treatment.Acknowledgements
NIH R01-AR50068, T32-EB020087, F31-AR079925References
1. Bolotin, H.H., The significant effects of bone structure on inherent patient-specific DXA in vivo bone mineral density measurement inaccuracies. Med Phys, 2004. 31(4): p. 774-88.
2. Marshall, D., O. Johnell, and H. Wedel, Meta-analysis of how well measures of bone mineral density predict occurrence of osteoporotic fractures. Bmj, 1996. 312(7041): p. 1254-9.
3. Ruppel, M.E., L.M. Miller, and D.B. Burr, The effect of the microscopic and nanoscale structure on bone fragility. Osteoporosis International, 2008. 19(9): p. 1251-1265.
4. Boskey, A.L., Bone composition: relationship to bone fragility and antiosteoporotic drug effects. Bonekey Rep, 2013. 2: p. 447.
5. Lespessailles, E., R. Hambli, and S. Ferrari, Osteoporosis drug effects on cortical and trabecular bone microstructure: a review of HR-pQCT analyses. BoneKEy reports, 2016. 5: p. 836-836.
6. Zebaze, R.M., et al., Differing effects of denosumab and alendronate on cortical and trabecular bone. Bone, 2014. 59: p. 173-9.
7. Zhao, X., et al., Feasibility of assessing bone matrix and mineral properties in vivo by combined solid-state 1H and 31P MRI. PLoS One, 2017. 12(3): p. e0173995.
8. Rad, H.S., et al., Quantifying cortical bone water in vivo by three-dimensional ultra-short echo-time MRI. NMR Biomed, 2011. 24(7): p. 855-64.
9. Seifert, A.C., et al., Bone mineral (31)P and matrix-bound water densities measured by solid-state (31)P and (1)H MRI. NMR Biomed, 2014. 27(7): p. 739-48.
10. Seifert, A.C., S.L. Wehrli, and F.W. Wehrli, Bi-component T2 * analysis of bound and pore bone water fractions fails at high field strengths. NMR Biomed, 2015. 28(7): p. 861-72.
11. Rajapakse, C.S., et al., Micro-MR imaging-based computational biomechanics demonstrates reduction in cortical and trabecular bone strength after renal transplantation. Radiology, 2012. 262(3): p. 912-20.
12. Seifert, A.C., et al., A Surrogate Measure of Cortical Bone Matrix Density by Long T2 -Suppressed MRI. J Bone Miner Res, 2015. 30(12): p. 2229-38.
13. Li, C., et al., Comparison of optimized soft-tissue suppression schemes for ultrashort echo time MRI. Magn Reson Med, 2012. 68(3): p. 680-9.
14. Li, C., et al., Selective in vivo bone imaging with long-T2 suppressed PETRA MRI. Magn Reson Med, 2017. 77(3): p. 989-997.
15. Wu, Y., et al., Bone mineral imaged in vivo by 31P solid state MRI of human wrists. J Magn Reson Imaging, 2011. 34(3): p. 623-33.
16. Techawiboonwong, A., et al., Cortical bone water: in vivo quantification with ultrashort echo-time MR imaging. Radiology, 2008. 248(3): p. 824-833.
Figures