1593
Predicting response to neoadjuvant therapy using tumor morphologic features on breast MRI
Wen Li1, Rohan Nadkarni1, David C Newitt1, Natsuko Onishi1, Jessica Gibbs1, Lisa J Wilmes1, Bonnie N Joe1, Efstathios D Gennates2, John Kornak2, Mark Magbanua3, Laura van't Veer3, Barbara LeStage4, I-SPY 2 Consortium5, Laura J Esserman6, and Nola M Hylton1
1Radiology & Biomedical Imaging, University of California, San Francisco, San Francisco, CA, United States, 2Epidemiology & Biostatistics, University of California, San Francisco, San Francisco, CA, United States, 3Laboratory Medicine, University of California, San Francisco, San Francisco, CA, United States, 4I-SPY 2 Advocacy Group, San Francisco, CA, United States, 5Quantum Leap Healthcare Collaborative, San Francisco, CA, United States, 6Surgery, University of California, San Francisco, San Francisco, CA, United States
1Radiology & Biomedical Imaging, University of California, San Francisco, San Francisco, CA, United States, 2Epidemiology & Biostatistics, University of California, San Francisco, San Francisco, CA, United States, 3Laboratory Medicine, University of California, San Francisco, San Francisco, CA, United States, 4I-SPY 2 Advocacy Group, San Francisco, CA, United States, 5Quantum Leap Healthcare Collaborative, San Francisco, CA, United States, 6Surgery, University of California, San Francisco, San Francisco, CA, United States
Synopsis
Functional tumor volume (FTV) has been used to longitudinally assess tumor response to neoadjuvant therapy longitudinally in I-SPY trials. Previously, we found that a single 3D shape feature, sphericity, is associated with pathologic complete response (pCR). In this study, we expanded the analysis by including all radiomic shape features in an elastic net model and evaluated their role in prediction of pCR in the multi-center I-SPY 2 trial. Our results showed that the model with shape features outperformed the models with FTV or sphericity alone.
Introduction
DCE-MRI is an accurate imaging method to assess tumor response to neoadjuvant therapy (NAT) for breast cancer1. Functional tumor volume (FTV)2,3, a 3D tumor volume measurement using contrast enhancement thresholds, has been used in I-SPY 2 for longitudinal assessment of tumor response. Previous studies showed association between tumor sphericity (quantifying how close a 3D object is to a perfect sphere) and pathologic complete response (pCR)4. A subsequent study demonstrated that multi-feature models combining FTV, sphericity, contralateral background parenchymal enhancement, and longest diameter achieved higher area under the ROC curve (AUC) than models using single features, both in the full cohort and by hormone receptor (HR) / human epidermal growth factor receptor 2 (HER2) subtype5. This work expanded the analysis by including all radiomic shape features in an elastic net model and evaluated their role in prediction of pCR in the multi-center I-SPY 2 trial.Methods
Patients enrolled and randomized to receive treatment in the I-SPY 2 trial before October 2016 were included. DCE-MRI exams were performed at pretreatment (T0) and early treatment (T1) time points at participating sites (n=22) with a 1.5T or 3T scanner. The same scanner and protocol were used to acquire MRI for the same patient at different visits. Gadolinium contrast agent was administrated intravenously at a dose of 0.1 mmol/kg body weight, and at a rate of 2 mL/second, followed by a 20 mL saline flush. Early percent enhancement (PE) map and signal enhancement ratio (SER) map were derived from the DCE-MRI. PE=100*(S1-S0)/S0 and SER=(S1-S0)/(S2-S0), where S0, S1, and S2 are pixel intensity from pre-contrast, early, and late post-contrast phases, respectively. Tumor masks were generated by thresholding PE and SER maps inside a 3-dimensional rectangular region-of-interest (ROI). Functional tumor volume was calculated using the sum of voxel volumes within the tumor mask. Pyradiomics 6 was then used to extract 17 3-dimensional shape features, following the Image Biomarker Standardization Initiative (IBSI) guidance 7. Among 17 shape features, 2 are volumetric measurements (voxel volume and mesh volume), 7 features quantify how close the tumor shape is to a sphere, 6 length measurements, and surface area.All shape features and FTV values were transformed by log(x+1), scaled, and centered. Elastic net was used to analyze association between radiomic features or FTV with pathologic outcome assessed at surgery. Demographic data including age, race, menopausal status, and hormone receptor (HR) / human epidermal growth factor receptor 2 (HER2) status, were also included in the model. Model training and testing was performed using nested cross-validation. Hyperparameters lambda (sequence generated by glmnet) and alpha (0 to 1 with step of 0.2) were tuned using 5-fold cross-validation of each training set. Model performance was assessed using 10-fold cross-validation of the entire sample. All model training was performed using the rtemis package in R (version 4.0.5). Mean AUC (± standard deviation, SD) and mean balanced accuracy (± SD) of testing folds were calculated for predicting pCR. AUC and balanced accuracy were compared for 3 models of MRI features plus demographics. MRI features included were sphericity at T1 (Model 1), FTV ratio between T1 and T0 (Model 2), all 17 shape features (Model 3).
Results
A total of 910 patients that had radiomic shape features and FTV at both T0 and T1, and pathologic outcomes were included in the analysis. Table 1 shows comparison of AUCs and balanced accuracies of 3 models. Apparently, Model 3 achieved the highest AUC (0.73 ± 0.04) and balanced accuracy (0.66 ± 0.03). Figure 1 shows top 10 variables evaluated by Model 3. Tumor volumes (both voxel volume and mesh volume) were among the top 10 variables for predicting pCR. Maximum 2D diameter column, surface volume ratio, and least axis length were also among the top 10.Discussion
Radiomic shape features include volumetric measurement, sphericity, and other morphologic features of the tumor. Our results showed that shape features achieved the best performance at predicting pCR compared to models with FTV or sphericity alone evaluated by the elastic net model. This finding suggests tumor morphologic features other than volume and sphericity may also be helpful to differentiate responders versus non-responders to NAT. Additional machine learning algorithms - Random Forest, Classification and Regression Trees, and Gradient Boosting, were also evaluated and all produced similar results.Conclusion
This multi-center study showed that radiomic shape features extracted from MRI at early treatment time point had higher AUC and balanced accuracy for predicting pCR than FTV. Continuing studies are investigating additional benefit of texture features to further improve predictive performance.Acknowledgements
NIH/NCI R01 CA132870, U01 CA225427, P01 CA210961, R01 CA255442References
- Lobbes, M. B. I. et al. The role of magnetic resonance imaging in assessing residual disease and pathologic complete response in breast cancer patients receiving neoadjuvant chemotherapy: a systematic review. Insights Imaging 4, 163–75 (2013).
- Hylton, N. M. et al. Locally advanced breast cancer: MR imaging for prediction of response to neoadjuvant chemotherapy--results from ACRIN 6657/I-SPY TRIAL. Radiology 263, 663–72 (2012).
- Hylton, N. M. et al. Neoadjuvant Chemotherapy for Breast Cancer: Functional Tumor Volume by MR Imaging Predicts Recurrence-free Survival-Results from the ACRIN 6657/CALGB 150007 I-SPY 1 TRIAL. Radiology 279, 44–55 (2016).
- Li, W. et al. Tumor sphericity predicts response in neoadjuvant chemotherapy for invasive breast cancer. Tomography 6, 216–222 (2020).
- Li, W. et al. Predicting breast cancer response to neoadjuvant treatment using multi-feature MRI: results from the I-SPY 2 TRIAL. npj Breast Cancer 6, (2020).
- van Griethuysen, J. J. M. et al. Computational Radiomics System to Decode the Radiographic Phenotype. Cancer Res. 77, e104–e107 (2017).
- Zwanenburg, A. et al. The Image Biomarker Standardization Initiative: Standardized Quantitative Radiomics for High-Throughput Image-based Phenotyping. Radiology 191145 (2020)
Figures
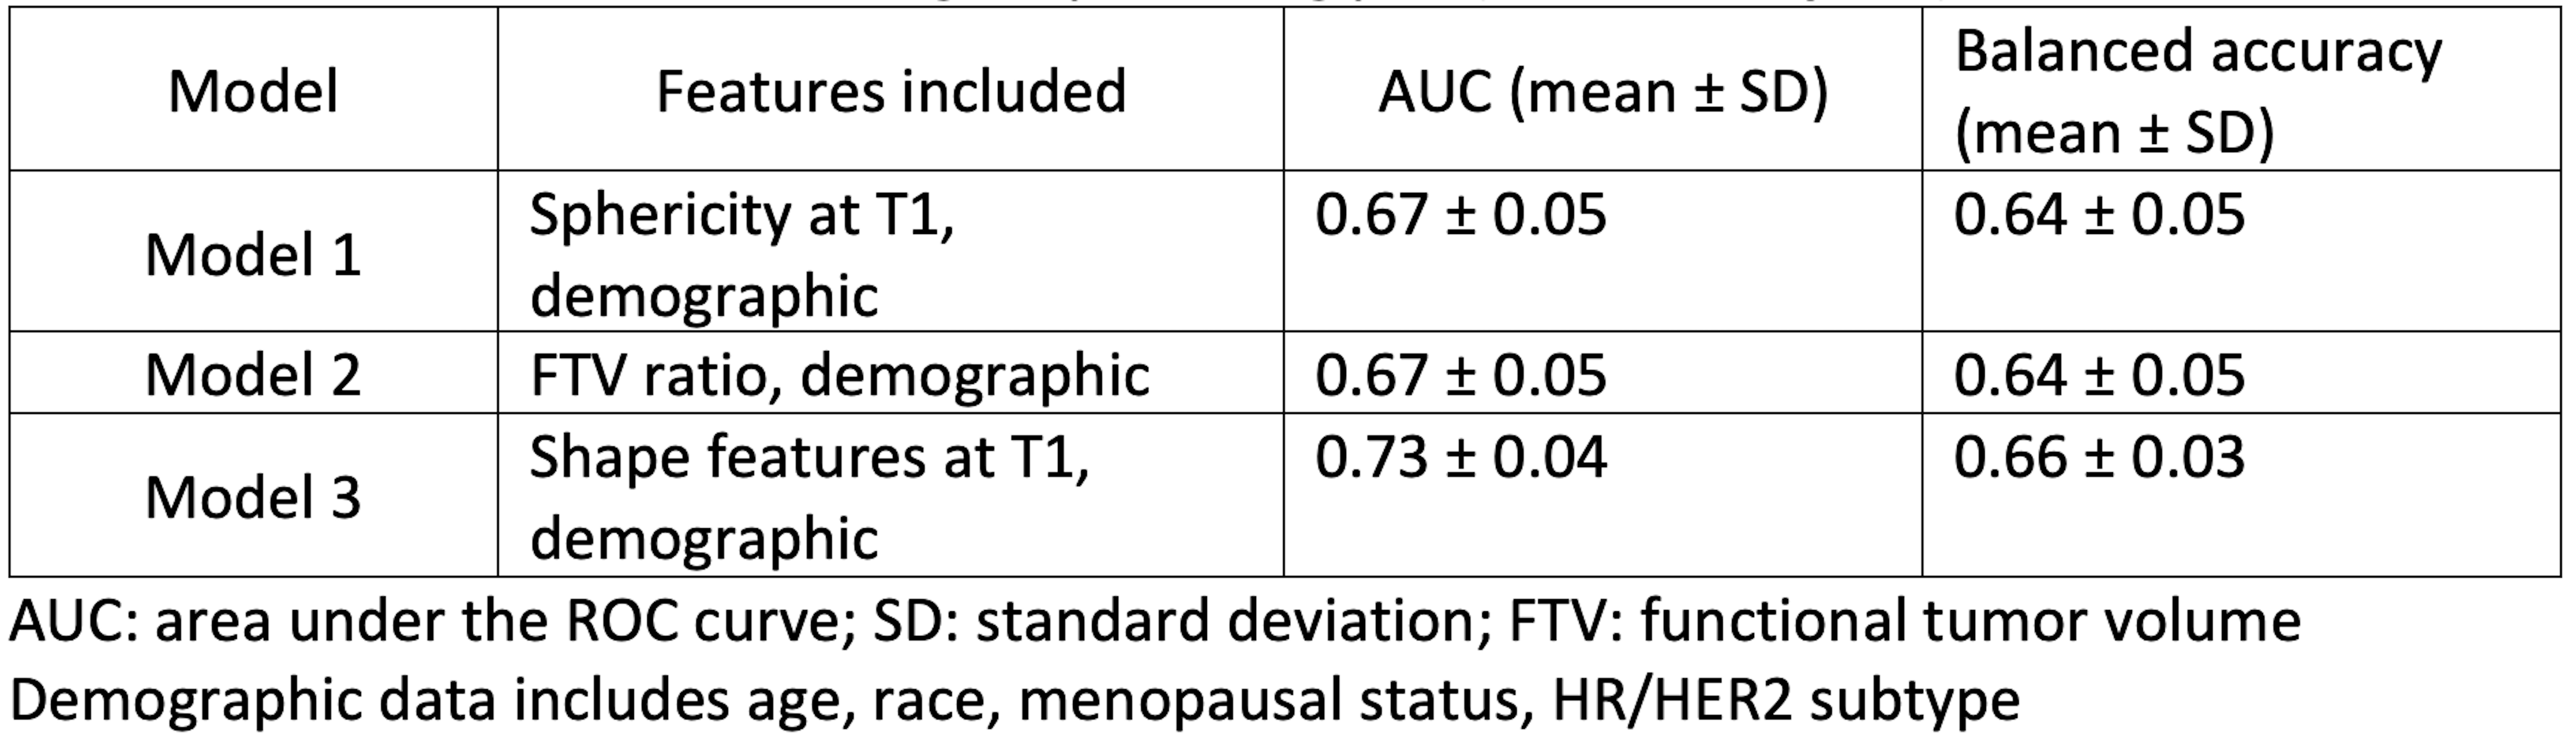
Table 1 results for elastic net tuning for predicting pCR (n=910, 315 pCRs)
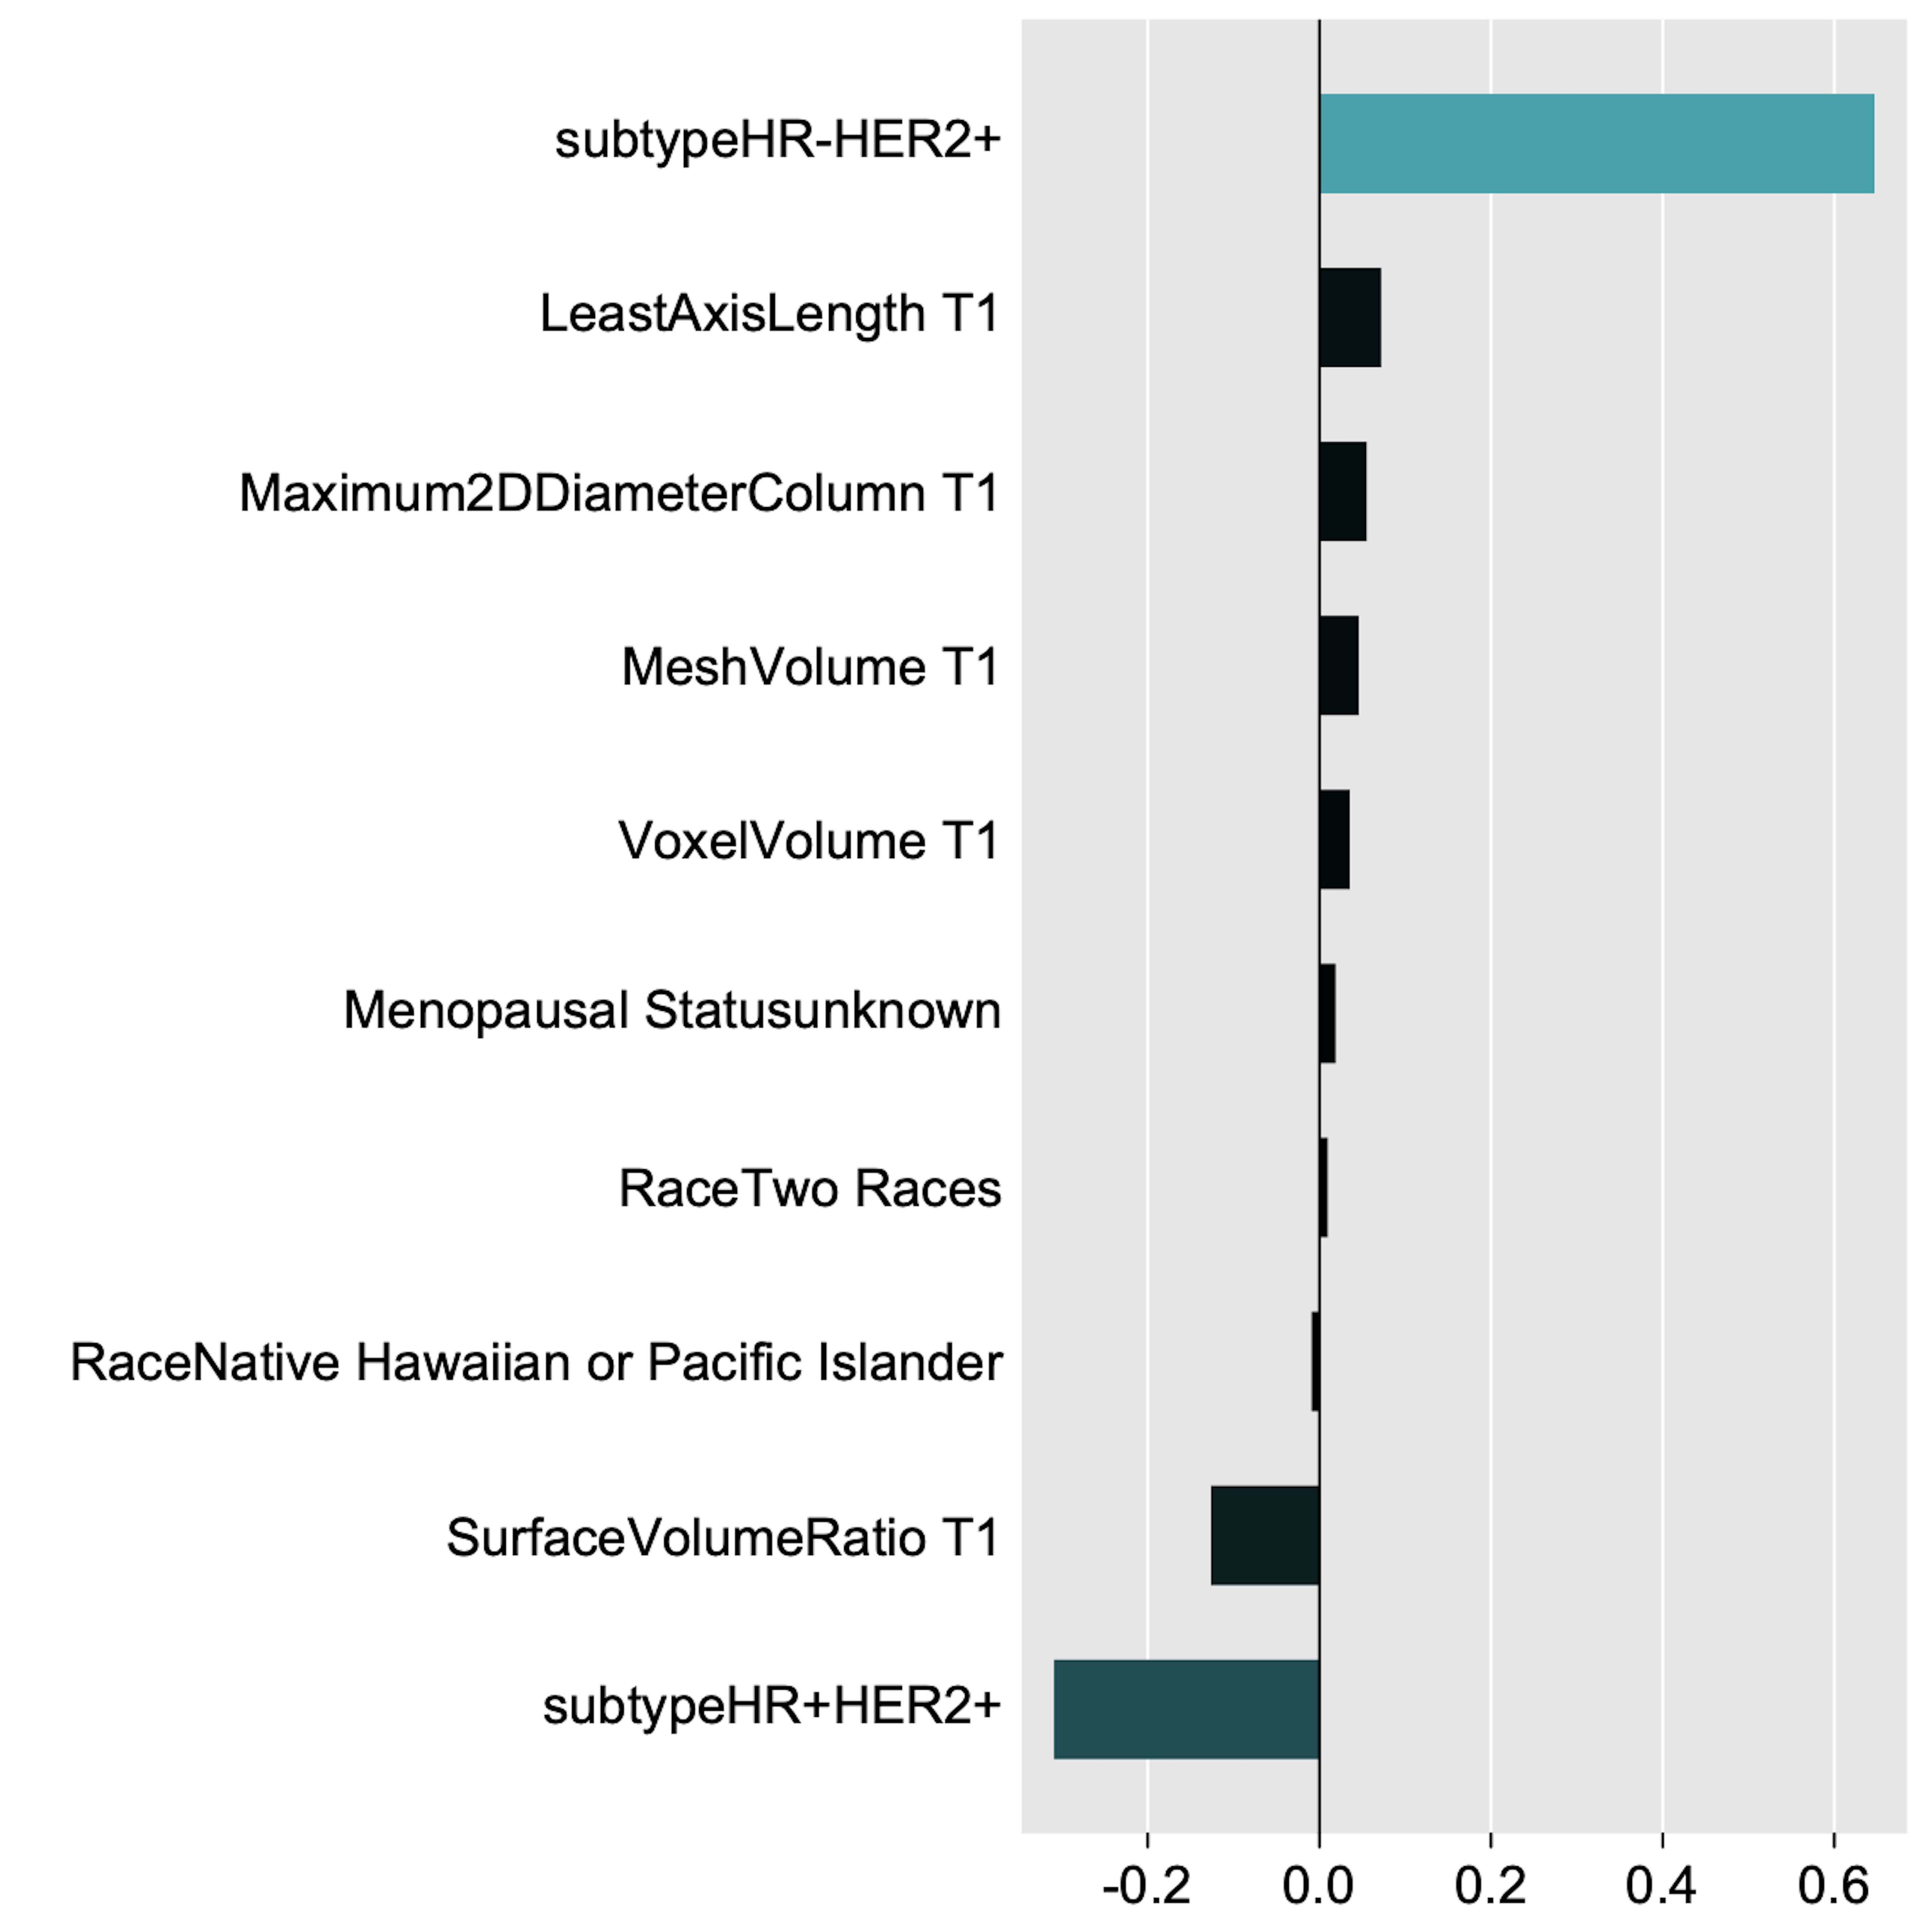
Figure 1 Elastic Net standardized regression coefficients
DOI: https://doi.org/10.58530/2022/1593