1592
Monitoring the response of breast tumors to neoadjuvant chemotherapy using multimodal magnetic resonance and optical imaging – a case study
Bin Deng1,2,3, Ailis Muldoon1,2, Pedro Itriago4, Wei-Ching Lo5, Mansi Saksena2,3, Samuel Patz3,6, Ralph Sinkus7, Steven J. Isakoff3,8, and Stefan A. Carp1,2,3
1Athinoula A. Martinos Center for Biomedical Imaging, Massachusetts General Hospital, Charlestown, MA, United States, 2Department of Radiology, Massachusetts General Hospital, Boston, MA, United States, 3Harvard Medical School, Boston, MA, United States, 4Siemens Medical Solutions, Houston, TX, United States, 5Siemens Medical Solutions, Boston, MA, United States, 6Department of Radiology, Brigham and Women’s Hospital, Boston, MA, United States, 7Laboratory for Vascular Translational Science (LVTS), Institut National de la Santé et de la Recherche Médicale (INSERM), Paris, France, 8Cancer Center, Massachusetts General Hospital, Boston, MA, United States
1Athinoula A. Martinos Center for Biomedical Imaging, Massachusetts General Hospital, Charlestown, MA, United States, 2Department of Radiology, Massachusetts General Hospital, Boston, MA, United States, 3Harvard Medical School, Boston, MA, United States, 4Siemens Medical Solutions, Houston, TX, United States, 5Siemens Medical Solutions, Boston, MA, United States, 6Department of Radiology, Brigham and Women’s Hospital, Boston, MA, United States, 7Laboratory for Vascular Translational Science (LVTS), Institut National de la Santé et de la Recherche Médicale (INSERM), Paris, France, 8Cancer Center, Massachusetts General Hospital, Boston, MA, United States
Synopsis
Functional imaging is advantageous in monitoring neoadjuvant chemotherapy (NACT) since changes in tumor physiology manifest earlier than actual tumor shrinkage. We leveraged a custom breast coil for multimodal T1, DWI, MRE, and near-infrared optical imaging to evaluate the response of breast tumors to NACT. In this case study of a patient who achieved pathologic complete response, concordant changes in tumor size, ADC, stiffness and total hemoglobin concentration have been observed. This multiparametric approach could help us gain a comprehensive understanding of the multitude of simultaneous physiological changes in tumors related to microenvironment, angiogenesis, and metabolism as a result of NACT.
Introduction
Neoadjuvant chemotherapy (NACT) is the main treatment approach for the 20,000 patients diagnosed annually with locally advanced breast cancer1. However, after months of difficult-to-tolerate NACT treatment, only 8-50% of patients achieve a pathologic complete response (pCR), the only clinical outcome demonstrated to improve disease-free and overall survival2. There is a need and opportunity for the development of monitoring methods and biomarkers, especially those targeting functional status of cancerous tissue, for the early and accurate prediction of NACT outcome to tailor treatment on an individual basis. In this work, we leveraged a multimodal MRI, MR Elastography (MRE) and diffuse optical tomography (DOT) imaging platform to assess changes in several functional biomarkers of breast tumors to NACT. Using established and novel imaging methods synergistically with different biophysical bases we can simultaneously quantify multiple aspects of tumor physiology. MR methods such as dynamic contrast-enhanced (DCE) MRI and diffusion-weighted imaging (DWI) can provide information about vascular permeability, vessel density and tissue cellularity. The integration of DOT3, an optical imaging method with promising translation potential, enables direct quantification of blood volume and tissue oxygenation to provide complementary insight into angiogenesis and tumor hypoxia, a fundamentally important feature associated with chemotherapy resistance and poor clinical prognosis of solid tumors. Finally, MRE, an emerging novel MR technique that quantifies tissue viscoelasticity4, offers additional insight into the role of biomechanical factors in tumor physiology and treatment response.Methods
We have developed an 8-channel unilateral DOT-compatible breast coil with an integrated MRE actuator. As shown in Fig. 1, optical fibers are arranged on each side of a set of sagittal parallel plates with an MRE actuator placed in between. A tomographic optical imaging system (CW6, TechEn Inc., Milford, MA, USA) equipped with 32 continuous-wave sources (split evenly between 690nm and 830nm wavelengths) and 32 detector channels is used to acquire DOT measurements5 at 1Hz for 60s concurrently with T1 scans. The passive MRE actuator is driven through a fiberglass shaft by a home-build electromagnetic MRE transducer consisting of several turns of copper wire and is powered by a signal generator coupled to an audio power amplifier that plays back 30Hz sine waves when triggered by the eXpresso MRE pulse sequence6 operated on a 3T MRI scanner (MAGNETOM Skyra, Siemens Healthcare, Erlangen, Germany). The AC current established in the loop causes vibrations along the B0 direction that induce shear motion to the patient's breast. The imaging protocol includes typical T1- (0.8-mm iso) and T2-weighted (0.9×0.9×1.6 mm3 voxels) structural scans with simultaneous DOT acquisition, a multi-b-value DWI scan (b=0, 100, 600 and 800 s/mm2, 1.1×1.1×2.0 mm3 voxels) using a prototype diffusion sequence and MRE scan (2.0-mm iso). A 45-y.o. breast cancer patient with a triple-negative invasive ductal carcinoma measuring 23mm×18mm×14mm at the time of diagnosis was enrolled under a protocol approved by the IRB at the MGH Cancer Center. The patient participated in a clinical trial and achieved pCR after receiving 4 cycles of NACT with sacituzumab govitecan. Two multimodal imaging sessions were performed on the patient, one before the initiation of NACT (baseline) and the other before the initiation of the 3rd cycle of the treatment (pre-C3).Results and Discussion
Figs. 2 and 3 present the multimodal imaging results at baseline and pre-C3 respectively. From the clinical post-contrast peak enhancement images (subpanel a), acquired in separate imaging sessions as part of the patient’s standard of care, significant reduction in enhancement has been observed – from a mean of 85.39% to 37.90% within the tumor ROI listed in Table 1. Using clinical scans as references, tumor ROIs were drawn by a breast radiologist on the T1 images (subpanel b) acquired in research multimodal imaging sessions and subsequently overlaid on other co-registered modalities (subpanels c-e) to calculate statistics in Table 1. At baseline, the ADC map (Fig. 2c) clearly shows a region with restricted diffusion, indicating high cellularity as expected for locally advanced breast tumors. At pre-C3, an increase in ADC within the tumor ROI has been observed (Fig. 3c), probably as a result of morphologic changes associated with treatment-induced apoptosis such as cell shrinkage. For biomechanical properties, we expect to see a decrease in tumor stiffness. However, at baseline, the much stiffer region appears outside the tumor marking, resulting in a low baseline Gelastic value within the tumor ROI. At pre-C3, tumor region remains stiff but is comparable to surrounding fibroglandular tissue, which matches with pathological features on surgically removed tissue after NACT that show treatment-related fibrosis. Finally, the total hemoglobin concentration (HbT) quantified by DOT has shown significantly higher values within the tumor marking compared to the rest of the breast at baseline due to angiogenesis. At pre-C3, as expected, we see a significant decrease of HbT values, from 146.69 μM to 53.02 μM, as a result of reductions in tumor vascularity and perfusion. Mean and standard deviation statistics of all quantitative metrics are listed in Table 1 to facilitate interpretation of treatment-induced changes.Conclusion
We have demonstrated multimodal MRI, MRE and DOT imaging for monitoring the response of breast tumors to neoadjuvant chemotherapy. Results in a breast cancer patient show concordant changes in tumor size, ADC, stiffness and HbT values with eventual pathologic outcome.Acknowledgements
This project is supported by NIH grants K01EB027726, R01CA187595 and R01EB028664.References
- American Cancer Society. “Breast Cancer Facts & Figures 2019-2020.” 2020.
- Liedtke C, Mazouni C, Hess KR, et al. “Response to neoadjuvant therapy and long-term survival in patients with triple-negative breast cancer,” J Clin Oncol. 2008;26(8):1275-1281.
- Sajjadi AY, Isakoff SJ, Deng B, et al., “Normalization of compression-induced hemodynamics in patients responding to neoadjuvant chemotherapy monitored by dynamic tomographic optical breast imaging (DTOBI),” Biomed Opt Express. 2017;8(2):555-69.
- Sinkus R, Siegmann K, Xydeas T, Tanter M Claussen C and Fink M, “MR elastography of breast lesions: understanding the solid/liquid duality can improve the specificity of contrast-enhanced MR mammography,” Magn Reson Med. 2007; 58(6):1135-44.
- Zimmermann BB, Deng B, Singh B, et al., “Multimodal breast cancer imaging using coregistered dynamic diffuse optical tomography and digital breast tomosynthesis,” J Biomed Opt. 2017; 22(4):046008.
- Garteiser P, Sahebjavaher RS, Ter Beek LC, et al., “Rapid acquisition of multifrequency, multislice and multidirectional MR elastography data with a fractionally encoded gradient echo sequence,” NMR Biomed. 2013; 26(10):1326-35.
Figures
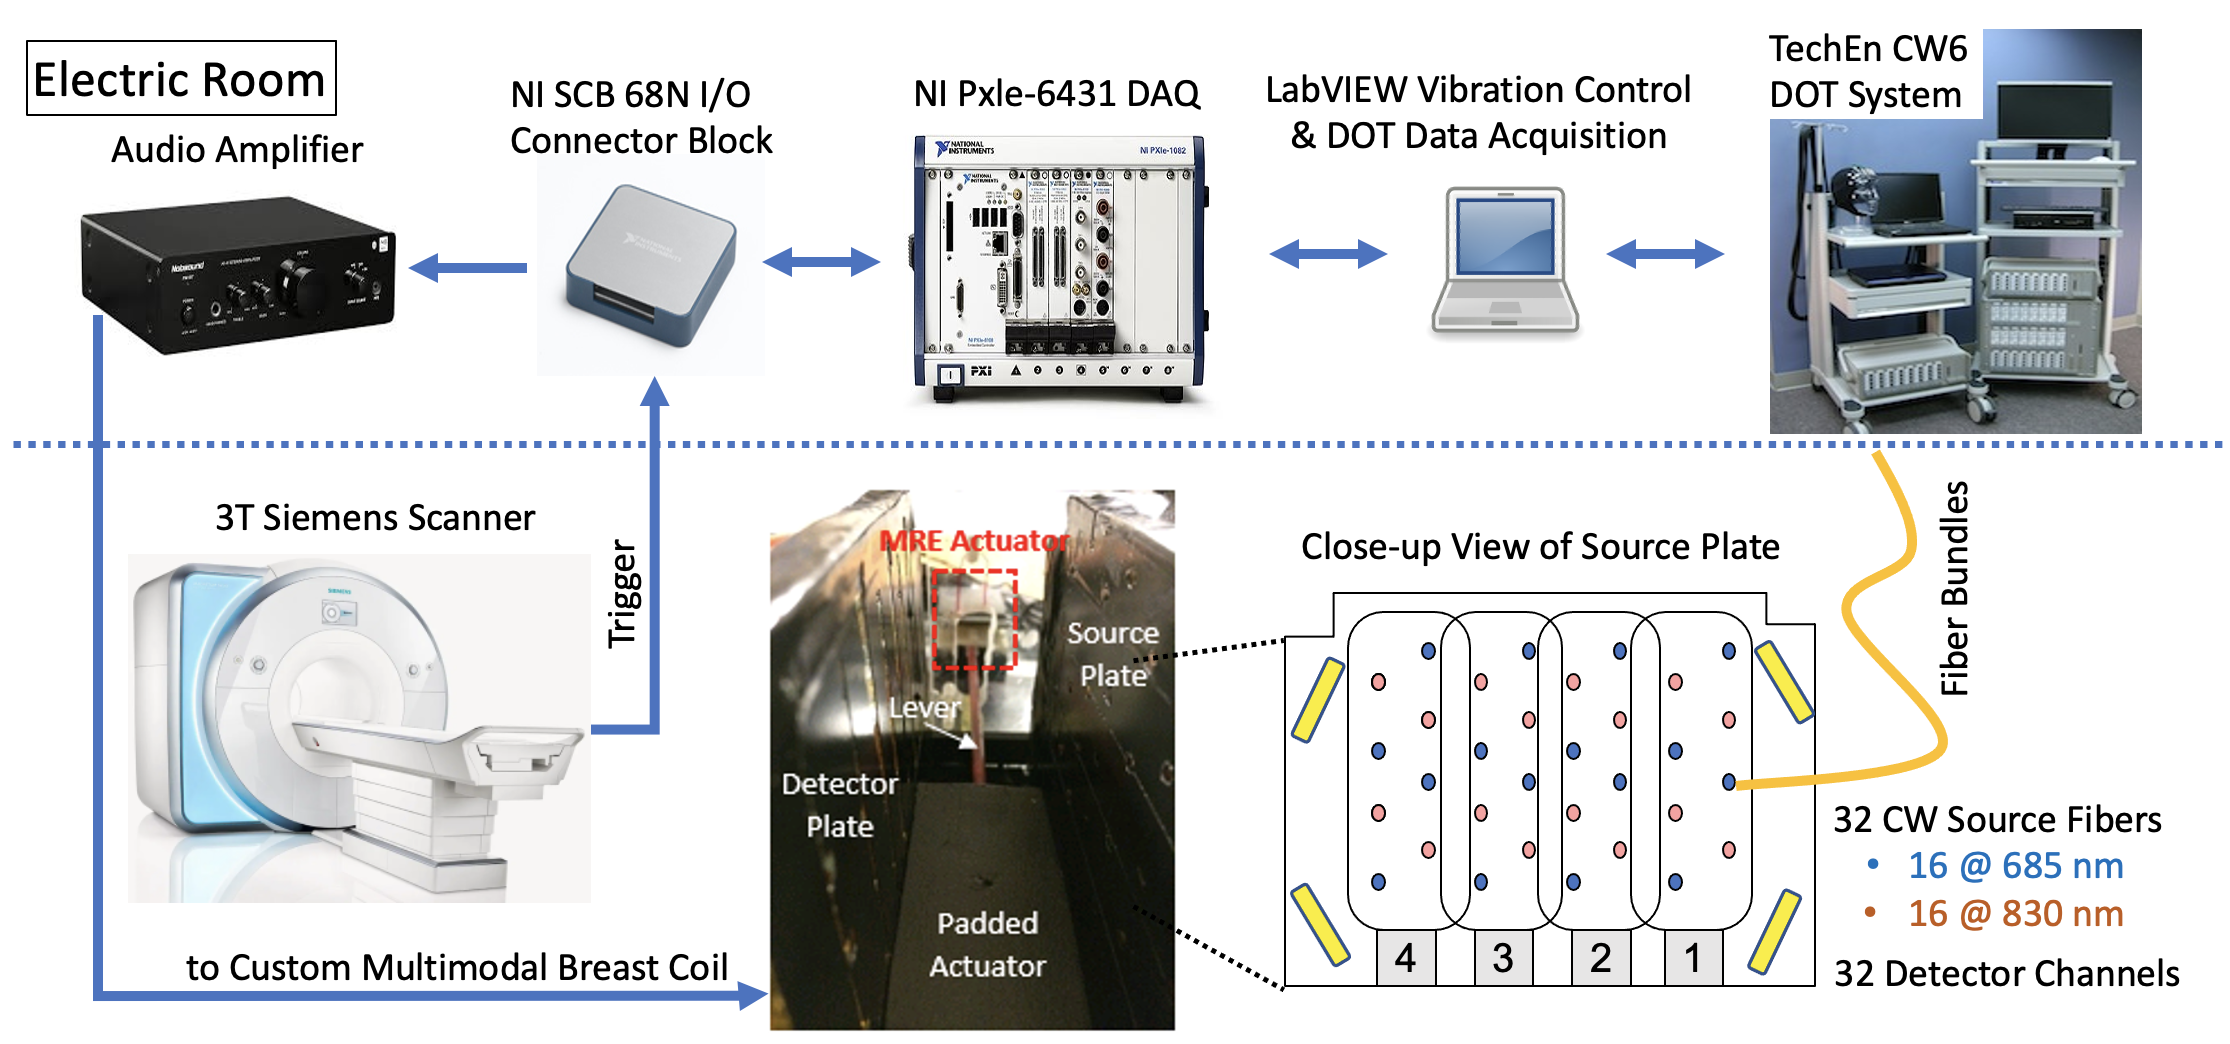
Fig. 1: Schematic of multimodal MRE/DOT acquisition system. Four phased-array elements are placed on each side of a pair of parallel plates with optical fibers arranged in between. VE fiducials are placed on four corners for registering simultaneously collected DOT and MRI images. The MRE transducer assembly consists of a padded passive actuator placed in between the two parallel plates connected to an active electromagnetic transducer located outside the FOV. Triggered amplified current drives the assembly to vibrate along B0 in synchronization with the MRE pulse sequence.
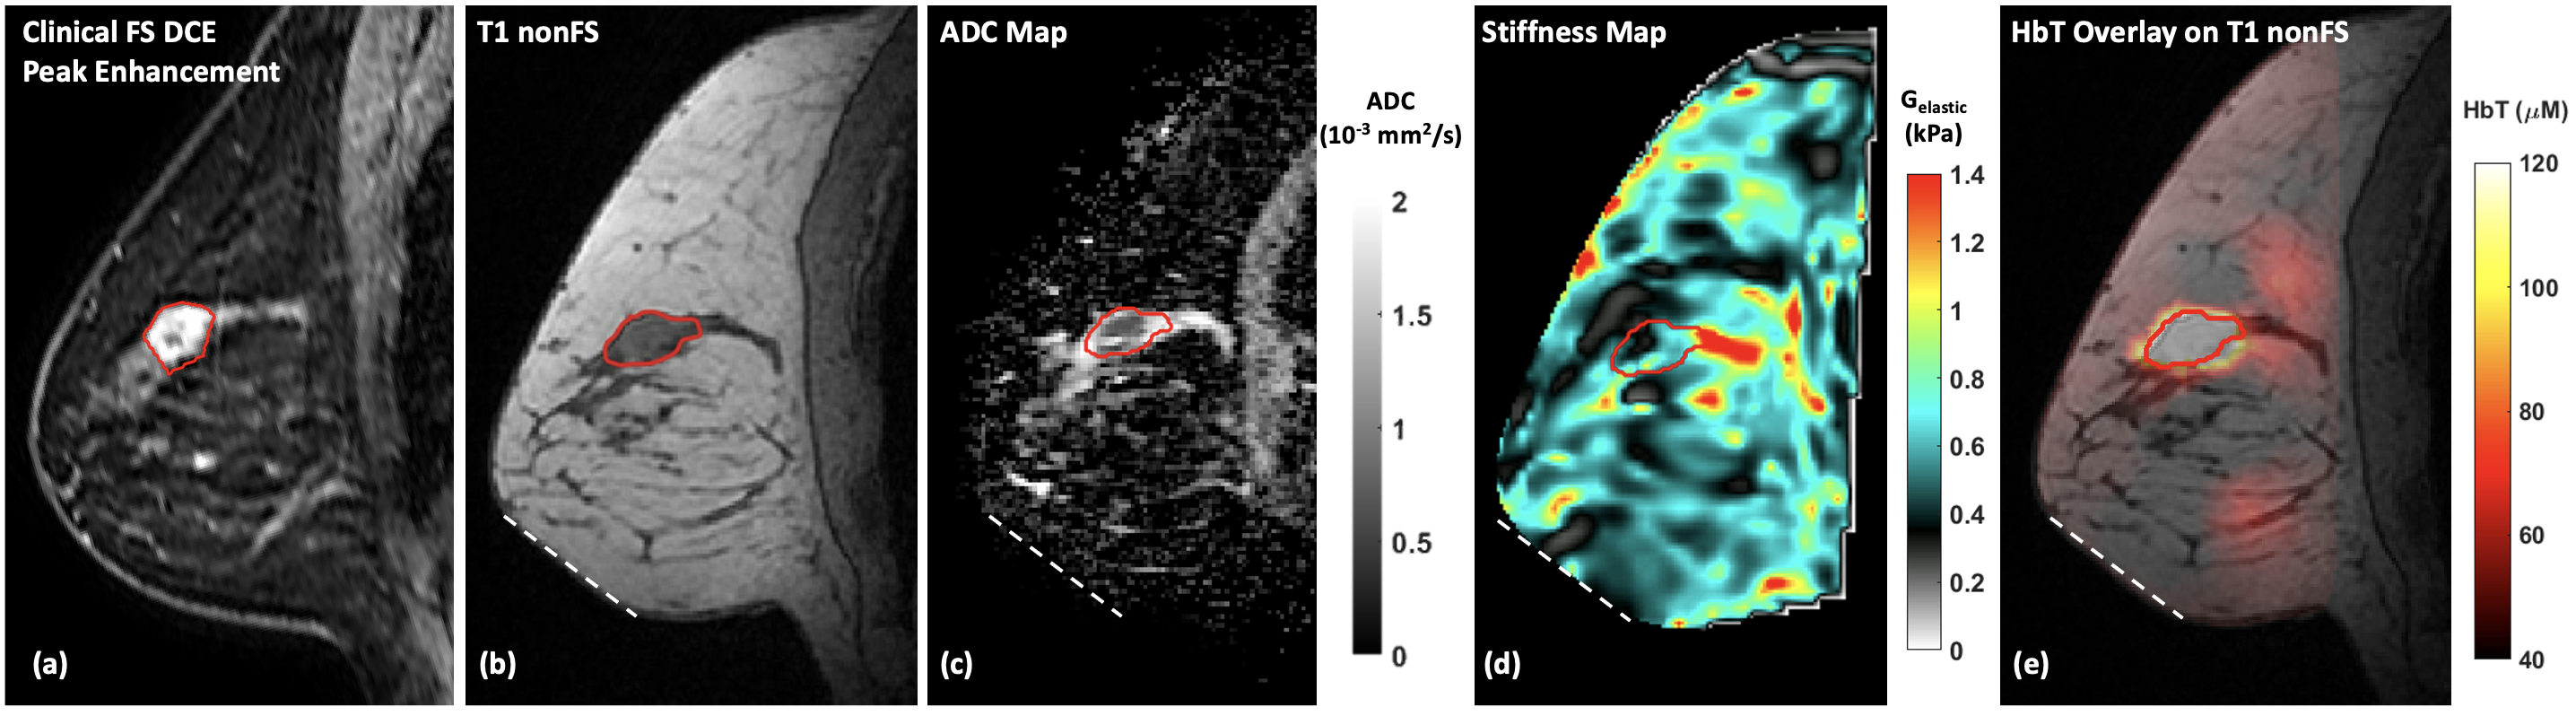
Fig. 2: (a) Baseline (pre-treatment) clinical dynamic contrast enhanced image of a 45-y.o. breast cancer patient with a triple-negative invasive ductal carcinoma measuring 23 mm × 18 mm × 14 mm. Multimodal research MR and optical scans were acquired in a separate visit to obtain multiparametric images of (b) non-fat suppressed T1 image, (c) ADC map derived from multi-b DWI, (d) stiffness map recovered from MRE measurements, and (e) DOT image of total hemoglobin concentration (HbT) overlaid with concurrent T1 image. Red line – tumor marking. White dotted line – MRE actuator contact.
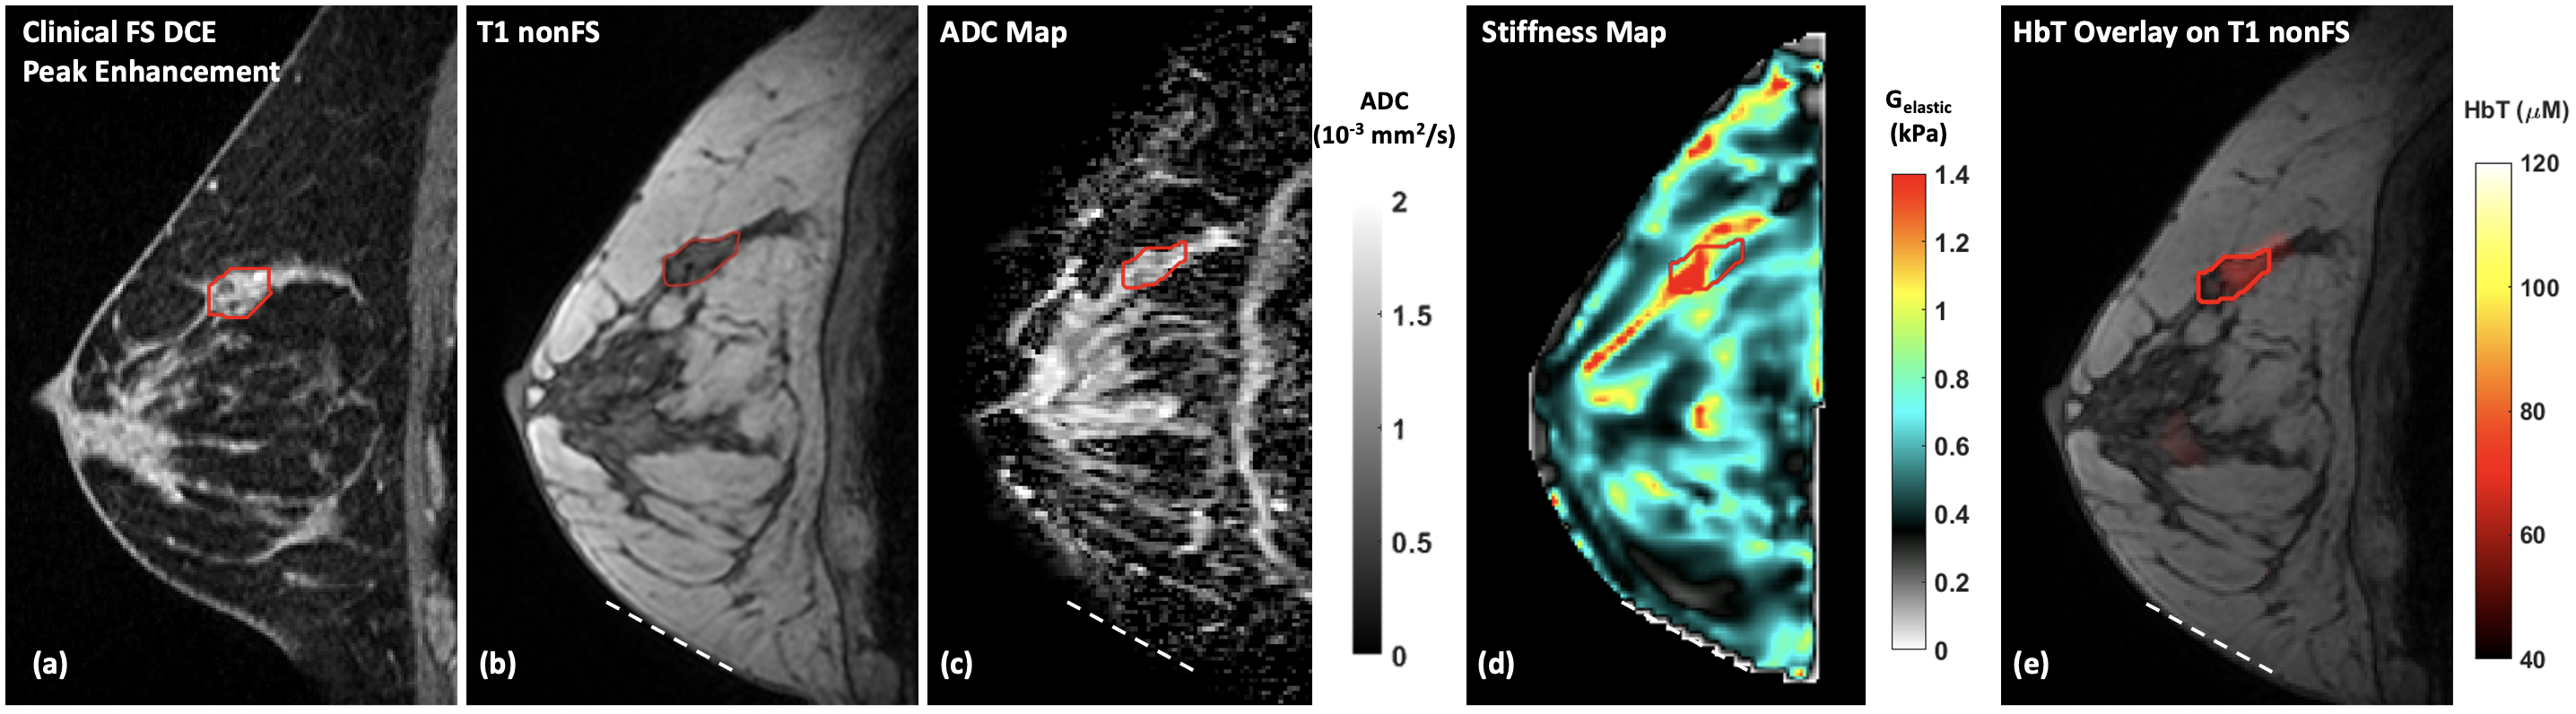
Fig. 3: The same multiparametric image panel of the same patient acquired before the initiation of the 3rd cycle of neoadjuvant chemotherapy (pre-C3, 6 weeks after baseline). Tumor size measured on (a) clinical DCE image has shrunk to 15mm × 12 mm × 10 mm with marked reduction in enhancement. In addition, (c) ADC and (e) HbT have returned to normal, while (d) stiffness remained as comparable levels as surrounding fibroglandular tissue. The patient has achieved pathologic complete response (pCR) upon completion of her NACT. Red line – tumor marking. White dotted line – MRE actuator contact.
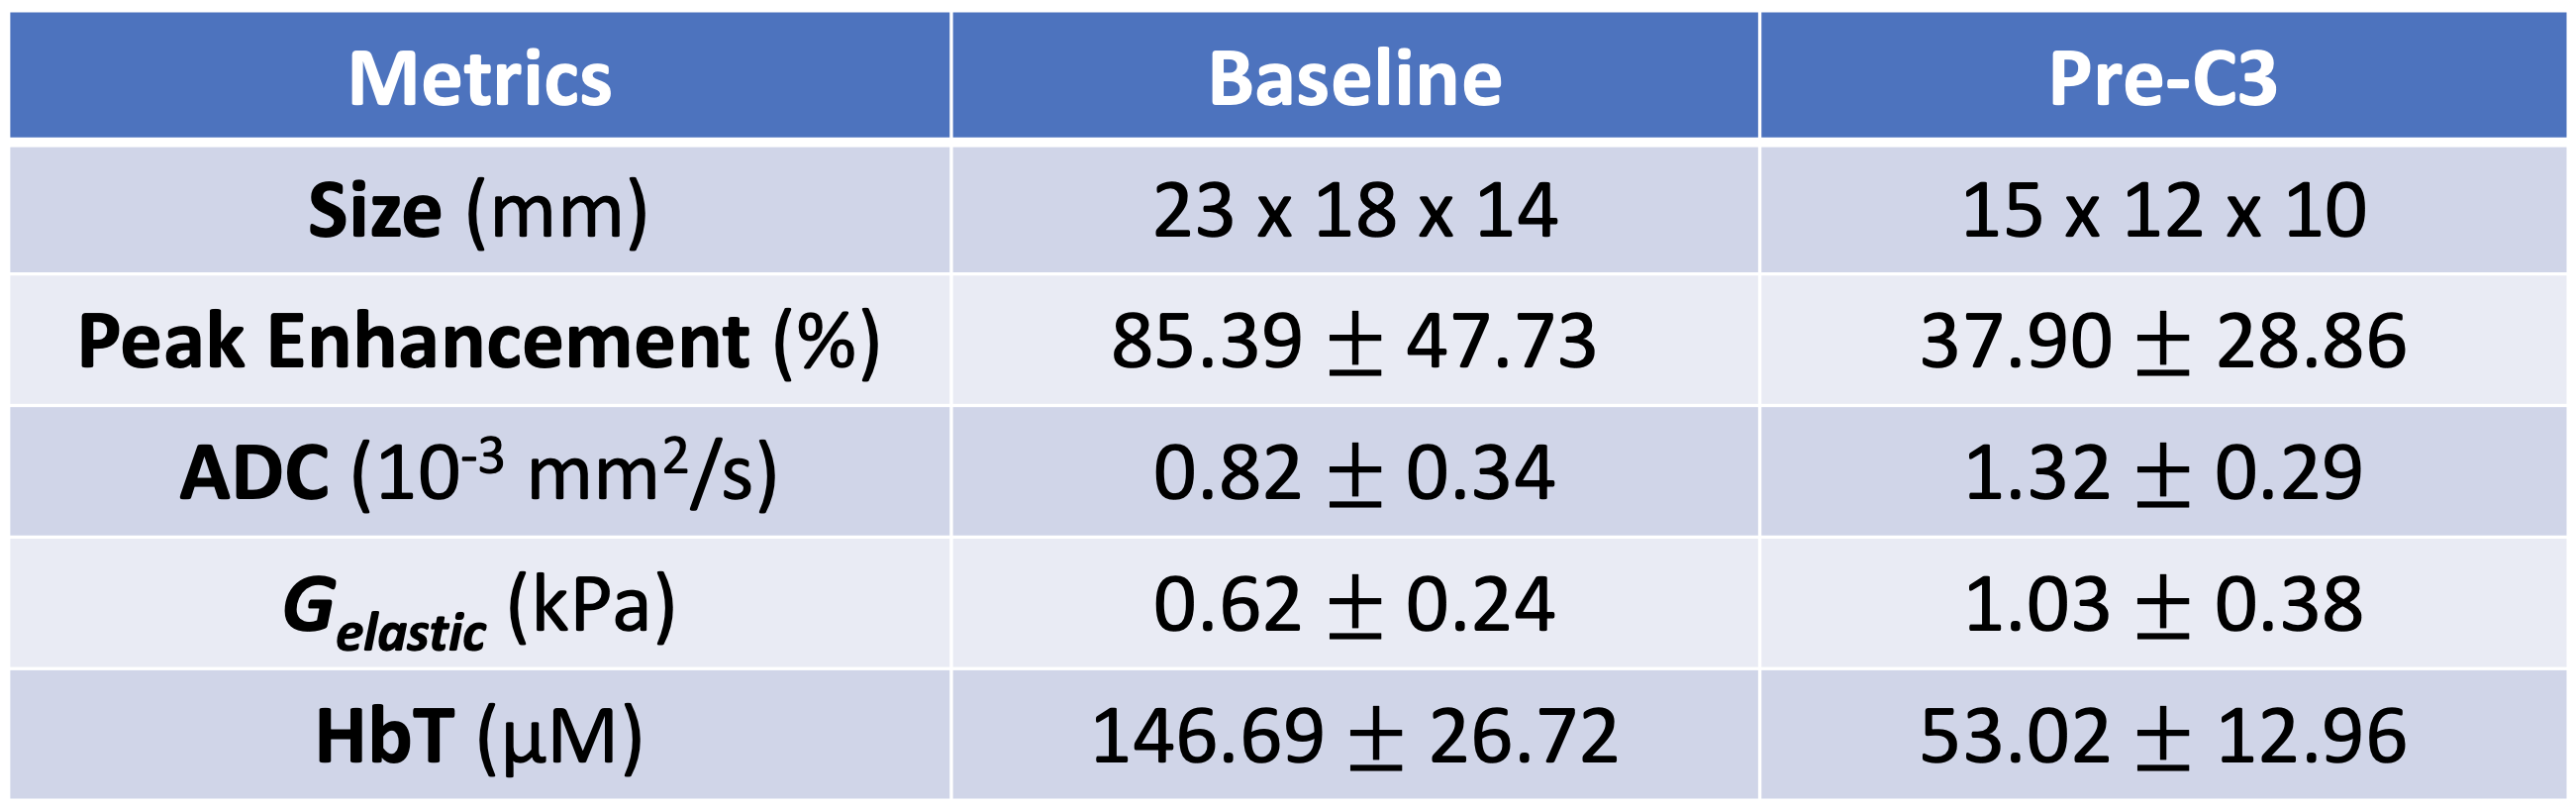
Table 1: Mean and standard deviation of quantitative metrics derived from multimodal imaging within the tumor markings shown in Fig. 2b and Fig. 3b, respectively, for baseline and pre-C3 scans.
DOI: https://doi.org/10.58530/2022/1592