1590
Inter-reader variability in apparent diffusion coefficient measurements for assessment of breast cancer response to neoadjuvant therapy1Radiology, UCSF, San Francisco, CA, United States, 2UCSF, San Francisco, CA, United States, 3University of Washington, Seattle, WA, United States
Synopsis
This study presents a retrospective analysis of inter-reader variability in tumor ADC measurements extracted from three types of ROIs using data from the multi-center I-SPY 2 trial. Overall, good agreement was observed between two readers. Mean ADCs measured in restricted ROIs were highly reproducible by manual delineation. Mean ADCs of multi-slice restricted ROIs showed higher ICCs than single-slice restricted ROIs.
Introduction
Neoadjuvant chemotherapy (NAC) is standard treatment for early, high risk breast cancer. Diffusion-weighted MRI (DWI) is a non-contrast imaging technique based upon measuring the random motion of water molecules within the tissue. ACRIN 6698, a sub-study of multi-center clinical trial ISPY 2, showed that tumor ADC is predictive of pathologic complete response (pCR) after 12 weeks of NAC1. However, DWI often has poor image quality and manual delineation of regions of interest (ROIs) is subjective. In this study, we conducted a more comprehensive analysis of reproducibility of tumor ADC measured from three types of ROIs delineated by two readers and evaluated the impact of ROI type on the prediction of pCR using data from I-SPY 2.Methods
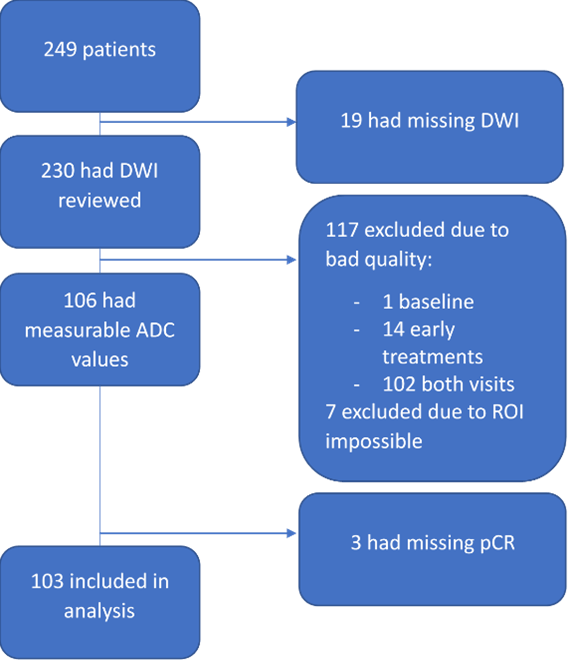
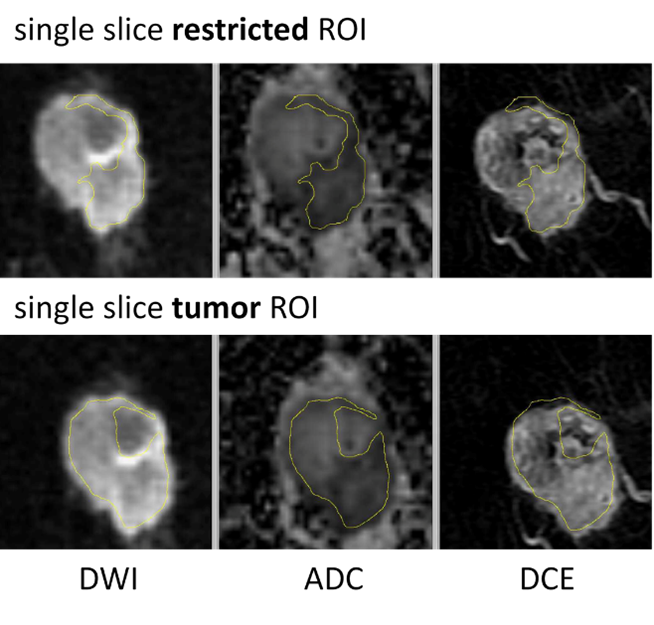
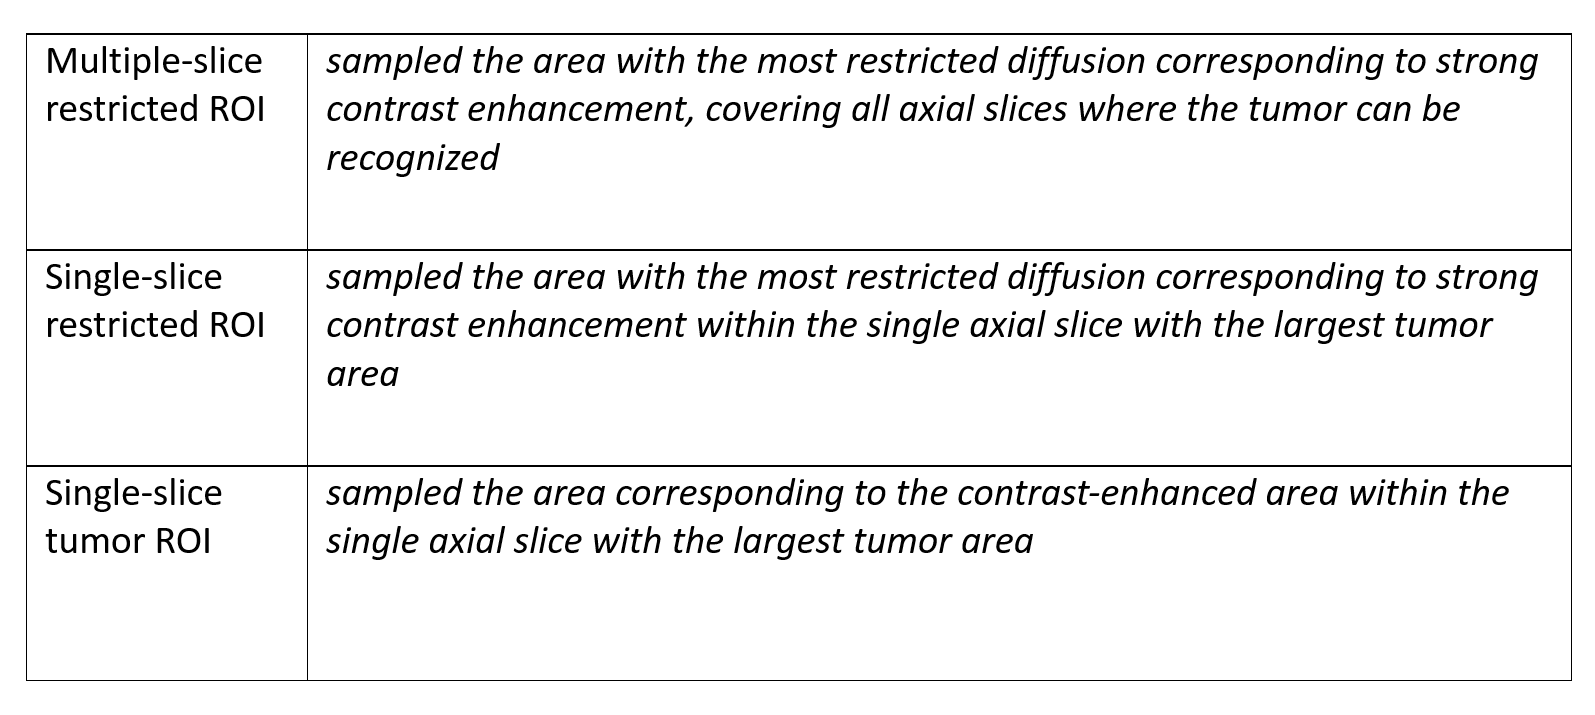
A cohort of 249 women enrolled in the I-SPY 2 trial and randomized to treatment arms of pembrolizumab with paclitaxel or paclitaxel only were included. The primary endpoint, pCR, was defined as the absence of invasive tumor in breast and lymph nodes at the time of surgery. DWI was performed using a fat-suppressed single-shot echo planar imaging sequence with the following parameters: TR ≥ 4000 ms, TE = 50-100 ms, FOV = 260-360 mm to achieve full bilateral coverage, acquisition matrix = 128-192 with in-plane resolution ≤ 1.9 mm, slice thickness = 3-5 mm, slice gap ≤ 1 mm, and number of signal averages ≥ 2. Diffusion weighting b-values of 0 and 800 s/mm2 were specified, with an acquisition time less than or equal to 5 minutes. A standardize quality control process was used to assess DWI images for the three quality categories of artifacts, fat suppression, and signal-to-noise ratio (SNR). See Figure 1 for data exclusion details. ROIs were defined independently by two readers on DWI images of the final cohort of 103 patients acquired at T0 (before NAC) and T1 (after 3 weeks of NAC) blinded to pathologic outcomes. Dynamic contrast-enhanced (DCE) subtraction images were used to localize the lesion. Tumor was then delineated on the ADC map to enclose areas with low ADC values and high signal intensity in b=800 DWI. Three types of ROIs were analyzed in this study (Table 1): multiple-slice restricted ROI, single-slice restricted ROI, and single-slice tumor ROI (Figure 4). In-house software was used to calculate ADC based on b=0 and b=800 sec/mm2 DWI. ADC metrics — mean and percentiles were extracted for tumor ROIs. Percent change of ADC metrics from T0 to T1 were calculated to evaluate the impact of inter-reader variability on treatment response. The variability of ADC measurements between two readers was evaluated using the intraclass correlation coefficient (ICC)2. Predictive performances of percent change of ADC metrics were assessed by the area under the ROC curve (AUC) in the prediction of pCR. P-values of difference between two AUCs were compared using the DeLong test.Results
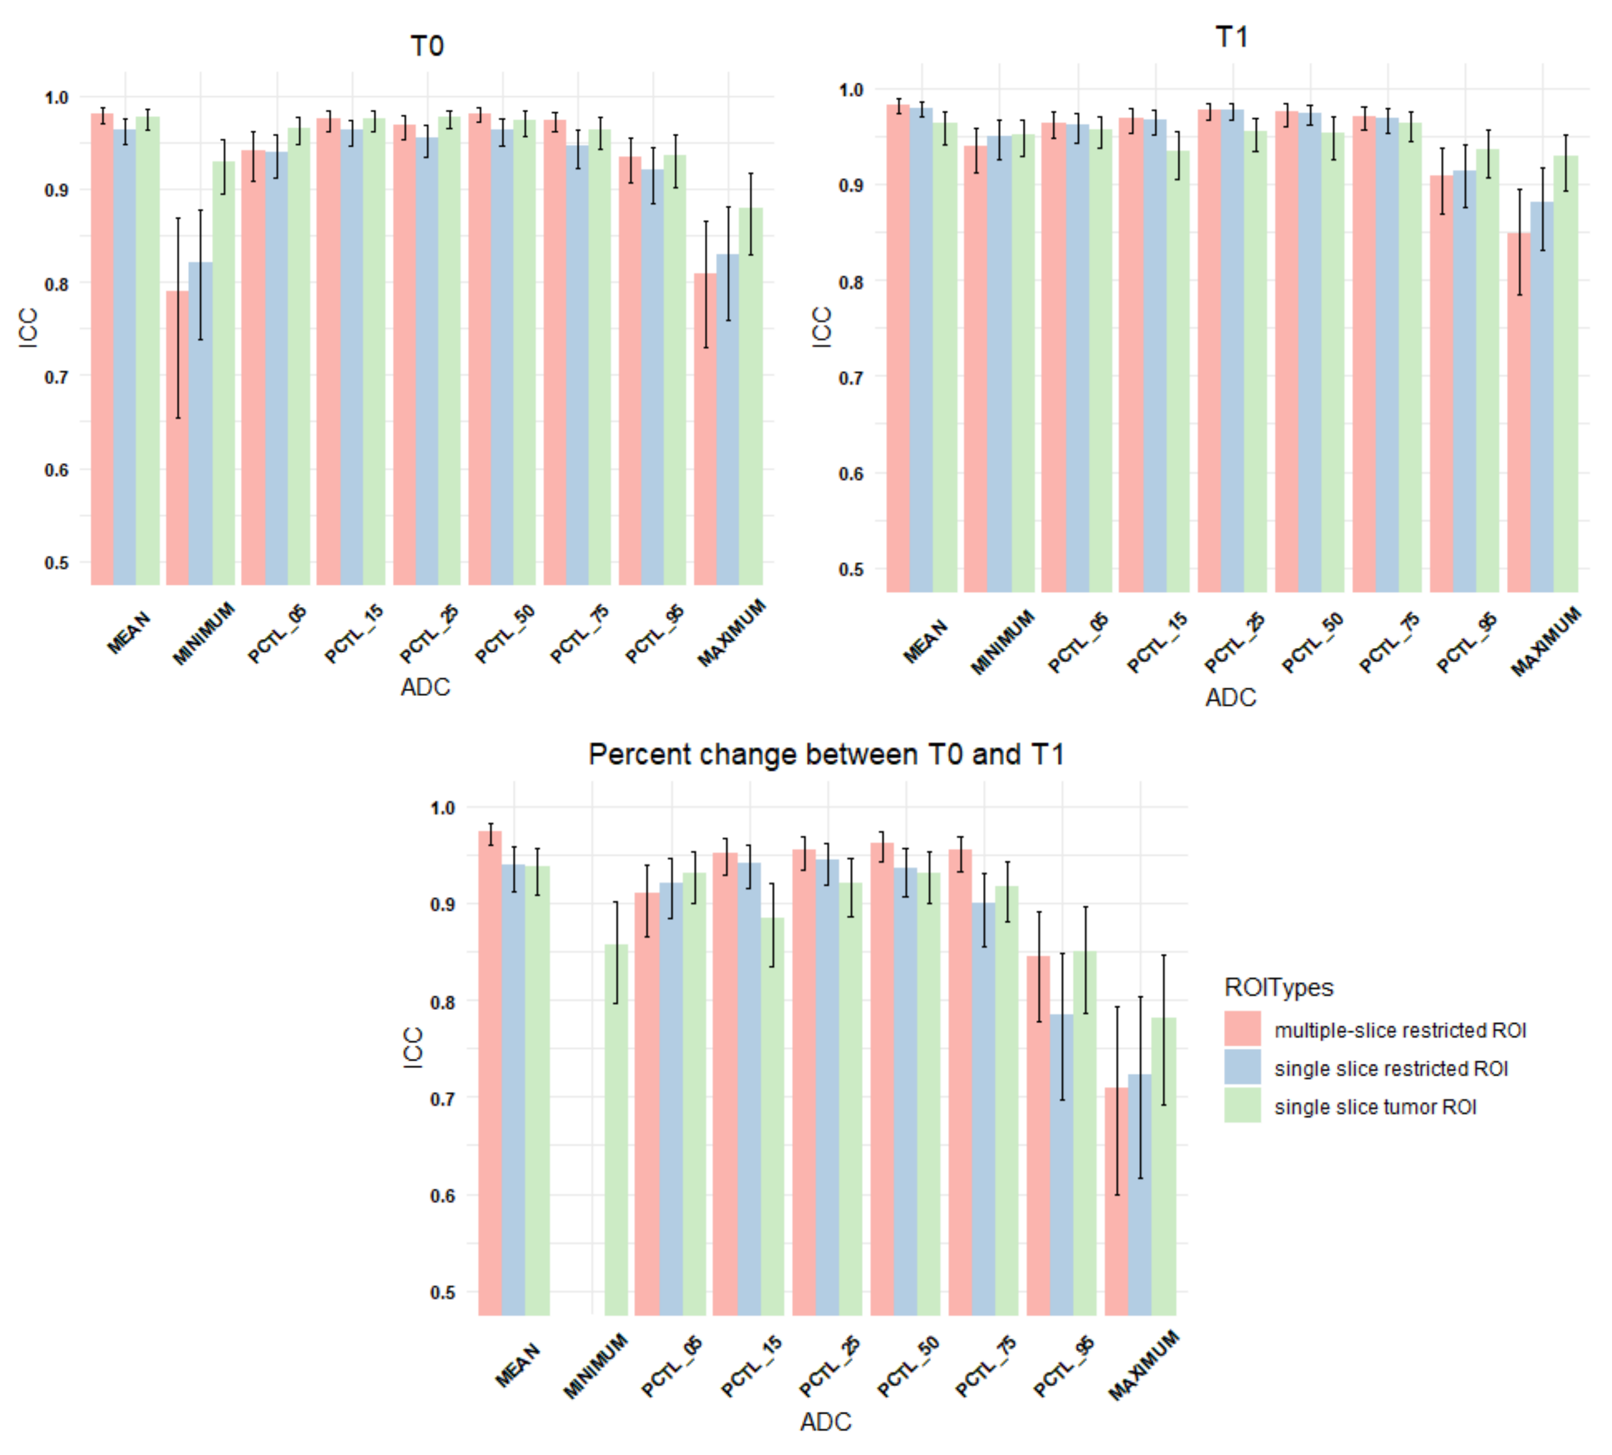
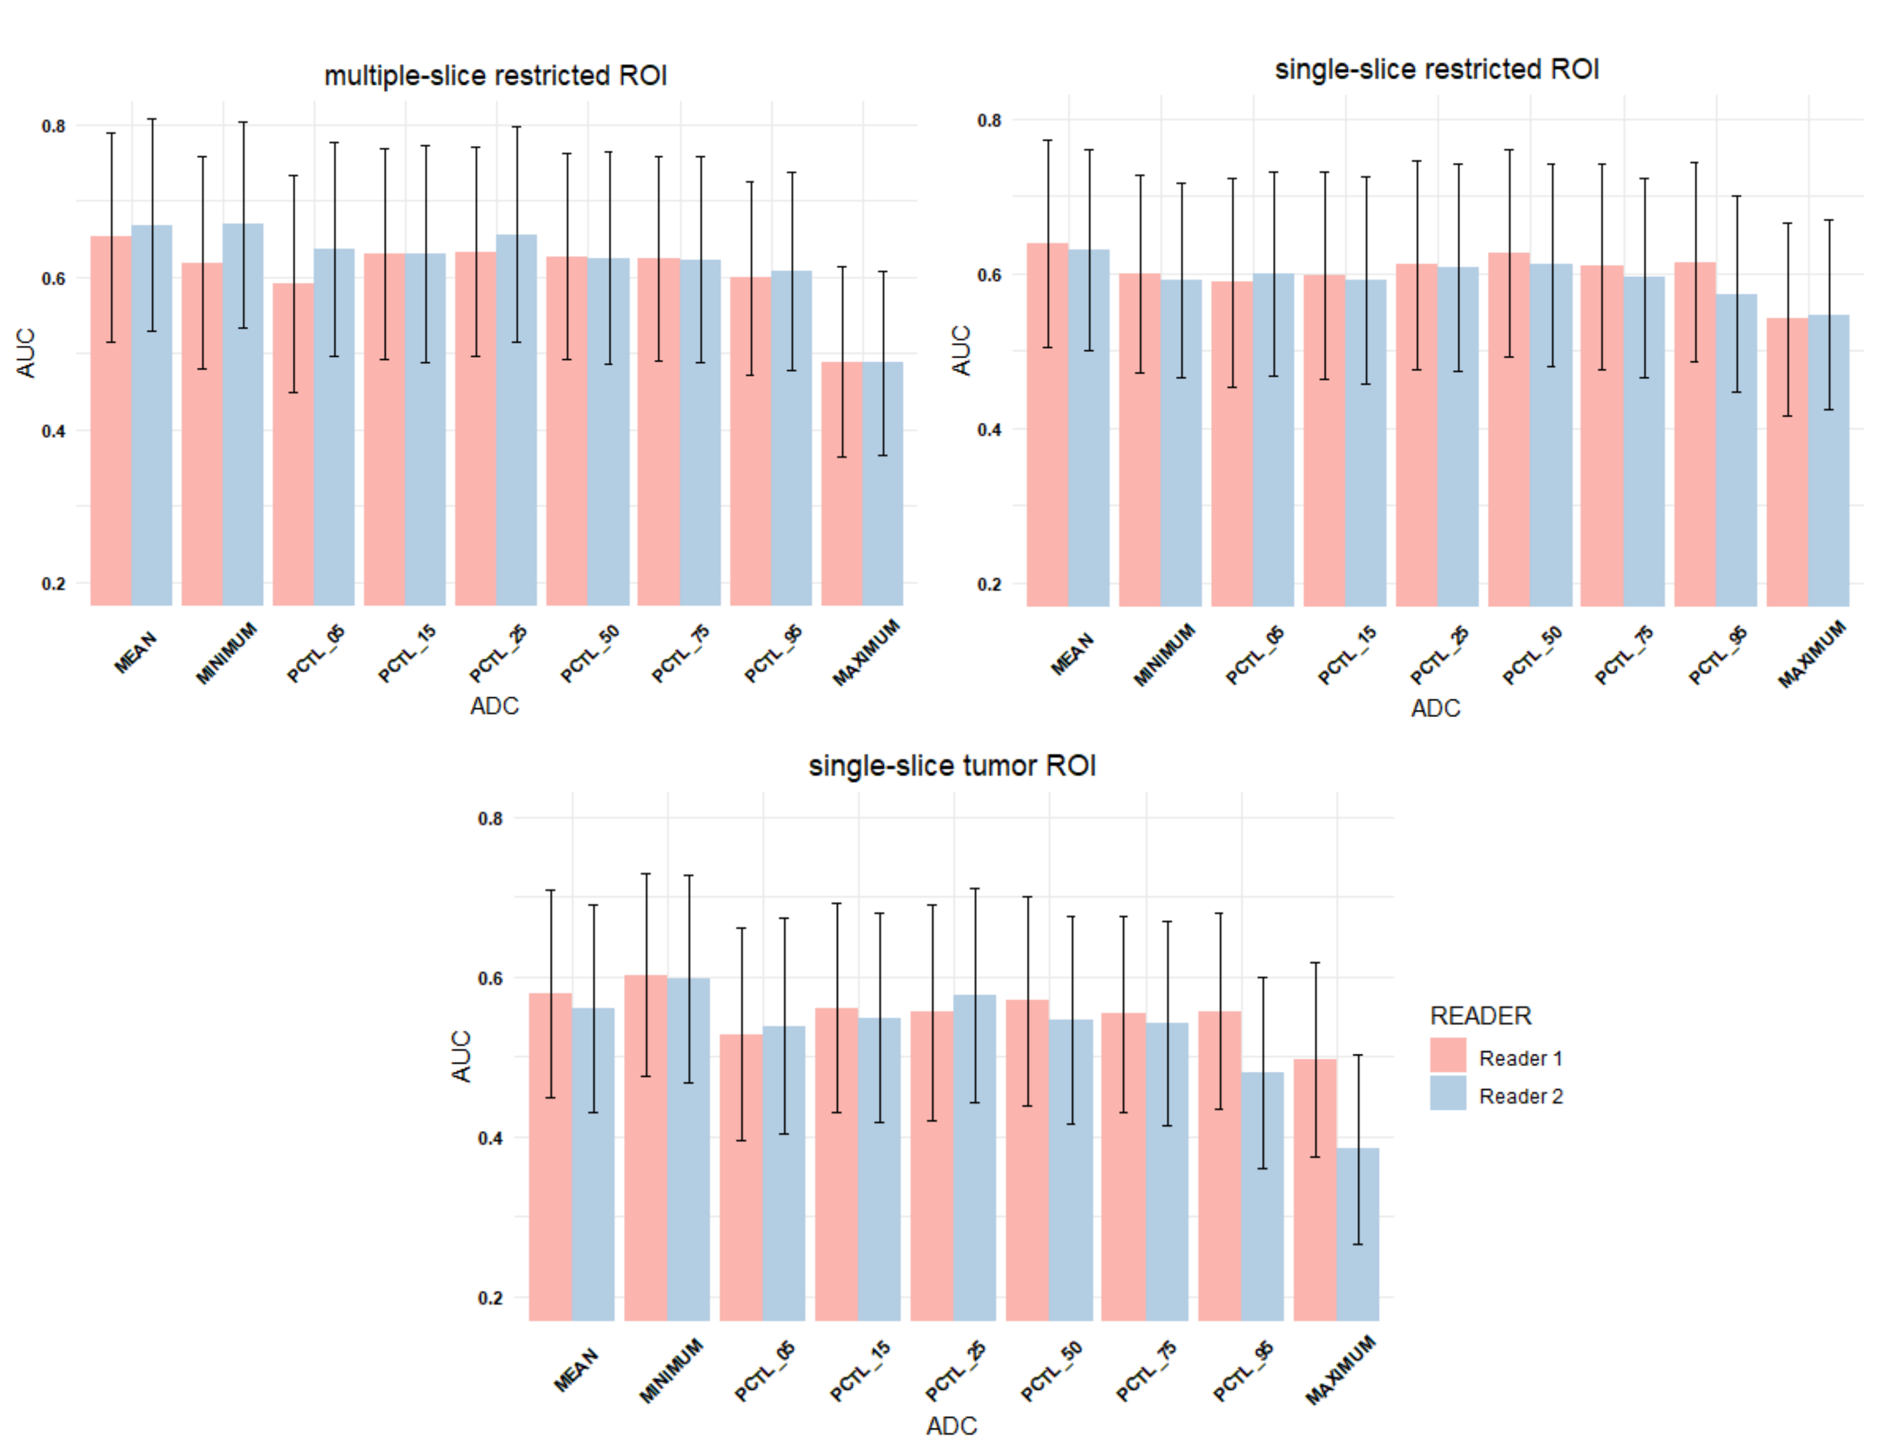
ICCs between two readers for three types of ROIs and nine types of ADC metrics extracted from each ROI type are plotted in Figure 2. ICC values ranged from 0 to 1. The overall agreement between two readers was high (based on what has been achieved in other metrics for breast tumor3–5) for ADC metrics at both T0 and T1, with the highest ICCs observed for mean ADCs (range: 0.96 to 0.98). ADC metrics extracted at T1 had higher estimated ICCs (range: 0.84 to 0.98) than ADC metrics extracted at T0 (range: 0.79 to 0.98). ICCs for percent change of ADC metrics (range: 0.045 to 0.97) were lower than ICCs for absolute ADC values, with lowest ICCs observed for the minimum ADC when restricted ROIs were used (0.045 and 0.083 for multiple-slice and single-slice restricted ROIs, respectively). AUC was estimated for using the percent change (between T0 and T1) of each ADC metric to predict pCR (Figure 3). Overall, AUC values were similar between two readers across all ADC metrics for all three ROI types, which is consistent with the high reader agreements observed. The AUCs of restricted (multiple-slice [range: 0.49 to 0.67] or single-slice [range: 0.54 to 0.64]) ROIs were higher than AUCs of non-restricted single-slice tumor ROIs (range: 0.38 to 0.60). Percent change of mean ADC yielded higher or similar AUCs as percent changes of histogram metrics.Discussion
In this multi-center study, we investigated the inter-reader variability of DWI ADC metrics for three types of ROI delineation approaches and compared the predictive performance of the early change in ADC by reader and by ROI delineation. Our results showed general high agreements on ADC metrics extracted from ROIs delineated by two readers, relative to reproducibility of imaging metrics previously reported breast cancer studies6,7. ICC values reported from our study demonstrated high reproducibility of mean ADC (ICC>0.96) evaluated either at pretreatment or at early post-treatment. Predictive performances of changes in these ADC metrics generated from different readers showed good agreement. Overall, these results indicate good reproducibility of quantitative measurements for manually delineated ROIs in DWI-MRI.Conclusion
This multi-center retrospective study found that mean ADCs measured in restricted ROIs were highly reproducible by manual delineation. The mean ADC of multi-slice restricted ROI showed the highest reproducibility. All ADC metrics extracted from the same type of ROIs by two readers achieved similar AUCs.Acknowledgements
This work was supported in part by NIH grants: U01 CA151235, R01 CA132870, P01 CA210961 and UCSF Breast Oncology Program Research Grant.References
1. Partridge, S. C. et al. Diffusion-weighted MRI Findings Predict Pathologic Response in Neoadjuvant Treatment of Breast Cancer: The ACRIN 6698 Multicenter Trial. Radiology 289, 618–627 (2018).
2. Shrout, P. E. & Fleiss, J. L. Intraclass correlations: uses in assessing rater reliability. Psychol. Bull. 86, 420–428 (1979).
3. Bickel, H. et al. Diffusion-weighted imaging of breast lesions: Region-of-interest placement and different ADC parameters influence apparent diffusion coefficient values. Eur. Radiol. 27, 1883–1892 (2017).
4. Spick, C. et al. Diffusion-weighted MRI of breast lesions: a prospective clinical investigation of the quantitative imaging biomarker characteristics of reproducibility, repeatability, and diagnostic accuracy. NMR Biomed. 29, 1445–1453 (2016).
5. Newitt, D. C. et al. Repeatability and Reproducibility of ADC Histogram Metrics from the ACRIN 6698 Breast Cancer Therapy Response Trial. Tomogr. (Ann Arbor, Mich.) 6, 177–185 (2020).
6. Jang, M. et al. Reproducibility of Apparent Diffusion Coefficient Measurements in Malignant Breast Masses. J. Korean Med. Sci. 30, 1689–1697 (2015).
7. Newitt, D. C. et al. Test-retest repeatability and reproducibility of ADC measures by breast DWI: Results from the ACRIN 6698 trial. J. Magn. Reson. Imaging 49, 1617–1628 (2019).
Figures