1587
Acquiring perfusion maps from contrast-enhanced MRA using deep learning approaches1Korea Advanced Institute of Science and Technology, Daejeon, Korea, Republic of, 2Department of Radiology, Konkuk University Medical Center, Seoul, Korea, Republic of, 3Department of Radiology, Daejeon St. Mary's Hospital, The catholic University of Korea, Daejeon, Korea, Republic of, 4Department of Radiology, Gil Medical Center, Gachon University College of Medicine, Incheon, Korea, Republic of
Synopsis
Perfusion maps and dynamic angiograms are both important for stroke/tumor treatment but commonly acquired in separate scans and thus may require additional injection of contrast agent for best results. In this work, we present a deep learning method to acquire perfusion maps from contrast-enhanced MRA data. Our results showed that an architecture of multiple decoders and an enhanced encoder produced perfusion maps that were visually and quantitatively similar to the standard DSC MRI-based perfusion maps. This approach enables us to acquire accurate perfusion maps and angiogram using a single contrast agent injection, reducing costs and risks while improving patient comfort.
Introduction
Perfusion maps and dynamic angiograms are important metrics in hemodynamic diagnosis and treatment of stroke/tumor. The standard perfusion imaging method is dynamic susceptibility contrast (DSC) MRI[1]. Meanwhile, dynamic angiogram can be acquired using contrast-enhanced MR angiography (CE-MRA) but requires additional contrast agent injection. CE-MRA is a superior angiography technique due to its higher SNR, larger coverage, and shorter acquisition time[2, 3]. The angiogram from CE-MRA is calculated by subtraction of pre- and post- contrast bolus passage followed by slice-wise maximum intensity projection (MIP) [3]. While good angiogram can be produced with CE-MRA, there are residual tissue signals in the subtracted images, which are discarded in most cases but may contain useful information such as tissue perfusion. This study aims to make use of the residual signals from CE-MRA to calculate perfusion parameters rCBV, rCBF, Tmax, MTT, and TTP using deep learning approaches.Method
Paired CE-MRA and DSC-MRI data from 18 patients with varying degree of abnormalities were used in this study with 15 patients assigned for training, 1 patient for validation, and 2 patients for test. All scans were performed using 3T MR scanners (skyra, Siemens AG healthcare). Standard neck + head CE-MRA were acquired using 3D TWIST sequence (Siemens) with the following parameters: Acquisition matrix=320x240x144, FOV=300x400x172.8mm3, scan direction=coronal, slice thickness=1.2mm, number of slices=144, and number of dynamic scans=28. Standard head DSC-MRI were acquired using 2D EPI sequence with the following parameters: Acquisition matrix=128x128x24, FOV 230x230x134.4mm3, scan direction=axial, slice thickness=4mm, number of slices=24, and number of dynamic scans=50.The non-subtracted CE-MRA data were reordered along axial direction and further cropped and aligned with the DSC-MRI data using image registration to have paired slices[4]. The DSC-MRI data were used to calculate ground truth perfusion maps using deconvolution method with block-circulant singular value decomposition.
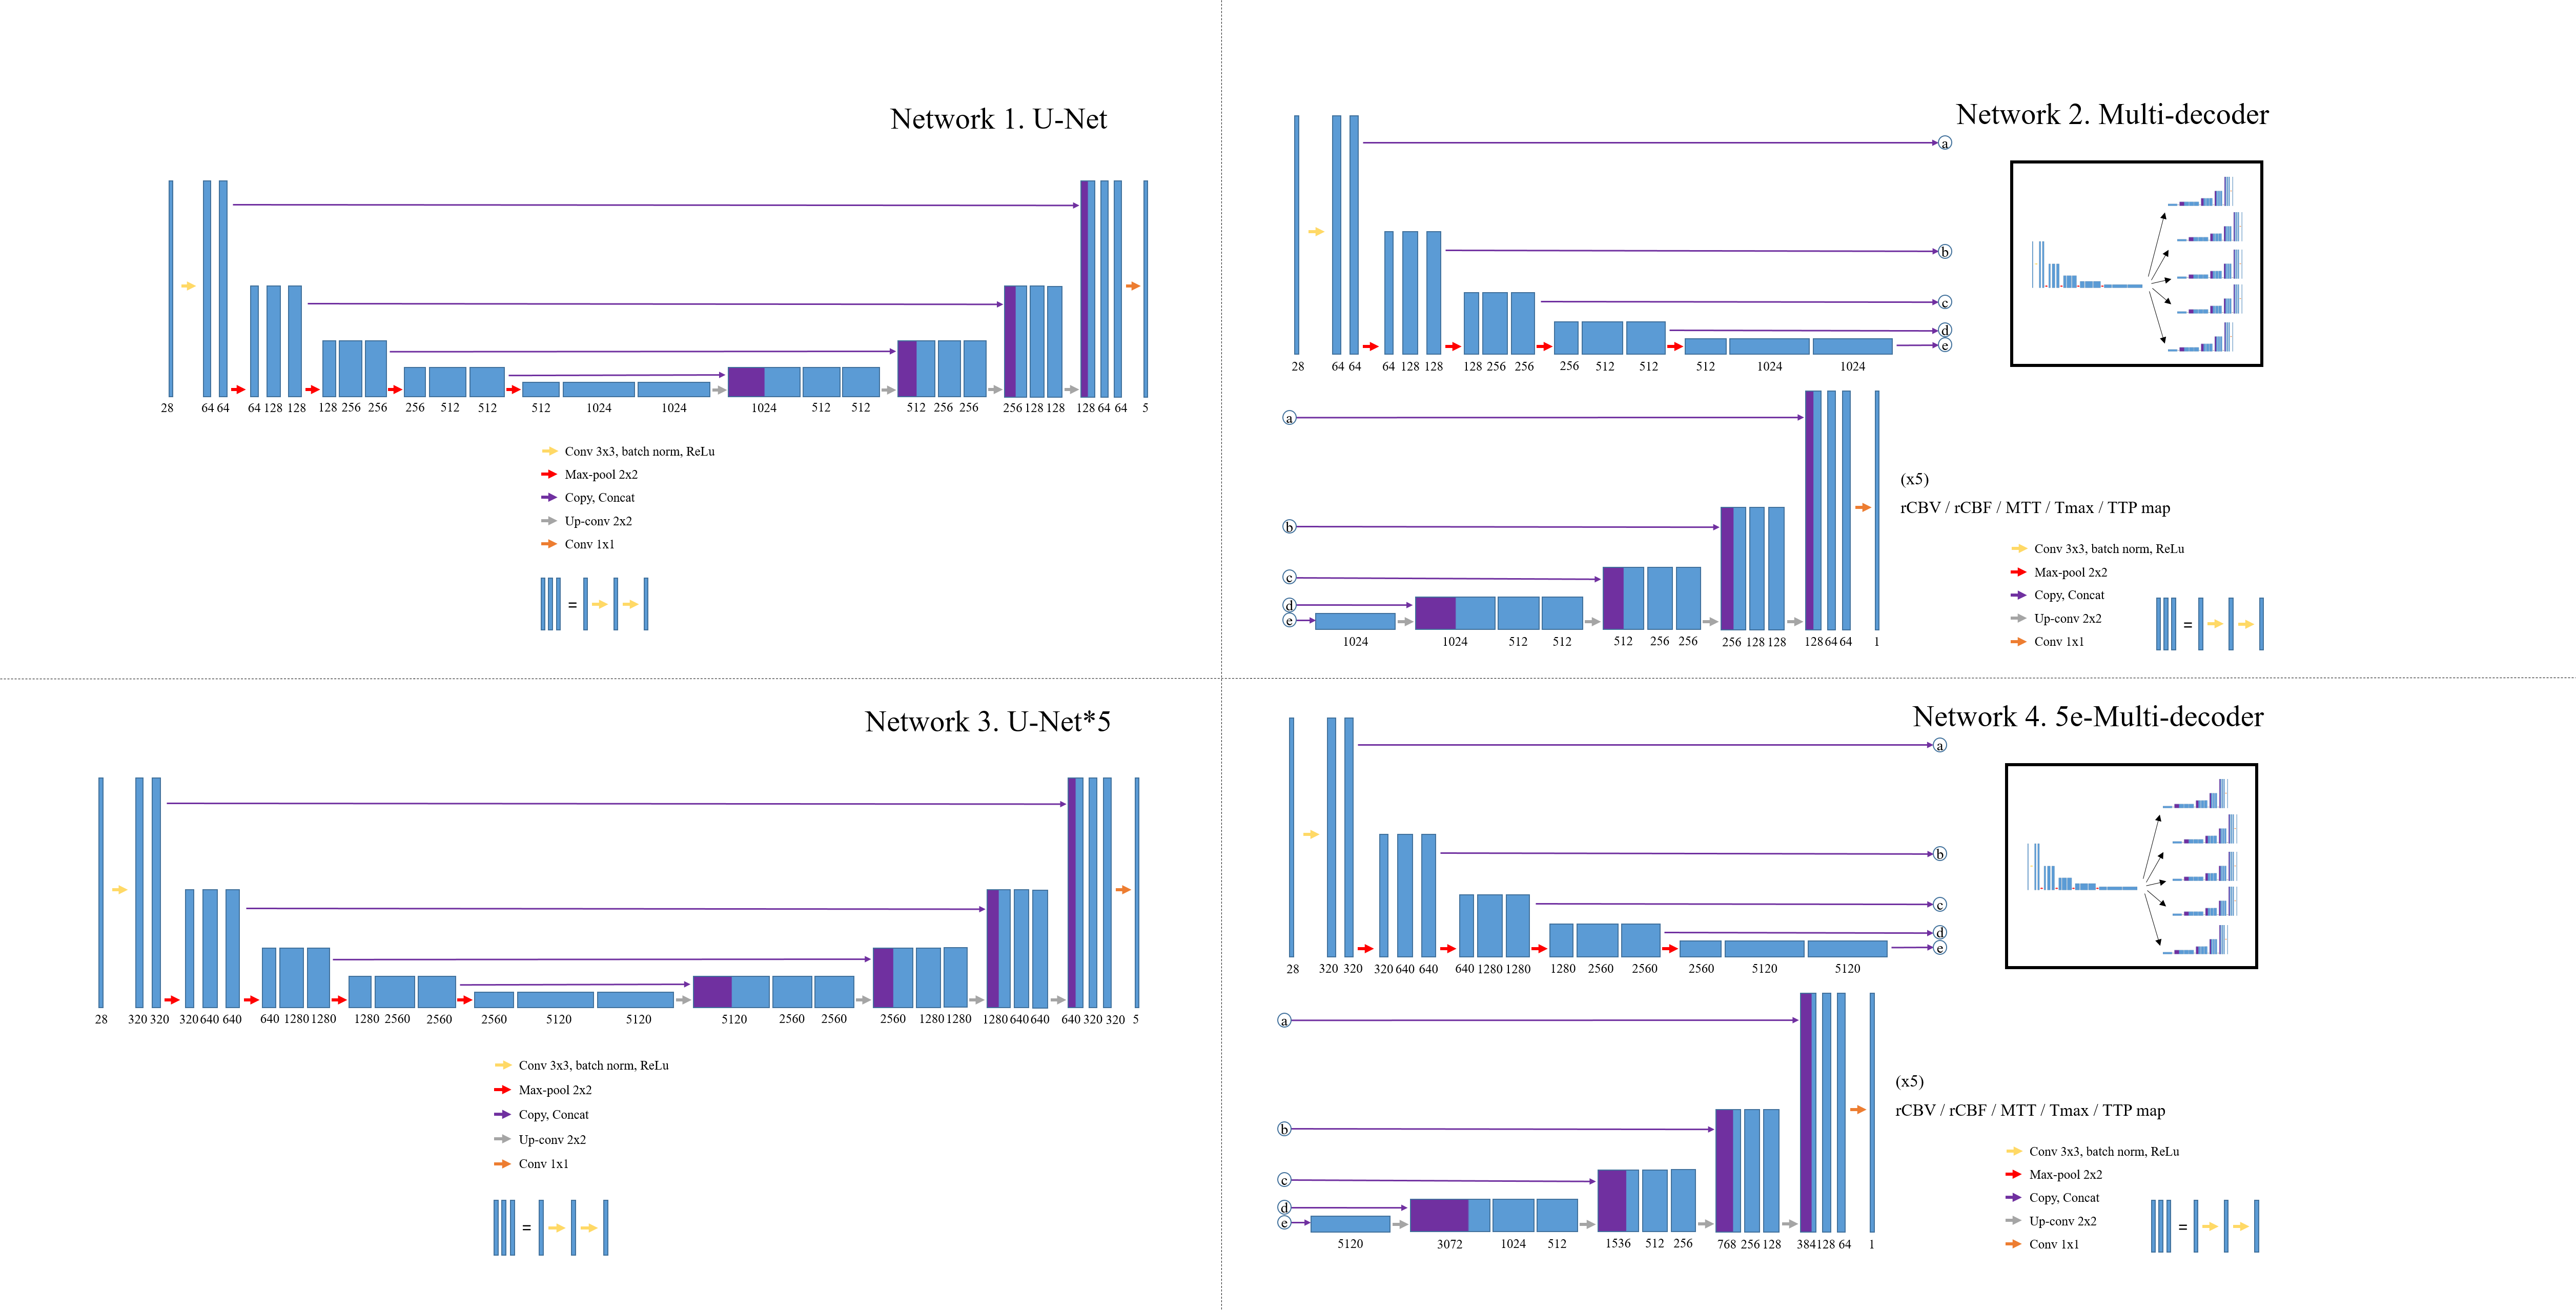
Four different convolutional neural networks were used to calculate five perfusion maps (rCBV, rCBF, Tmax, MTT, and TTP) from CE-MRA data (Figure 1). The first network was a U-Net modified to take 28 channel input and 5 channel output (U-net). The second network was a U-Net further modified to have the same encoder but have five different decoders to generate the five perfusion maps individually (Multi-decoder). The third network had the same architecture as the first network (U-net) but with increased number of trainable parameters by a factor of 5 (U-net*5). The fourth network had the same architecture with the second network (Multi-decoder) but with 5 times increase in the number of trainable parameters in the encoder side only (5e-Multi-decoder). All the networks were trained using weighted sum of L1loss and vgg16-based perceptual loss with Adam optimizer.
The perfusion maps generated from CE-MRA were compared to the ground truth generated from DSC using NRMSE, SSIM, and pSNR. Additionally, MTT, Tmax, and TTP maps were further used to generate hypo-perfused area (HP) masks by simply applying thresholds. The HP masks from ground truth were compared with those from the proposed networks via DICE score.
Results
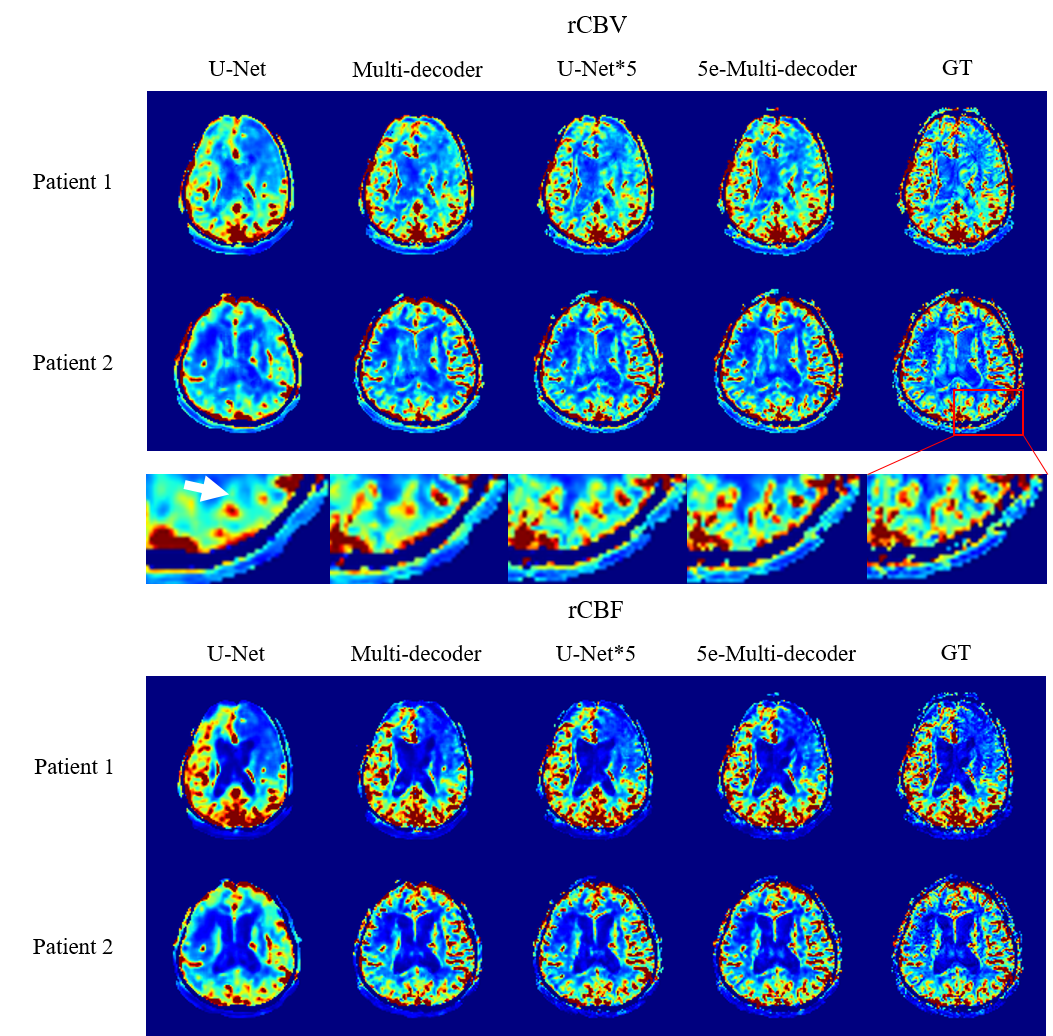
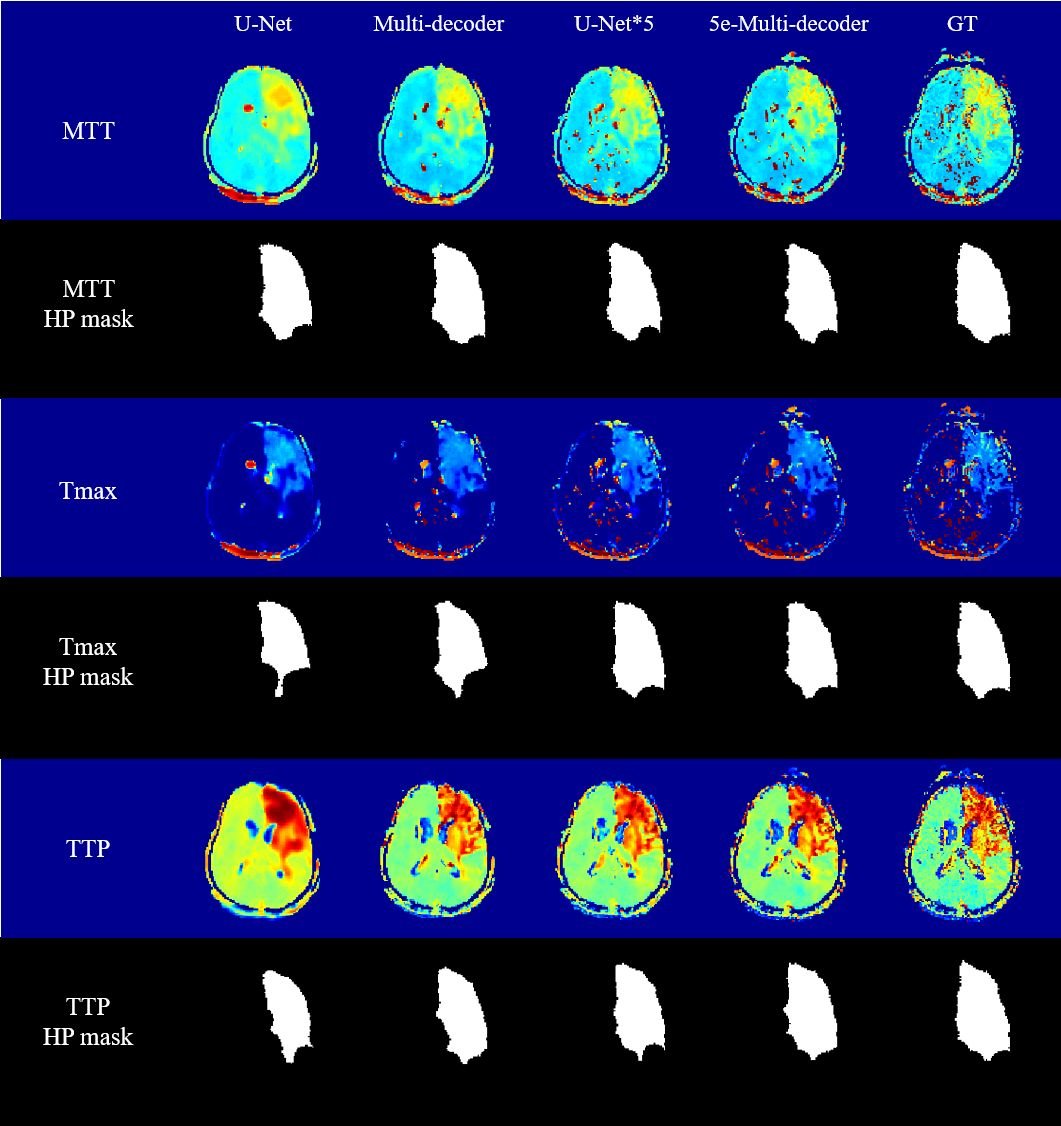
Visually the generated rCBV and rCBF maps were in good agreement with their corresponding ground truth maps (Figure 2). The ground truth rCBV and rCBF maps showed small structures that were replicated well in U-Net*5 and 5e-Multi-decoder networks with higher trainable parameters but not well in U-Net and Multi-decoder networks. Also high degree of smoothing was noted in the maps from U-Net, while it was mitigated in the other networks. Nevertheless, the quantitative metrics showed good agreement between the generated rCBV and rCBF maps and the ground truth maps for all the networks (Table 1). Among the four networks, 5e-Multi-decoder network showed the best performance visually and quantitatively.The MTT, Tmax, and TTP maps followed a trend similar to the rCBV and rCBF maps in terms of improvements between networks. Again, U-Net showed the worst results, while 5e-Multi-decoder network showed the best (Figure 3). While structure-wise quantitative metrics showed a good result, these maps showed no notable small structures compared to rCBV and rCBF. Therefore, the HP masks were additionally evaluated in terms of DICE score and showed good agreement between the generated maps and the ground truth maps (Table 1).
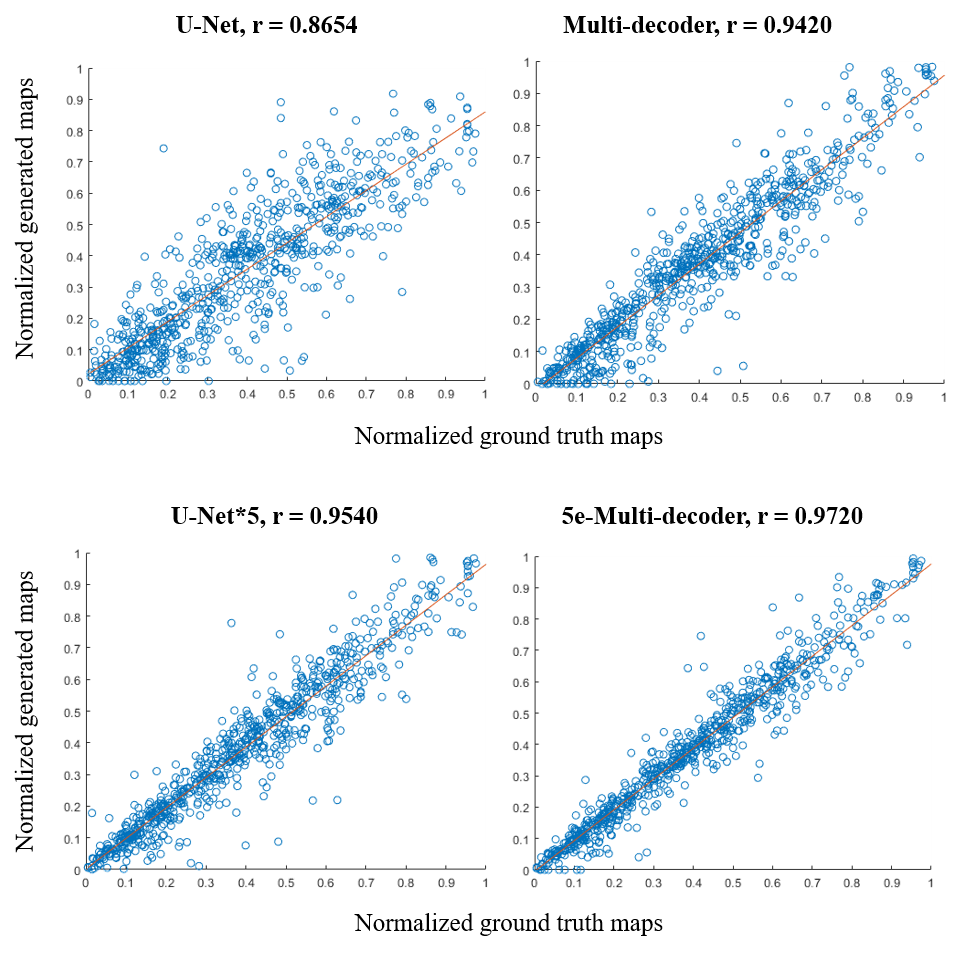
Parameter values of the generated perfusion maps from each network also showed tight correlation with those of the ground truth, suggesting accurate perfusion parameter estimation (Figure 4).
Discussion
Among the four networks tested, network 4 (5e-Multi-decoder) generated the best perfusion maps both in terms of structure-wise similarity and the accuracy of the generated HP masks. The improvements between different networks are likely due to the increased number of trainable parameters and the multi decoders design. The generated perfusion maps showed various degrees of smoothing, which may be further reduced using techniques such as pixel-wise training or addition of adversarial networks but at the expense of increased noise[5].Conclusion
This study provides a modified U-Net based deep learning approaches to generate perfusion maps from CE-MRA with high accuracy comparable to those from the standard DSC-MRI, by taking advantage of the residual signals in CE-MRA that are otherwise discarded when generating angiogram. The study enables us to acquire dynamic angiogram and various perfusion parameters simultaneously with one single injection of contrast agent.Acknowledgements
References
[1] Schellinger PD, Bryan RN, Caplan LR, Detre JA, Edelman RR, Jaigobin C, et al. Evidence-based guideline: The role of diffusion and perfusion MRI for the diagnosis of acute ischemic stroke: report of the Therapeutics and Technology Assessment Subcommittee of the American Academy of Neurology. Neurology 2010;75(2):177-85.
[2] Boujan T, Neuberger U, Pfaff J, Nagel S, Herweh C, Bendszus M, et al. Value of Contrast-Enhanced MRA versus Time-of-Flight MRA in Acute Ischemic Stroke MRI. AJNR American journal of neuroradiology 2018;39(9):1710-6.
[3] Riederer SJ, Stinson EG, Weavers PT. Technical Aspects of Contrast-enhanced MR Angiography: Current Status and New Applications. Magnetic resonance in medical sciences : MRMS : an official journal of Japan Society of Magnetic Resonance in Medicine 2018;17(1):3-12.
[4] Asaduddin M, Do WJ, Kim EY, Park SH. Mapping cerebral perfusion from time-resolved contrast-enhanced MR angiographic data. Magnetic resonance imaging 2019;61:143-8.
[5] Do WJ, Seo S, Han Y, Ye JC, Choi SH, Park SH. Reconstruction of multicontrast MR images through deep learning. Medical physics 2020;47(3):983-97.
Figures