1586
The effect of k-space sampling patterns on contrast agent uptake curves in dynamic contrast-enhanced MRI of the breast1Radioisotope & Imaging Physics, The Royal Marsden NHS Foundation Trust, London, United Kingdom, 2St George's University Hospital NHS Foundation Trust, London, United Kingdom
Synopsis
Here we propose a novel method to assess the effect of different k-space sampling patterns on contrast agent uptake curves (CAUCs), which does not require specialist equipment. These effects on CAUCs are often overlooked, and must be addressed in the context of the many different national and international recommendations, and the prominence given to abbreviated DCE protocols. We validated the method to assess different k-space sampling patterns and used it to simulate the effect on contrast-agent uptake curves. We show that conventional protocols acquiring each frame in approximately 60s have more robust CAUC classification than abbreviated protocols.
Introduction
Dynamic contrast-enhanced (DCE) MRI examinations of the breast are recommended for a range of clinical indications, including breast cancer diagnosis, tumour characterisation, treatment management, and screening of women at high-risk of developing breast cancer[1-4]. Malignant breast lesions are associated with rapid enhancement after injection, followed by contrast-agent wash out; different contrast-agent uptake curves (CAUCs) are part of the BI-RADS reporting lexicon, which also includes morphological features[5]. The NHS Breast cancer Screening Programme recommends that each DCE-MRI frame is acquired within 60 seconds[6], but longer acquisitions are commonly used[7, 8] and other institutions make different recommendations[9,10]. Practical restrictions on Radiological resources demand reductions in the total duration of the breast MRI examination, and rapid reporting. “Abbreviated” breast MRI protocols[11,12] have gained popularity, and tend to involve fewer frames acquired post-contrast, usually with higher spatial resolution in longer acquisitions. In designing abbreviated DCE protocols, the detailed characteristics of the pulse sequences and the pattern of k-space coverage are often overlooked. However, there is evidence of the effects of k-space sampling pattern and dynamic range on CAUCs[13]. The population averaged arterial input function is well known[14] and indicates that the signal intensity necessarily varies during the acquisition of post-contrast frames, and hence the image intensity must depend on k-space sampling patterns.In this work, we present a simple practical method to assess the effect of k-space sampling patterns in CAUCs, based on the acquisition of a single dataset on an easily available, dynamic test object. This method allows the user to estimate the weighting of the data associated with each sub-interval for the final image intensity. For a given pattern of contrast-agent uptake, our method can approximate the image intensity at each DCE frame, without any further knowledge of the k-space pattern employed. Our aim is to enable users to compare breast DCE protocols and decide on critical factors that affect the reliability of the measured CAUC. For this purpose, we considered a representative function of contrast agent concentration in tissue for malignant breast lesions, and typical delays to the contrast-agent transit time, and employed the proposed method to compare common breast DCE protocols available in different scanners.
Materials and Methods
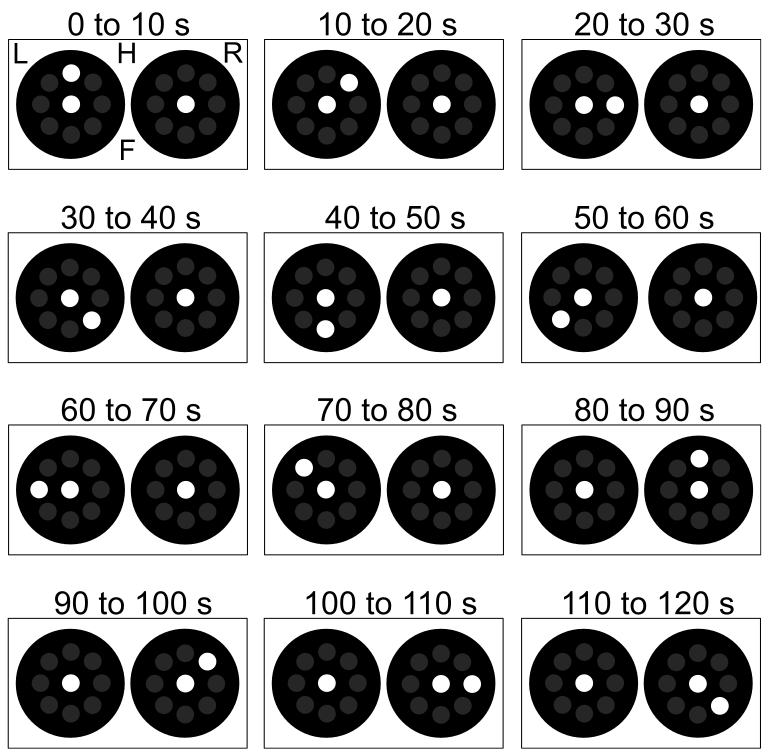
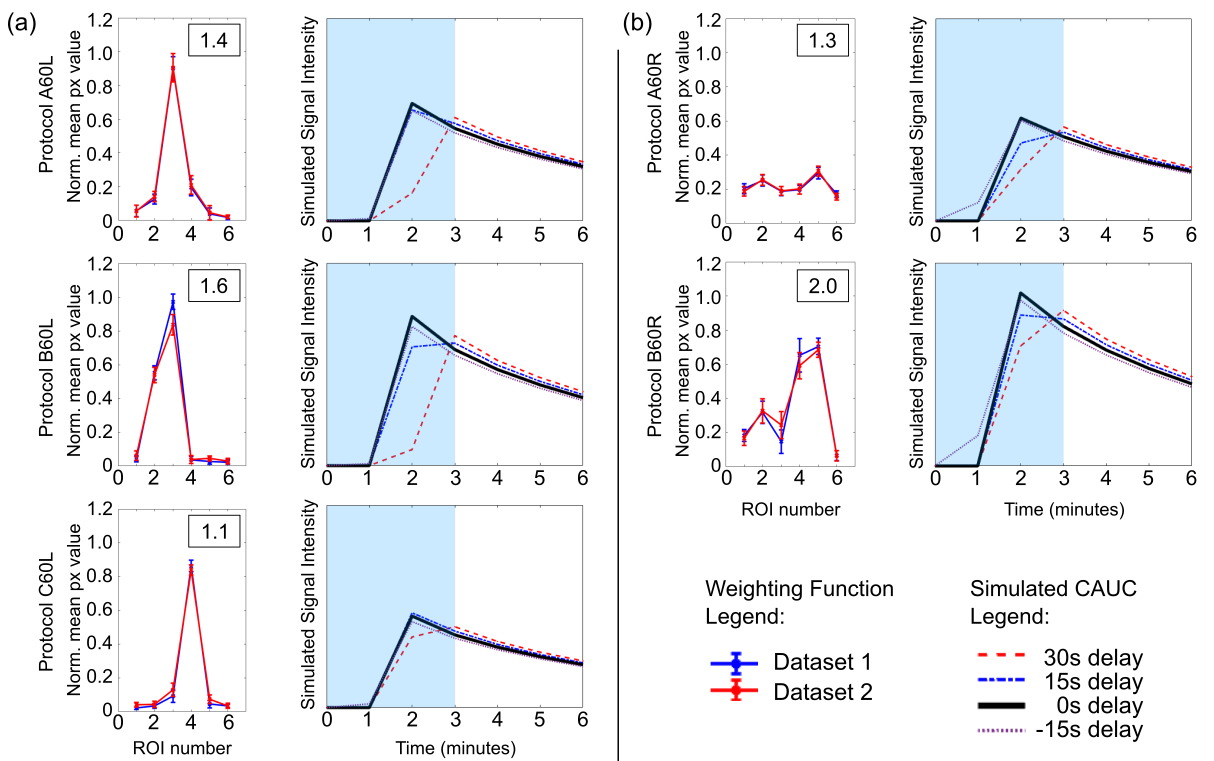
We propose a simple practical method to assess different k-space sampling patterns and their effect on CAUCs based on the acquisition of a simple dynamic test object. In this method the total data acquisition for each frame is divided in a number of shorter partitions, and the position of the test object is modified for each of those sub-intervals (Fig 1 and 2). This allows the user to estimate the weighting of the data partitions associated with a single image frame without any a priori knowledge of the k-space pattern employed.This information has been used in conjunction with a well-known arterial input function in order to simulate the effect of different k-space sampling patterns, and delays to bolus arrival, on a typical (Type-III) malignant CAUC (Fig 3).
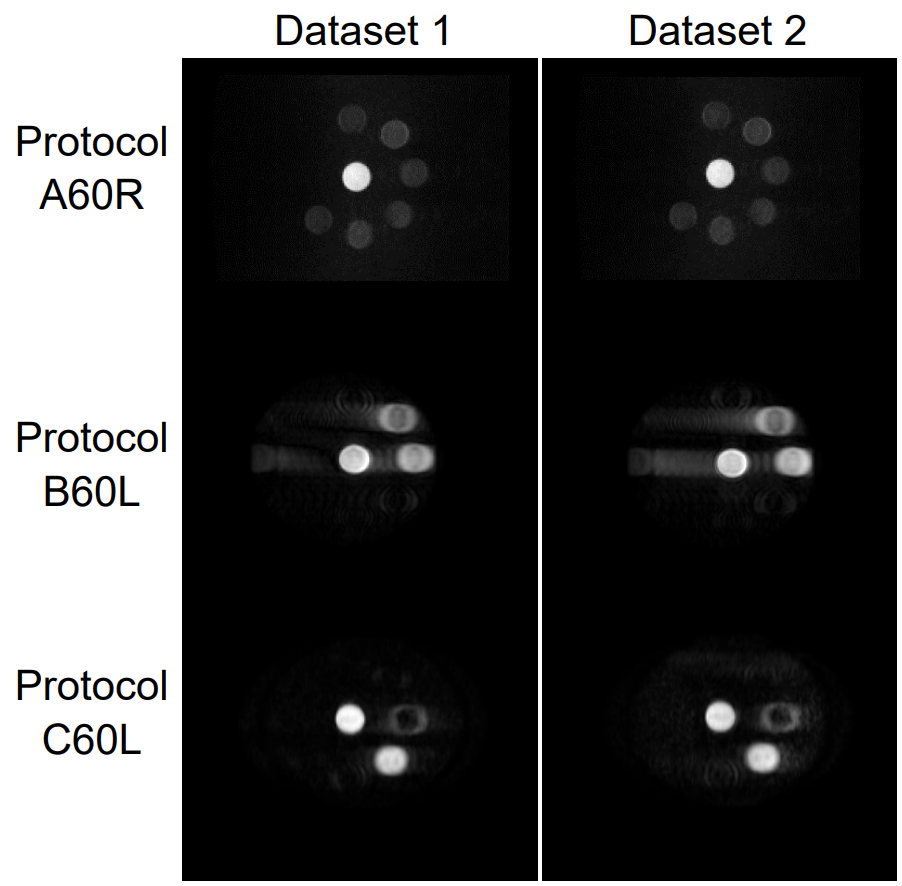
We compared variations of different clinical 3D fat-suppressed breast DCE sequences from three major MR vendors (Siemens MAGNETOM Aera, Erlangen, Germany, Philips Achieva, Best, Netherlands, and GE Signa Excite, Chicago, USA), with acquisitions of 60s per DCE-frame. Protocols were named according to the system (A, B, or C), the acquisition length (60s), and the k-space pattern (e.g. linear). The simulations consider the optimal contrast-agent arrival time, as well as delays and experimental errors (±15s, +30s). Standard protocols and abbreviated protocols (3 frames) were considered. Five protocols were assessed and considerable reliable if they produced Type-III curves under any circumstances, irrespective of bolus delays. For this purpose a Type-III curve was defined by a drop in signal intensity of ≥20% between the peak measurement time-point and final measured time-point.
Results
The signal intensity weighting functions measured for the different protocols proved to be highly reproducible; protocols produced different weighting functions and partitions associated with the acquisition of data at the k-space centre are easily identifiable (Fig 2). For the protocols employing radial k-space coverage the weighting is almost evenly distributed, suggesting oversampling of the central portion of the k-space. For all linear protocols the weighting is concentrated over a short period where the data associated with the k-space centre is acquired. Simulations (Fig 3) showed that for acquisitions of 60s per frame, conventional protocols with 6-frames always produce a reliable Type-III curve regardless of the k-space sampling scheme or bolus delay. However, none of the 3-frame abbreviated protocols with different sampling patterns were able to reproduce the Type-III curve, because the signal drop at the end of the acquisition is within 20% of the peak value.Conclusions
We proposed and demonstrated a simple method to assess the effect of k-space sampling patterns in DCE examinations; it does not require specialist equipment or previous knowledge and the information provided is invaluable to the planning of DCE protocols for breast MRI examinations. Our work demonstrates conventional protocols acquiring each frame in approximately 60s are more robust than abbreviated protocols in terms of CAUC classification. This work shows it is essential to highlight the effect of k-space sampling patterns on typical CAUCs for the standardisation of reliable breast DCE examinations.Acknowledgements
NHS funding to the NIHR Biomedical Research Centre and the Clinical Research Facility in Imaging at the Royal Marsden NHS Foundation Trust. This report is independent research partially funded by the National Institute for Health Research. The views expressed in this publication are those of the authors and not necessarily those of the NHS, the National Institute for Health Research or the Department of Health.References
1. National Institute for Health and Care Excellence, 2018. Early and locally advanced breast cancer: diagnosis and management. NICE NG101. https://www.nice.org.uk/guidance/ng101. Accessed June 18, 2021
2. Biganzoli L, Cardoso F, Beishon M, et al. The requirements of a specialist breast centre. Breast. 2020; 51:65-84.
3. The Royal College of Radiologists, 2019. Guidance on screening and symptomatic breast imaging, Fourth edition. BFCR(19)9.https://www.rcr.ac.uk/publication/guidance-screening-and-symptomatic-breast-imaging-fourth-edition. Accessed June 18, 2021.
4. Monticciolo DL, Newell MS, Moy L, et al. Breast Cancer Screening in Women at Higher-Than-Average Risk: Recommendations From the ACR. J Am Coll Radiol. 2018; 15(3 Pt A):408-414.
5. E. A. Morris et al. ACR BI-RADS® Magnetic Resonance Imaging. In: ACR BIRADS® Atlas, Breast Imaging Reporting and Data System. Reston, VA: American College of Radiology; 2013.
6. Public Health England, 2012. Technical guidelines for magnetic resonance imaging (MRI) for the surveillance of women at higher risk of developing breast cancer. NHSBSP Publication No. 68
7. Heller SL, Moy L. MRI breast screening revisited. J Magn Reson Imaging. 2019;49(5):1212-1221.
8. Kuhl CK, Schild HH, Morakkabati N. Dynamic bilateral contrast-enhanced MR imaging of the breast: trade-off between spatial and temporal resolution. Radiology. 2005 Sep;236(3):789-800.
9. Mann RM, Balleyguier C, Baltzer PA, et al. Breast MRI: EUSOBI recommendations for women’s information. Eur Radiol. 2015;25(12):3669–78
10. American College of Radiology, 2016. ACR practice parameter for the performance of MRI-guided breast interventional procedures. https://www.acr.org/-/media/ACR/Files/Practice-Parameters/MR-Guided-Breast.pdf. Accessed June 18, 2021.
11. Kuhl CK, Schrading S, Strobel K, Schild HH, Hilgers RD, Bieling HB. Abbreviated breast magnetic resonance imaging (MRI): first postcontrast subtracted images and maximum-intensity projection-a novel approach to breast cancer screening with MRI. J Clin Oncol. 2014;32(22):2304-10.
12. Geach R, Jones LI, Harding SA, et al. FAST MRI Study Group. The potential utility of abbreviated breast MRI (FAST MRI) as a tool for breast cancer screening: a systematic review and meta-analysis. Clin Radiol. 2021;76(2):154.e11-154.e22.
13. Ledger AE, Borri M, Pope RJ, et al. Investigating the influence of flip angle and k-space sampling on dynamic contrast-enhanced MRI breast examinations. Acad Radiol.2014;21(11):1394-1401.
14. Parker GJ, Roberts C, Macdonald A, et al. Experimentally-derived functional form for a population-averaged high-temporal-resolution arterial input function for dynamic contrast-enhanced MRI. Magn Reson Med. 2006;56(5):993-1000.
Figures