1584
Comparison of arterial input functions obtained through back-to-back acquisition of DCE and DSC MRI1Imaging Physics, Delft University of Technology, Delft, Netherlands, 2Radiation Oncology, Erasmus Medical Center, Rotterdam, Netherlands, 3Radiology, Erasmus Medical Center, Rotterdam, Netherlands, 4Radiology, Leiden University Medical Center, Leiden, Netherlands
Synopsis
We aimed to compare the AIF determined from DCE-MRI with the AIF from DSC-MRI in back-to-back imaging, using the same dose of Gadobutrol. The DCE-driven AIFs showed the same ‘pattern’ as the DSC-driven AIFs, but had smaller variance of the shape and peak value. A linear relation was found between the contrast agent concentration from DCE and ΔR2*, but the linear coefficients showed large variation across regions and subjects. Our findings show that the DCE-driven AIF has the potential to serve as an alternative for the DSC-driven AIFs for quantitative perfusion assessment.
Purpose
The Arterial Input Function (AIF) plays a crucial role in estimating perfusion properties from Dynamic Susceptibility Contrast MRI (DSC-MRI). An important issue, however, is that measuring the AIF’s absolute contrast concentration is challenging due to uncertainties in the relation with the measured R2*-weighted signal1-3. In addition, several experimental difficulties hinder measuring the AIF in DSC-MRI. First, the AIF can become distorted due to partial volume effects4. Second, the signal in large arteries tends to reach the noise floor during the passage of contrast agent5. Third, signal can be shifted, especially during the peak, due to local resonance frequency changes as induced by the high concentration of contrast agent6. A potential solution could be to derive the AIF from separately acquired Dynamic Contrast Enhanced MRI (DCE-MRI) data, which provides higher spatial resolution, has a known relation between signal-change and Gd-concentration7, and is not susceptible to signal saturation nor vessel displacement6. Such a DCE-scan could be measured during a pre-loading bolus injection, potentially with similar duration as the DSC-scan.In this study, we aim to systematically compare (1) the AIF determined from DCE-MRI with the AIF from DSC-MRI in back-to-back imaging and (2) assess the linearity of the contrast concentration measured from DCE-MRI and the ∆R2* estimated from DSC-MRI.
Methods
Subjects: 4 patients with histologically confirmed, IDH mutated glioma (WHO grade 2 or 3) were recruited as part of the associated RIGEL study (trial identifier: NCT04304300).Imaging: MRI scans were acquired two months before radiotherapy by using a 48-channel head coil in a 3T MRI (Signa Premier, GE Healthcare, Waukesha, WI, USA) in Erasmus Medical Center (Rotterdam, Netherlands). A single dose of Gadobutrol (0.1mmol/kg, Gadovist®, Bayer, Germany) was injected at 5mL/s followed by a 15mL NaCl flush (same injection rate) using a power injector 10 seconds after the start of both DCE and DSC acquisition, respectively. DCE images were acquired using a differential subsampling with cartesian ordering sequence8 with TR/TE: 2.7/0.9ms, flip angle: 14o, FOV: 220×220×142mm3, matrix size: 128×128, 72 slices, in-plane resolution: 1.7×1.7mm2, slice thickness: 2mm, and temporal resolution: 2s, 183 dynamics. DSC images were obtained with a T2*-weighted gradient echo echo-planar imaging sequence with TR/TE: 2000/45ms, FOV: 220×220×140mm3, matrix size: 100×100, 29 slices, in-plane resolution: 2.2×2.2mm2, slice thickness: 5mm, temporal resolution: 2s, 50 dynamics.
Analysis: Rigid-body registration was performed to align all DSC images to the first volume of DCE images by SPM129. AIFs were selected manually and semi-automatically: (1) five Region-Of-Interests (ROIs) were annotated in the DCE images, each in a different artery and on a different slice; (2) these selected ROIs were then projected onto the registered DSC images; all voxels included within the ROI were used for AIF-determination (3) a semi-automatic approach10, based on a clustering approach favoring early bolus arrival time, high peak value and fitting with a gamma function, was implemented to derive five AIFs from the same DSC slices as previous step.
The DCE-driven AIF (1) was derived from the annotated region according to a previously published approach11, in which Orton’s model was used to estimate the perceived number of excitation pulses to compensate inflow effects. The DSC-driven AIFs (2)(3) were estimated by assuming a linear relation between ∆R2* and contrast agent concentration12.
Subsequently, the AIFs were plotted to visually explore their characteristics. Furthermore, the linearity of the relation between the DCE-driven and DSC-driven AIFs was assessed.
Results
Fig.1 shows the DSC and DCE AIFs, obtained from multiple voxels in a representative vessel. It demonstrates that while the mean curves had similar shapes, the DCE-AIF yielded much more consistent curves (less variation) (Fig.1c,d). Furthermore, the DCE-AIFs from different arteries, from different slices, and from different subjects exhibited more reproducible results than the DSC-AIFs (Fig.2). Finally, the semi-automatically selected DSC-AIFs demonstrated higher peak values and narrower width than derived from manually selection and as compared to the DCE-AIF (Fig.3).Fig.4 shows the scatter plot of the DCE-AIF and DSC-AIF for one artery in each of the four patients. The DCE-based contrast agent concentration correlated significantly (P<0.05) to the ΔR2* in each plot, although the linear coefficients varied from 4.2 to 11.2 over the 4 patients.
Discussion
The shape and the peak value of the AIF are key factors for quantitative estimation of perfusion parameters from DSC-MRI. However, true quantification of the contrast agent concentration is a challenging problem in DSC-MRI due to susceptibility effects resulting in non-linear partial volume and vessel-shifting artefacts. It can be observed that the DCE-driven AIFs show the same ‘pattern’ as the DSC-driven AIFs, but had smaller variance of the shape and peak value. This is an indication that the DCE-driven AIF could be a more reliable option for quantifying perfusion properties from DSC-MRI. We found a strong linear relation between the contrast agent concentration from DCE and ΔR2*, but the linear coefficients showed large variation, again pointing to poor quantification of the AIF by DSC.Conclusion
Our findings show that the DCE-driven AIF has the potential to serve as an alternative for the DSC-driven AIFs for quantitative perfusion assessment. Also, the semi-automatic method did not prevent erroneous AIF selection from DSC images.Acknowledgements
We are thankful to HollandPTC-Varian consortium for their support (project 2018017)References
- Knutsson L, Ståhlberg F, Wirestam R (2010) Absolute quantification of perfusion using dynamic susceptibility contrast MRI: pitfalls and possibilities. Magn Reson Mater Phy 23(1):1–21
- Akbudak E, Kotys M, Conturo T (2004) Quadraticity and haematocrit dependence of ΔR2* AIF signals at 3T: a blood phantom study under physiologic conditions. Syllabus of the ISMRM workshop on quantitative cerebral perfusion imaging using MRI; a technical perspective. Venice, Italy, pp 10–11
- Kjølby BF, Østergaard L, Kiselev VG (2006) Theoretical model of intravascular paramagnetic tracers effect on tissue relaxation. Magn Reson Med 56(1):187–197
- van Osch MJ, Vonken EJ, Bakker CJ, Viergever MA (2001) Correcting partial volume artifacts of the arterial input function in quantitative cerebral perfusion MRI. Magn Reson Med 45(3):477–485
- M. Ebinger, P. Brunecker, G.J. Jungehulsing, U. Malzahn, C. Kunze, M. Endres, J.B. Fiebach, Reliable perfusion maps in stroke MRI using arterial input functions derived from distal middle cerebral artery branches, Stroke 41 (2010) 95–101.
- Rausch M, Scheffler K, Rudin M, Radü EW (2000) Analysis of input functions from different arterial branches with gamma variate functions and cluster analysis for quantitative blood volume measurements. Magn Reson Imaging 18(10):1235–1243.
- Shen Y, Goerner FL, Snyder C, Morelli JN, Hao D, Hu D, Li X, Runge VM. T1 relaxivities of gadolinium-based magnetic resonance contrast agents in human whole blood at 1.5, 3, and 7 T. Invest Radiol. 2015 May;50(5):330-8. doi: 10.1097/RLI.0000000000000132. PMID: 25658049.
- Saranathan M, Rettmann DW, Hargreaves BA, Clarke SE, Vasanawala SS. DIfferential Subsampling with Cartesian Ordering (DISCO): a high spatio-temporal resolution Dixon imaging sequence for multiphasic contrast enhanced abdominal imaging. J Magn Reson Imaging. 2012;35(6):1484-1492. doi:10.1002/jmri.23602
- , , , , , & (1994). Statistical parametric maps in functional imaging: A general linear approach. Human Brain Mapping, 2(4), 189–210.
- Peruzzo D, Bertoldo A, Zanderigo F, Cobelli C. Automatic selection of arterial input function on dynamic contrast-enhanced MR images. Comput Methods Programs Biomed. 2011;104(3):e148-e157. doi:10.1016/j.cmpb.2011.02.012
- van Schie, J., Lavini, C., van Vliet, L. and Vos, F., 2017. Estimating the arterial input function from dynamic contrast-enhanced MRI data with compensation for flow enhancement (I): Theory, method, and phantom experiments. Journal of Magnetic Resonance Imaging, 47(5), pp.1190-1196.
- ØStergaard, L., Weisskoff, R. M., Chesler, D. A., Gyldensted, C., & Rosen, B. R. (1996). High resolution measurement of cerebral blood flow using intravascular tracer bolus passages. Part I: Mathematical approach and statistical analysis. Magnetic Resonance in Medicine, 36(5), 715–725. doi:10.1002/mrm.1910360510
Figures
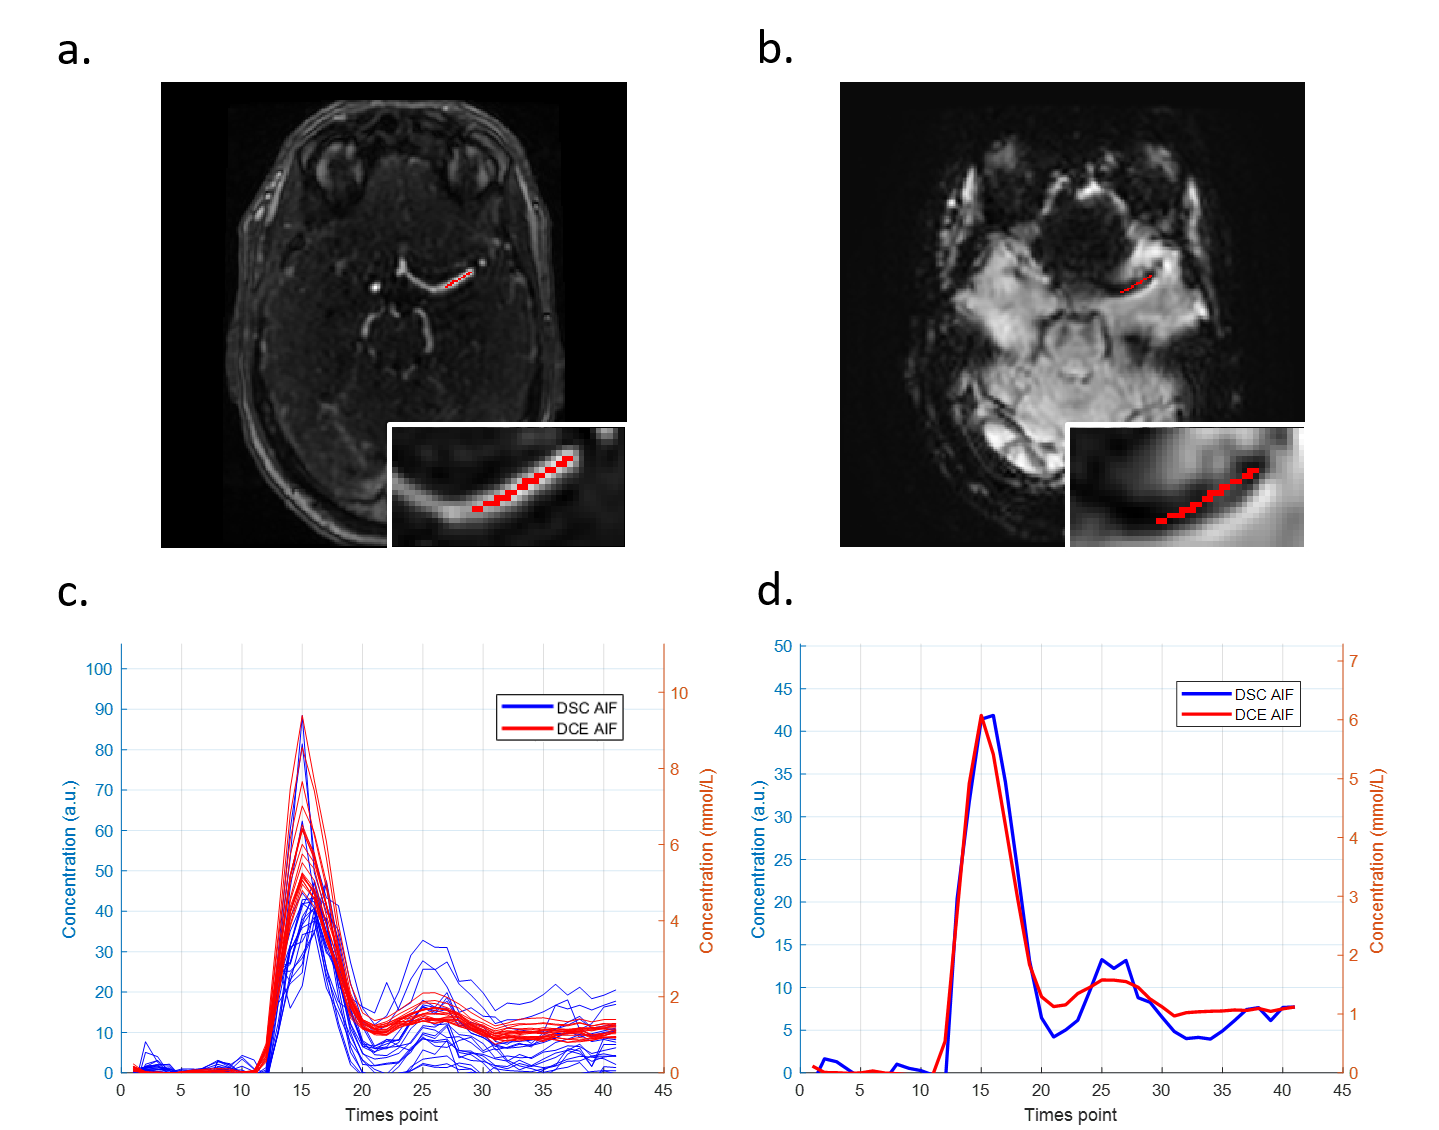
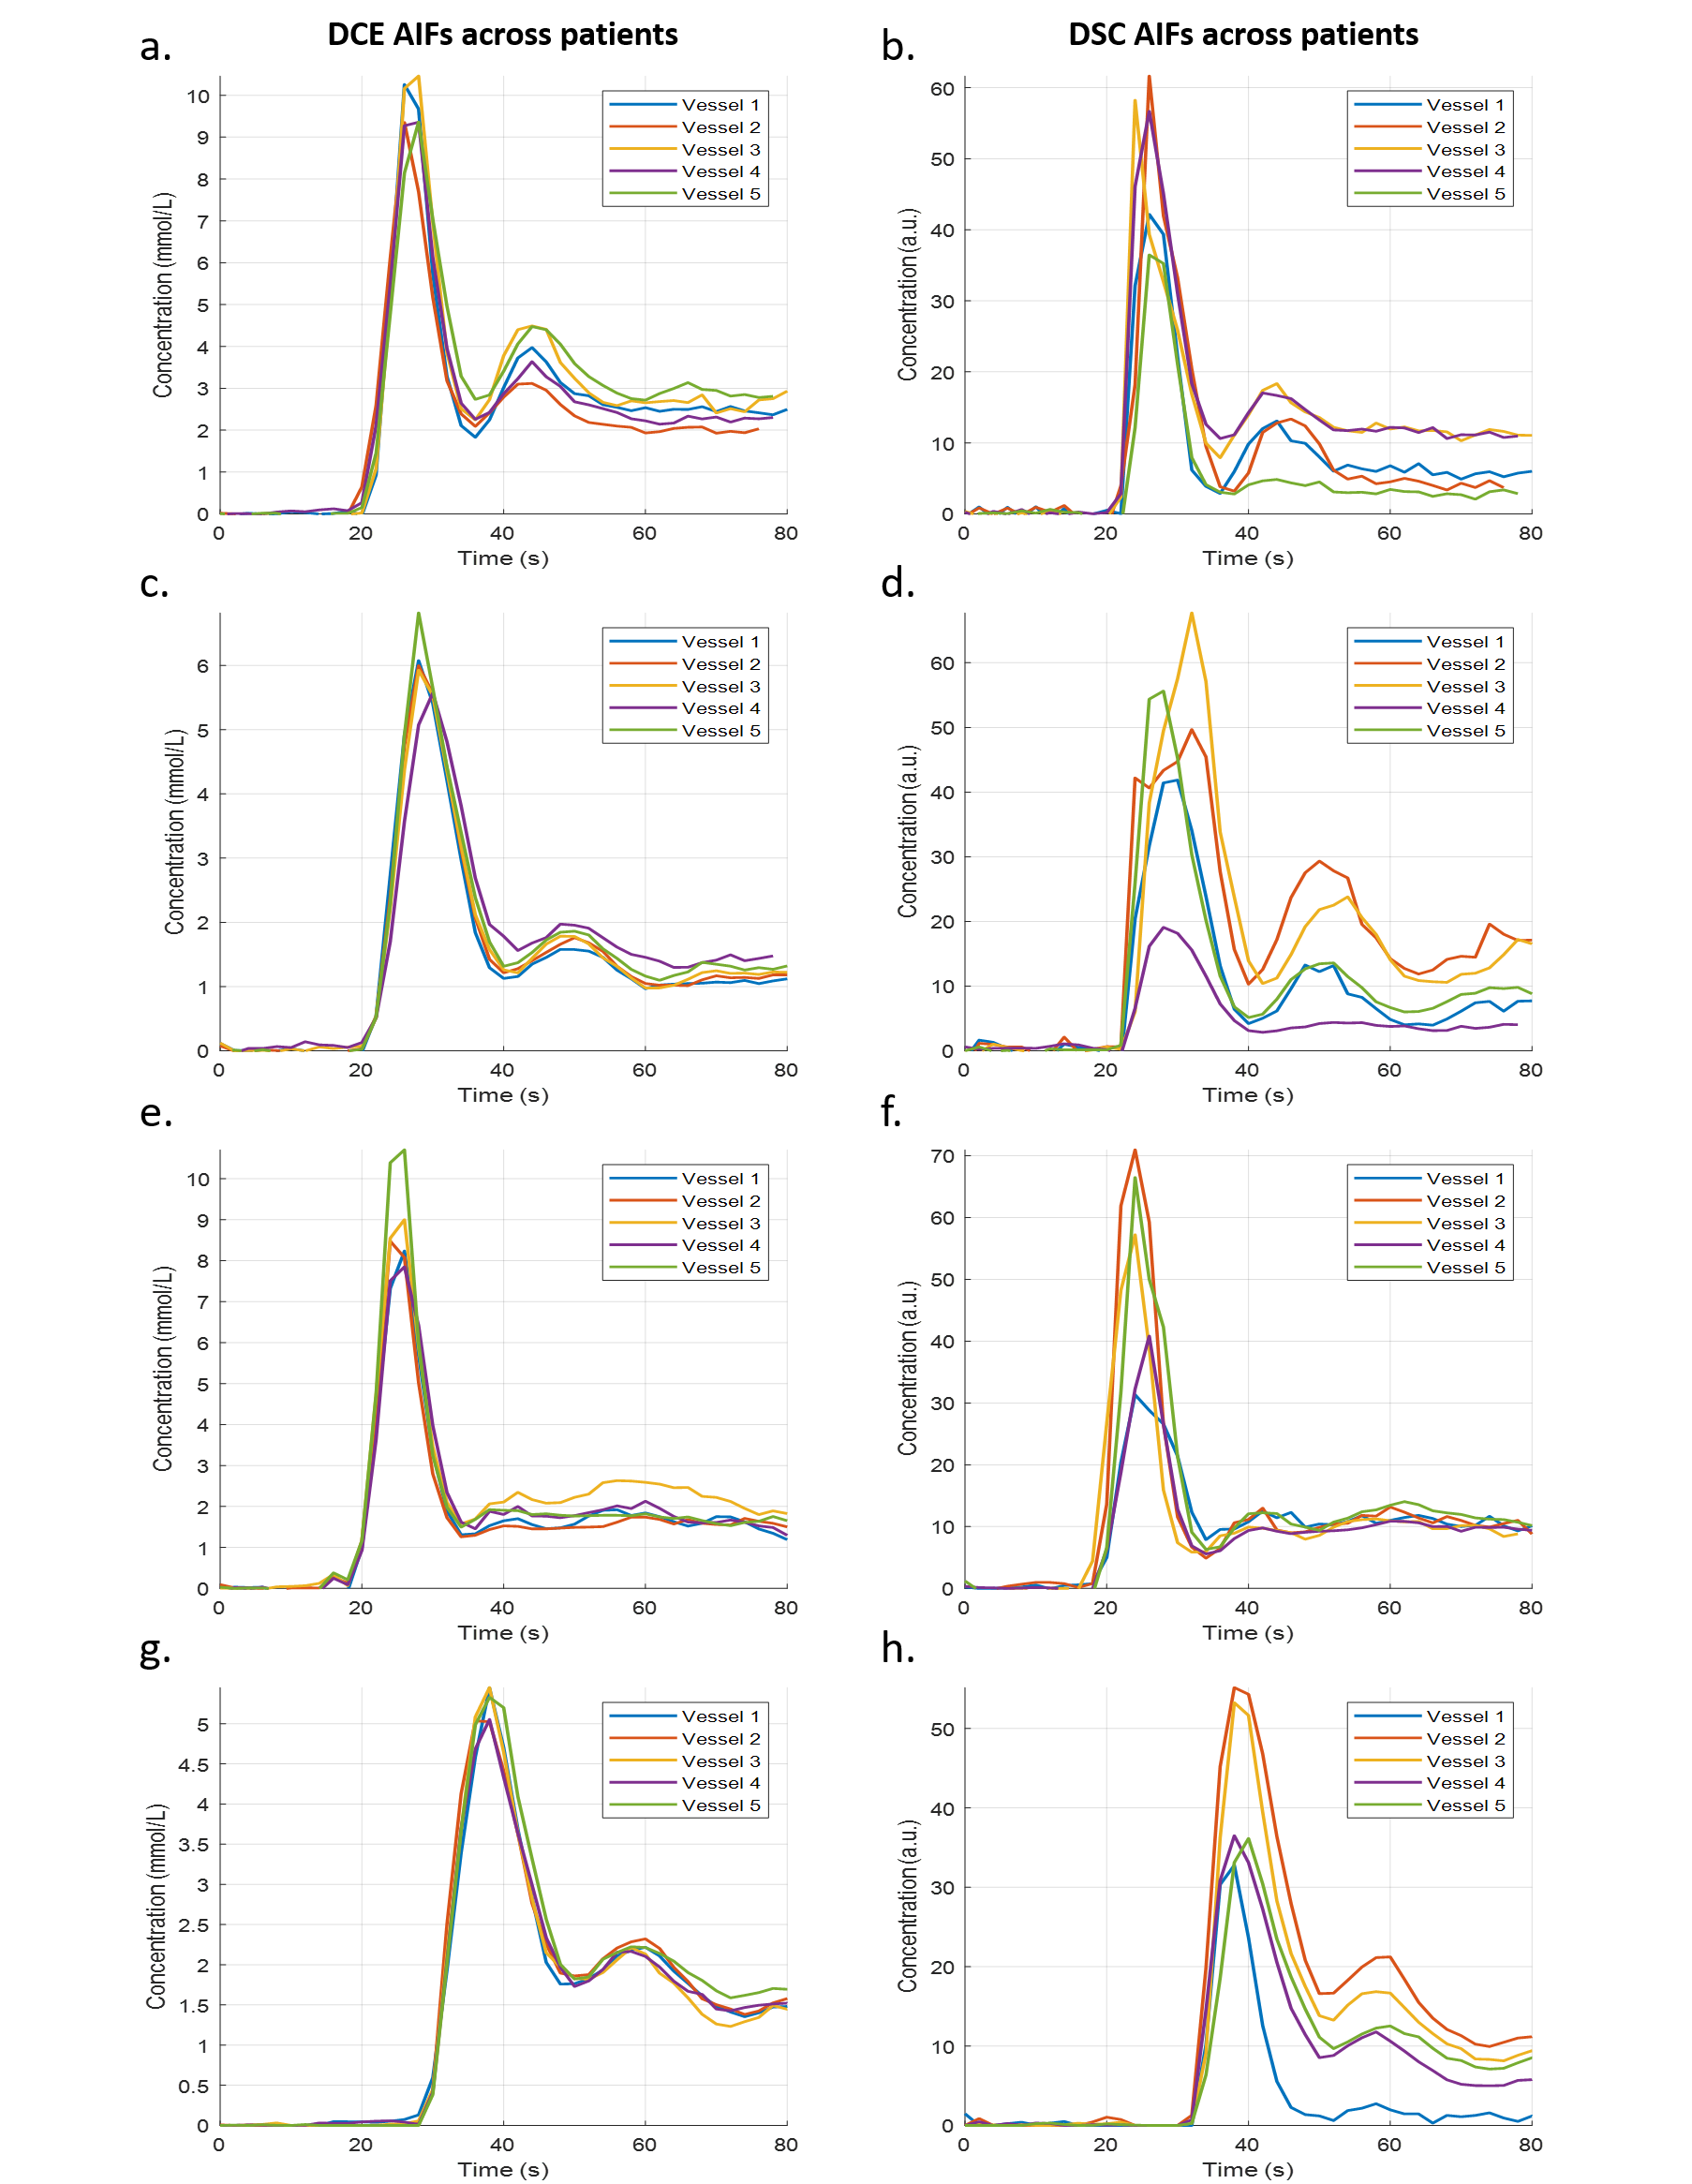
Figure 2. AIFs measured from five vessels in 4 patients (top to bottom) were plotted to test the reproducibility and stability of accessing AIFs from DCE images and DSC images. Observe that the DCE-driven AIFs (a, c, e, g) showed less variation than the DSC-driven AIFs did (b, d, f, h).
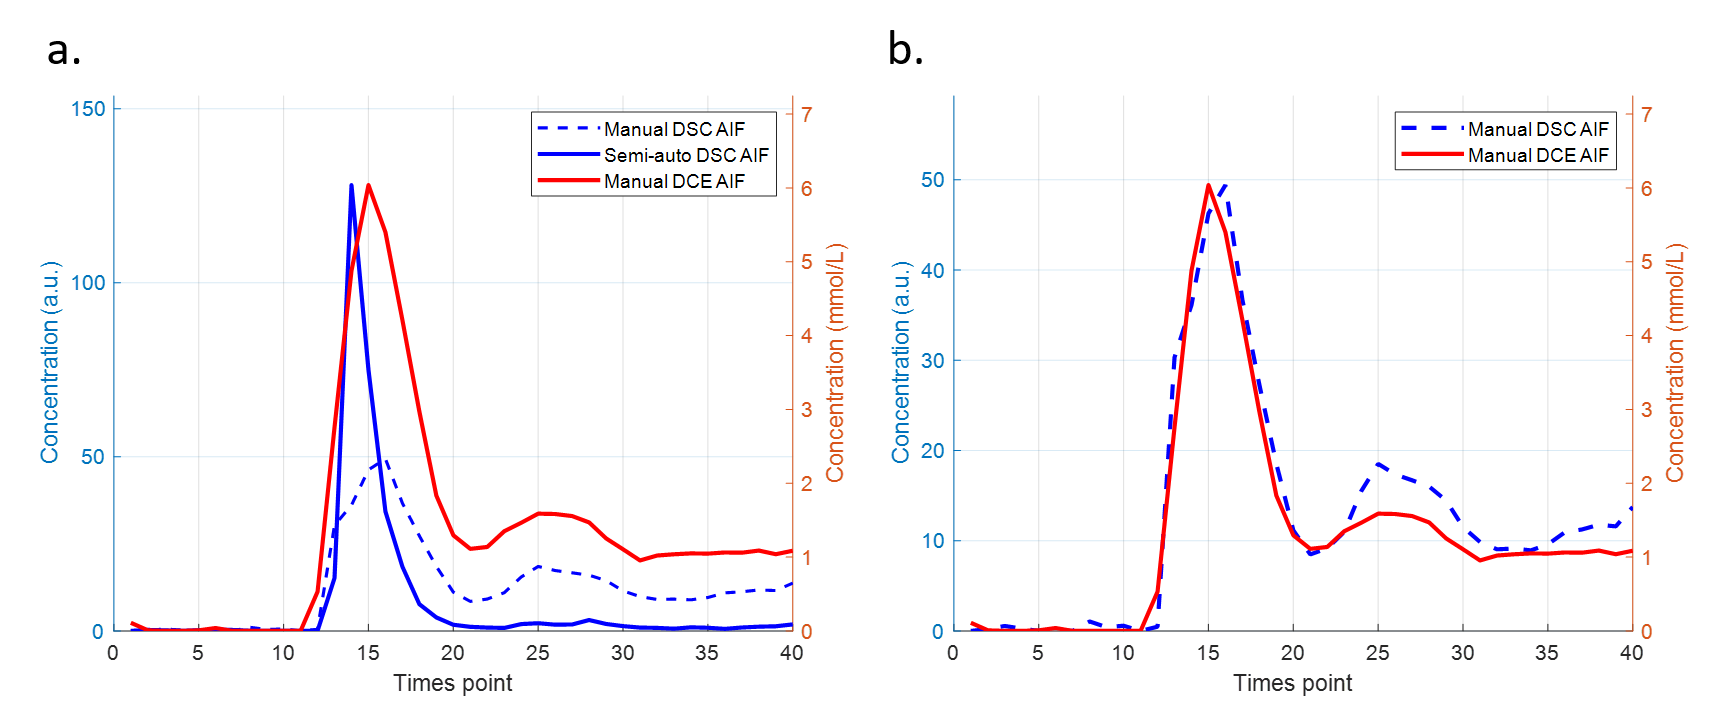
Figure 3. Comparison of the AIF obtained with a semi-automatic algorithm (blue solid line) and manually derived AIFs. The peak of the manual DCE AIF was aligned with the peak of the semi-automatic AIF (a) and the manual DSC AIF (b), respectively. Notice that the semi-automatically determined DSC-AIF has higher peak value than the manual one (blue dash line). However, it has around twice less full width at half maximum than the DCE-driven AIF (red solid line) has. (Only AIFs from one vessel of the representative patient were plotted in this graph.)
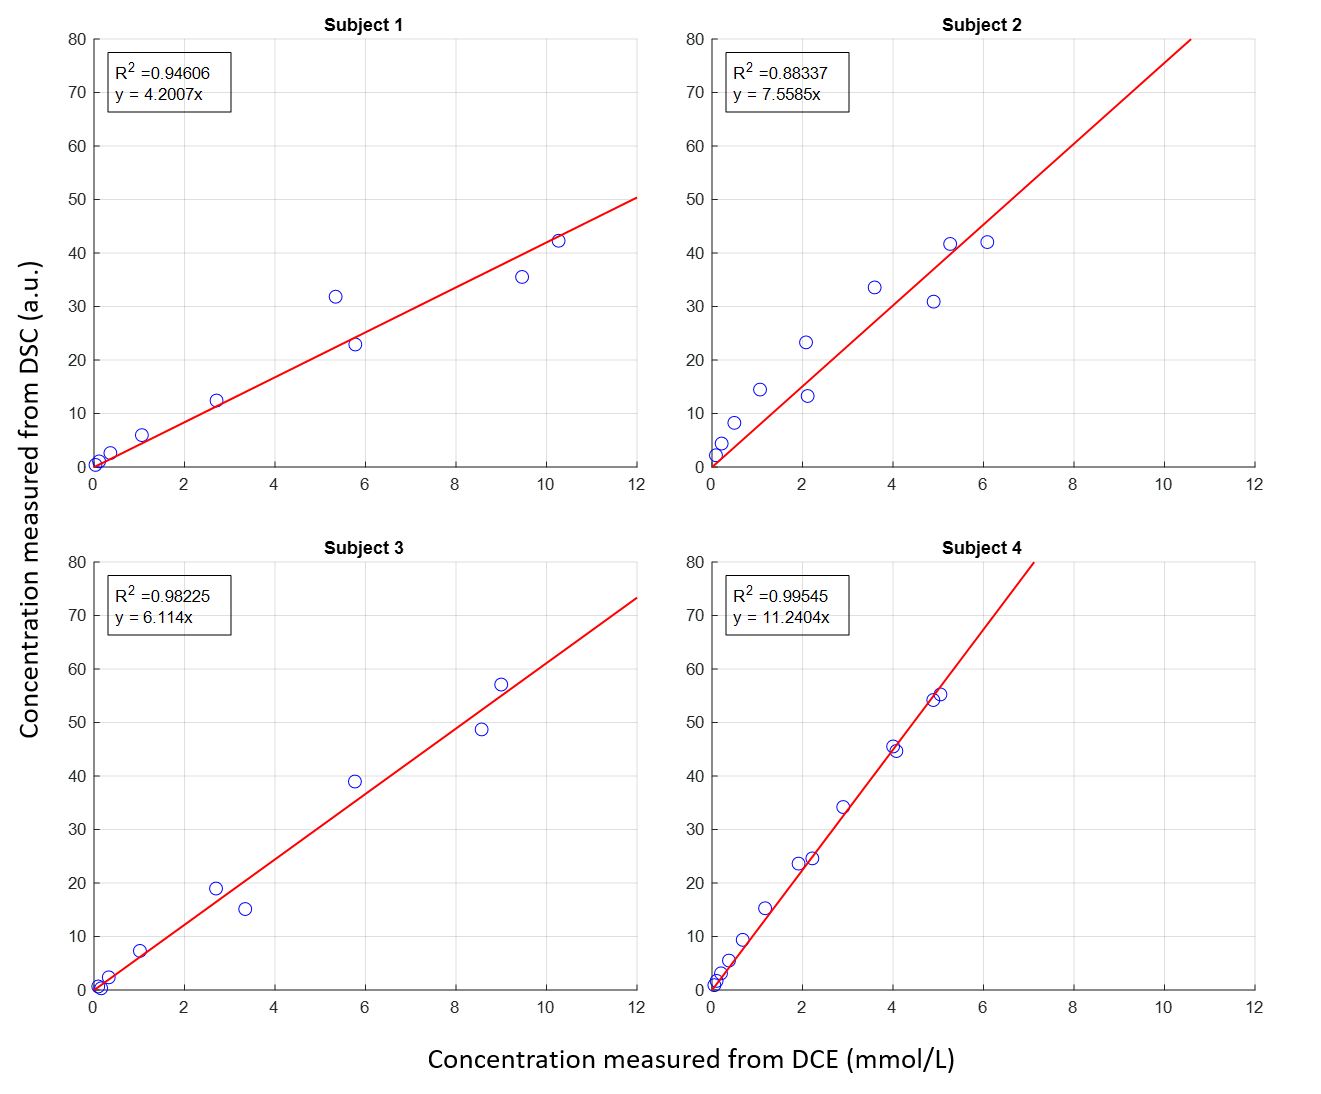
Figure 4. Linear regression model was used to estimate the linearity between the transverse relaxivity change (y-axis) and the contrast concentration change (x-axis) in one vessel which had the highest R-squared value in the 4 patients (a-d). The linear relation is significant but with varied linear coefficients in different patients.