1581
To what extent is DSC-MRI able to detect subtle blood-brain barrier leakage in cerebral small-vessel disease?1Radiology and Nuclear Medicine, Maastricht University Medical Center +, Maastricht, Netherlands, 2School for Mental Health and Neuroscience, Maastricht University, Maastricht, Netherlands, 3CARIM School for Cardiovascular Diseases, Maastricht University, Maastricht, Netherlands, 4Neurology, Maastricht University Medical Center +, Maastricht, Netherlands, 5Electrical Engineering, Eindhoven University of Technology, Eindhoven, Netherlands
Synopsis
This study investigated to what extent blood-brain barrier
(BBB) leakage (1) can be measured with DSC-MRI and (2) is influenced by
perfusion. In vivo DCE (golden-standard) and DSC data of patients with cerebral
small vessel disease (cSVD) and elderly controls were used, as well as
simulations of signal curves. DSC-MRI, in contrast to DCE-MRI, is not sensitive
enough to measure subtle leakage in cSVD. Further research is required to
better disentangle perfusion effects from leakage, and therefore correction
methods should be used with caution for measuring subtle leakage.
Introduction
Blood-brain barrier (BBB) impairment was previously linked to several pathologies, including cerebral small vessel disease (cSVD)1. Traditionally, BBB integrity is assessed by dynamic contrast-enhanced (DCE) MRI, which can measure subtle BBB leakage2. Recently, it has been suggested that (single-echo) dynamic susceptibility contrast (DSC) MRI can be used not only to assess cerebral blood volume (CBV) and flow (CBF), but also leakage of contrast agent (CA) across the BBB3,4.When CA leaks into the parenchyma, the DSC signal is affected by both T1- and T2*-effects. The most well-known method to correct for these leakage effects is the Boxerman-Schmainda-Weisskoff (BSW) model5, which is often applied in substantially leaking brain tumors. This model uses a reference concentration curve derived from non-leaking voxels. However, it does not account for perfusion effects, e.g. variations in mean transit time between healthy and diseased tissue. Therefore, Leigh et al. adapted the BSW-model to incorporate arrival time correction (ATC)6.
The current golden-standard measurement for BBB leakage, DCE-MRI, is time-consuming (>20 min), whereas DSC-MRI scans are short (ca. 2 min) and already provides information on perfusion. Therefore, DSC-MRI could be an attractive alternative for BBB leakage detection. However, it is unclear whether DSC-MRI is suitable for detecting subtle brain leakage.
This study investigated to what extent BBB leakage (1) can be measured with DSC-MRI and (2) is influenced by perfusion. In vivo DCE (golden-standard) and DSC data of cSVD patients and elderly controls were used, as well as computer simulations.
Methods
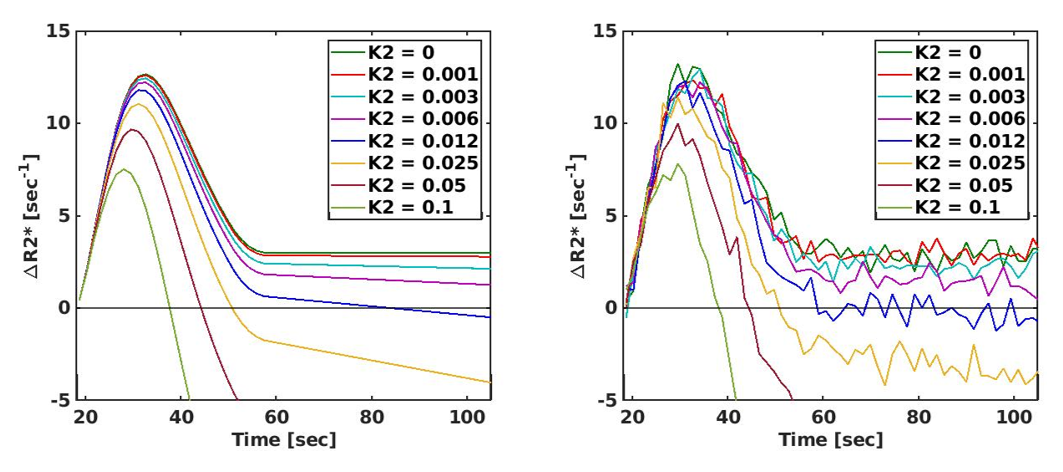
MRI acquisition: DCE- and single-echo DSC-MRI data were acquired in 15 cSVD patients and 12 elderly controls at 3T (Philips Achieva TX)7. Additionally, T1-weighted and T2-weighted sequences were acquired for anatomical reference (Table 1).Simulations: A realistic, non-leaking DSC relaxation curve was mimicked based on in vivo data. The leakage fraction (K2) was incorporated according to the BSW-method (Equation 1), after which noise (derived from in vivo data) was added. K2 values were calculated from 100 simulated curves for each K2 value, where values above the limit of quantification (LOQ) (SNR≥10) were assumed reliable.
Data analysis: Both DCE and DSC images were corrected for subject motion (FSL). Voxel-specific leakage rates (Ki) were obtained from DCE-MRI data using Patlak modeling and histogram correction2 to represent the ground-truth BBB leakage level.
The DSC-derived leakage fraction was obtained voxel-wise using two methods: the basic BSW-method5 (Equation 1), and the extended BSW-model correcting for ATC6 (Equation 2). Furthermore, CBV and CBF maps were calculated using an arterial input function from manually selected voxels in the middle cerebral artery8.
\begin{equation}{\triangle}\widetilde{R}2^{*}(t)=K1\overline{{\triangle}R2^{*}}(t)-K2_{BSW}\int_{0}^{t}\overline{{\triangle}R2^{*}}(t')dt'\;\;\;\;\;\;\;\;\;[Eq.1]\end{equation}\begin{equation}\triangle\widetilde{R}2^{*}(t)_{ATC}=\overline{{\triangle}R2^{*}}(t)-K2_{ATC}\int_{0}^{t}\overline{{\triangle}R2^{*}}(t')dt'\;\;\;\;\;\;\;\;\;[Eq.2]\end{equation} With $$$K1=$$$ proportional constant, $$$\overline{{\triangle}R2^{*}}=$$$ average concentration from non-enhancing voxels, and $$${\triangle}\widetilde{R}2^{*}(t)_{ATC}=\gamma\overline{{\triangle}R2^{*}}(\frac{t+\tau}{\alpha})$$$ with $$$\gamma$$$, $$$\alpha$$$ and $$$\tau=$$$ ATC scaling factors in height and width, and time offset respectively.
Segmentation of the normal-appearing white matter (NAWM) and gray matter (GM) was performed using Freesurfer9. White matter hyperintensities (WMH) were semi-automatically segmented from the NAWM10. Region masks were co-registered to DCE and DSC image space.
Statistics: To compare the outcome measures between all ROIs, within-subject ANOVAs with subsequent post-hoc analyses and Bonferroni correction were conducted (p<0.05 is significant). The relationship between K2 and perfusion measures was assessed using Pearson’s correlation.
Results
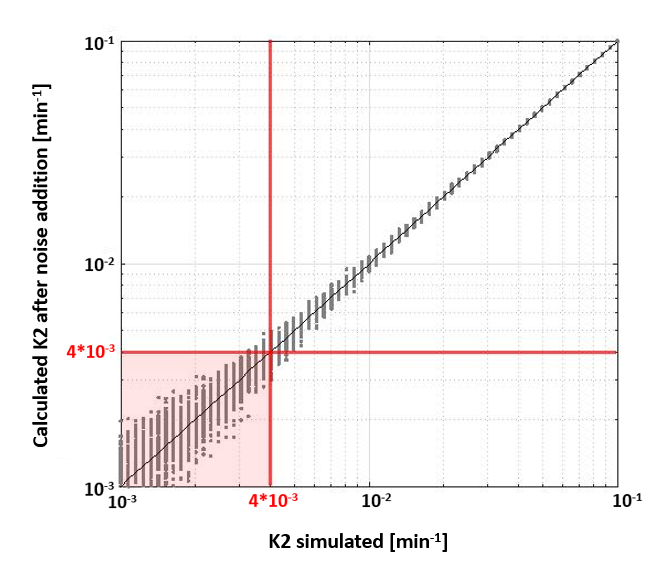
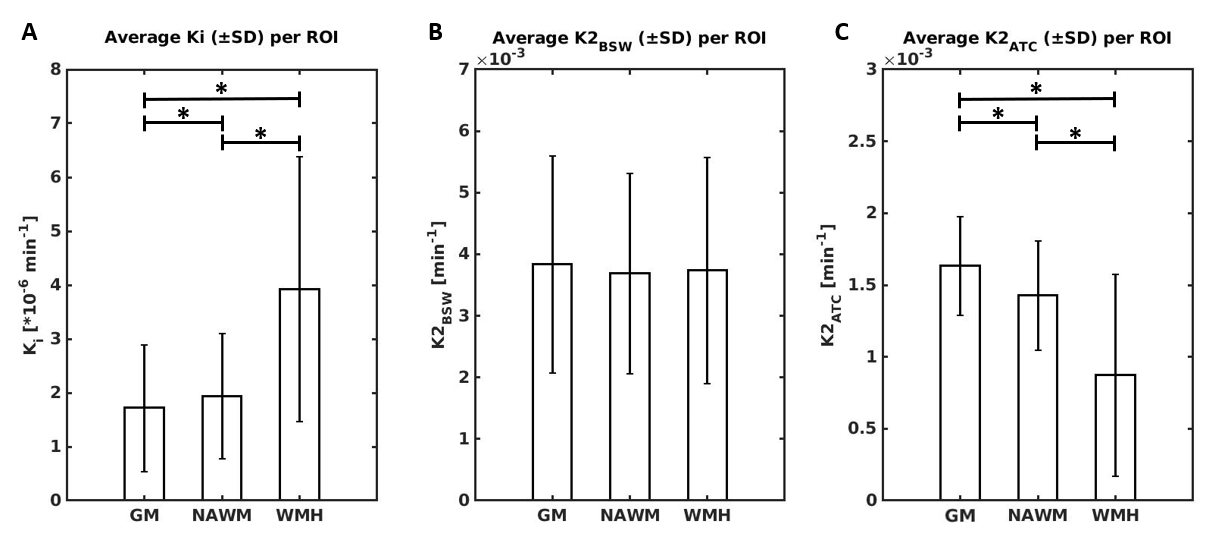
Simulations: Figure 1 shows how increasing K2 values change the shape of the relaxivity-time curves. Note that two curves with very low K2 values (<0.01 min-1) can barely be distinguished after noise addition. Simulations showed that K2 can be measured up to the LOQ of 4*10-3 min-1 (Figure 2).Data analysis: Post-hoc analyses identified a significantly higher Ki in the NAWM compared to GM (p=0.012) and WMH compared to NAWM and GM (both p<0.001) (Figure 3A).
K2BSW did not significantly differ between regions (F=-0.377, p=0.557) (Figure 3B). However, after ATC, post-hoc analyses revealed a significantly lower leakage fraction (K2ATC) in the NAWM compared to GM and WMH compared to NAWM and GM (all p<0.001) (Figure 3C). Further analyses revealed that the ATC scaling factor γ was significantly negatively correlated with DSC-derived perfusion measures (r=-0.512, r=-0.491 and r=-0.517 for K2ATC, CBV, and CBF respectively, p<0.001).
Discussion
Two DSC analysis methods were evaluated for detecting subtle BBB leakage. In line with previous research11, the DCE-derived leakage rate Ki was found to be significantly elevated in WMH compared to NAWM and GM. From simulations, a detection limit for K2 was determined at 4*10-3 min-1. For the leakage fraction obtained with the BSW-method (K2BSW), no significant differences were found between tissue types, which is in line with these values being lower than the detection limit obtained from simulations.After performing ATC, the leakage fraction (K2ATC) became lower in WMH compared to other tissue types. Interestingly, the perfusion parameters CBV, CBF, and the ATC scaling factor γ, varied in a parallel way over the various tissue types, which could indicate that the ATC correction method introduces obfuscating perfusion effects. We therefore argue that the BSW-method, with or without ATC correction, is not suited for the detection of subtle leakage.
Conclusion
DSC-MRI, in contrast to DCE-MRI, is not sensitive enough to measure subtle leakage in cSVD. Further research is required to better disentangle perfusion effects from leakage, and therefore correction methods should be used with caution for measuring subtle leakage.Acknowledgements
This work is part of the program Translational Research 2 with project number 446002509, funded by ZonMw/Epilepsiefonds Nederland.References
1. Zhang CE, Wong SM, van de Haar HJ, et al. Blood–brain barrier leakage is more widespread in patients with cerebral small vessel disease. Neurology. 2017;88(5):426-432.
2. Haar HJ, Jansen JFA, Jeukens CRLPN, et al. Subtle blood‐brain barrier leakage rate and spatial extent: Considerations for dynamic contrast‐enhanced MRI. Med Phys. 2017;44(8):4112-4125.
3. Dewey BE, Xu X, Knutsson L, et al. MTT and blood-brain barrier disruption within asymptomatic vascular WM lesions. Am J Neuroradiol. 2021;42(8):1396-1402.
4. Etherton MR, Wu O, Cougo P, et al. Sex-specific differences in white matter microvascular integrity after ischaemic stroke. Stroke Vasc Neurol. 2019;4(4):198-205.
5. Boxerman JL, Schmainda KM, Weisskoff RM. Relative Cerebral Blood Volume Maps Corrected for Contrast Agent Extravasation Significantly Correlate with Glioma Tumor Grade , Whereas Uncorrected Maps Do Not. Ajnr Am J Neuroradiol. 2006;27(4):859-867.
6. Leigh R, Jen SS, Varma DD, Hillis AE, Barker PB. Arrival Time Correction for Dynamic Susceptibility Contrast MR Permeability Imaging in Stroke Patients. Herholz K, ed. PLoS One. 2012;7(12):e52656.
7. Wong SM, Jansen JFA, Zhang CE, et al. Blood-brain barrier impairment and hypoperfusion are linked in cerebral small vessel disease. Neurology. 2019;92(15):e1669-e1677.
8. Zaharchuk G. Theoretical basis of hemodynamic MR imaging techniques to measure cerebral blood volume, cerebral blood flow, and permeability. Am J Neuroradiol. 2007;28(10):1850-1858.
9. Fischl B, Salat DH, Busa E, et al. Whole brain segmentation: Automated labeling of neuroanatomical structures in the human brain. Neuron. 2002;33(3):341-355.
10. de Boer R, Vrooman HA, van der Lijn F, et al. White matter lesion extension to automatic brain tissue segmentation on MRI. Neuroimage. 2009;45(4):1151-1161.
11. Li Y, Li M, Zhang X, et al.
Higher blood–brain barrier permeability is associated with higher white matter
hyperintensities burden. J Neurol. 2017;264(7):1474-1481.
Figures
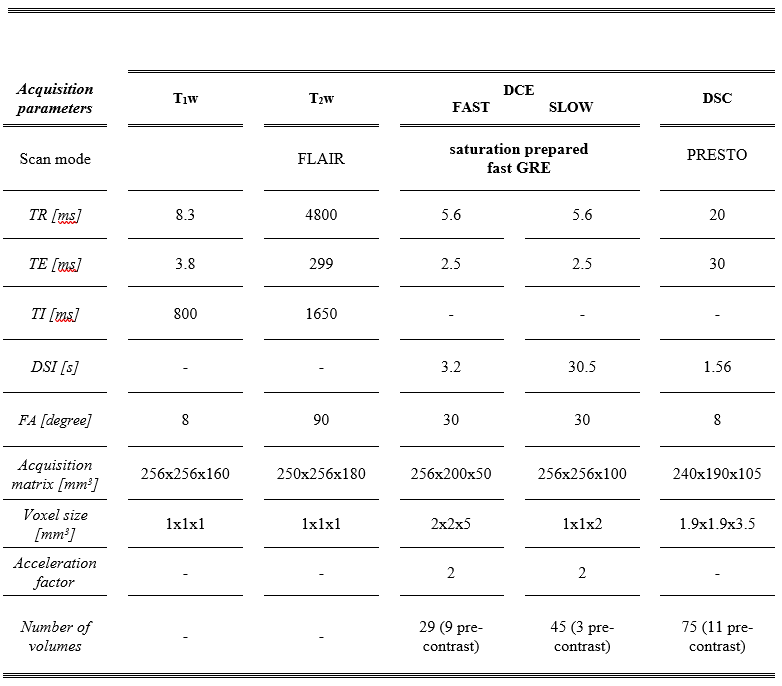
Table 1. This table summarizes the acquisition parameters of the sequences used in this study.
FLAIR, Fluid Attenuated Inversion Recovery; DCE,
Dynamic Contrast Enhanced; GRE, Gradient Echo; DSC, Dynamic Susceptibility
Contrast; PRESTO, PRinciples of Echo Shifting using a Train of Observations; DSI,
Dynamic Scan Interval; TR, repetition time; TE, echo time; TI, inversion time; FA,
Flip Angle.