1578
Hybrid PET/MRI Dual-Condition Framework for Response Monitoring in Myocardial Infarction
Fayez Habach1,2, Jennifer Barry3, Melissa Larsen3, Marne Jamieson4, Amit Singnurkar5, Michael Laflamme6, and Nilesh Ghugre1,2
1Medical Biophysics, University of Toronto, Toronto, ON, Canada, 2Physical Sciences, Sunnybrook Research Institute, Toronto, ON, Canada, 3Schulich Heart Research Program, Sunnybrook Research Institute, Toronto, ON, Canada, 4Nuclear Medicine, Sunnybrook Health Sciences Centre, Toronto, ON, Canada, 5Medical Imaging, Sunnybrook Health Sciences Centre, Toronto, ON, Canada, 6Mcewen Stem Cell Institute, University Health Network, Toronto, ON, Canada
1Medical Biophysics, University of Toronto, Toronto, ON, Canada, 2Physical Sciences, Sunnybrook Research Institute, Toronto, ON, Canada, 3Schulich Heart Research Program, Sunnybrook Research Institute, Toronto, ON, Canada, 4Nuclear Medicine, Sunnybrook Health Sciences Centre, Toronto, ON, Canada, 5Medical Imaging, Sunnybrook Health Sciences Centre, Toronto, ON, Canada, 6Mcewen Stem Cell Institute, University Health Network, Toronto, ON, Canada
Synopsis
Hybrid PET/MRI is a promising tool that can characterize both metabolic and structural information and has been used extensively in the context of MI-related heart failure. We propose a novel dual-condition protocol that can be used to characterize metabolic state of cardiac tissue in vivo following MI, under different substrate conditions. Our results show significant metabolic changes under fasting and glucose loading conditions, and further longitudinal differences in MI-related metabolic remodeling within both the infarct zone and surrounding myocardium. This framework has potential to be used in testing therapeutic efficacy following MI in both preclinical and clinical contexts.
Introduction
Over the past few decades, the characterization of myocardial infarction (MI) and the consequent structural remodeling of the heart has revealed much about the functional consequences that eventually lead to heart failure.1 Several treatments have held promise for the recovery of damaged heart tissue, including acellular biomaterial scaffolds, endogenous therapies, and stem cell based treatments.2 For successful clinical translation, Magnetic Resonance Imaging (MRI) can elucidate structure, function, and viability, and evaluate treatment efficacy. MRI is the gold standard for cardiac function and viability assessment and provides excellent soft tissue contrast for detection of edema and fibrosis with high spatial resolution.3 In addition, Positron Emission Tomography (PET) can offer metabolic information, as well as status on inflammatory processes.4 PET imaging with selective radiotracers is able to quantify the myocardial metabolic state post-MI. Clinically, glycolytic suppression is typically used to isolate inflammatory or ischemic activity. Additionally, glucose loading can provide further information by inducing metabolite uptake within the myocardium.4 Combining fasting and glucose loading protocols (dual condition) in one imaging session could have the advantages of reduced scan time and cost, while also providing better PET/MRI co-registration. The objective of this work was to develop a hybrid PET/MRI imaging protocol that will accurately and simultaneously reflect myocardial structure, function and metabolism using a novel dual-condition protocol, in an experimental model of MI.Methods
A whole-body clinical PET/MRI scanner (Siemens mMR) and a validated porcine model5 of MI (90 min LAD occlusion/reperfusion) was utilized. Fasting was induced by a 24 hour fast and injection of a heparin bolus (2000 IU). Glucose loading was induced by a 30-minute constant dextrose infusion (0.8 mL/min/kg). Physiological blood glucose measurements in fasted/glucose loaded states were studied in offline experiments (n=2). Imaging was performed at baseline, 10-, 31-, and 45-days post-MI (n=1). For MRI a CINE sequence was used to assess anatomy and function and 3D Late Gadolinium Enhancement (LGE) (1x1x2 mm res.) was used to delineate scar tissue. For PET, a 1-hour dynamic list-mode acquisition (2 mm iso. res.) was performed concurrently with MRI, immediately following 18FDG dosing (2.5 mCi) in the fasted state. Next, with a second FDG dose (7.5 mCi), a 1.5-hour acquisition was performed following glucose loading. 3D LGE was co-registered with 3D 18FDG-PET images for SUV comparison within infarct and healthy myocardial regions. Manual R.O.I.s were selected within these regions for PET standard uptake value (SUVs) calculations. SUVs were corrected for the second imaging session by appropriate activity subtraction. Cardiac gating was used to isolate diastolic phase, and respiratory gating was also used to minimize respiratory motion. 3D LGE was co-registered with 3D 18FDG-PET images for SUV comparison within infarct and healthy myocardial regionsResults
Offline physiological experiments showed changes in blood glucose post heparin (-0.25 ± 0.05 mmol/L) and post-dextrose infusion (+5.1 ± 0.3 mmol/L), and glucose loading induced almost 6-fold increase in tracer uptake immediately after dextrose infusion (Figure 1A). Co-registered 3D LGE and 18FDG-PET showed strong spatial correlations between infarct location and inflammatory cell activity (Figure 2C). Longitudinal tracking of metabolic activity following induced MI was measured over a period of 7 weeks and significantly decreased within infarct scar zone (p < 0.01), while remaining in surrounding infarct adjacent myocardium. (Figure 3)Discussion
A dual-condition 18FDG-PET protocol shows promise as an in vivo imaging method that accurately measures metabolic activity under different metabolic states, within the same imaging session. Combining this with structural information provided by 3D MRI provided high resolution contrast enhanced hybrid images. This framework has the potential to accurately characterize MI related therapies and the evolution of metabolic activity over a long period of time, while also reducing costs and scanning time significantly for large animal investigations. Developing the PET/MRI framework also opens the possibility of its widespread use as an in vivo non-invasive imaging modality for both pre-clinical efficacy testing and clinical implications for response monitoring in patients suffering from MI-related heart failure.Acknowledgements
We acknowledge the funding support from Ontario Research Fund, and the University of Toronto’s Medicine by Design initiative which receives funding from the Canada First Research Excellence Fund. We also acknowledge research support from Siemens Healthineers, Canadian Institute for Health Research, and the Heart and Stroke Foundation of Canada.References
- Taegtmeyer, H., Dilsizian, V. Imaging myocardial metabolism and ischemic memory. Nat. Rev. Cardiol. 5, S42–S48 (2008). https://doi.org/10.1038/ncpcardio1186
- Hastings, L. C. et al. Drug and cell delivery for cardiac regeneration. Adv. Drug Deliv. Rev. 84, 85-106 (2015). https://doi.org/10.1016/j.addr.2014.08.006
- Naumova, A. V., Modo, M., Moore, A., Murry, C. E., & Frank, J. A. Clinical imaging in regenerative medicine. Nat. Biotechnol. 32(8), 804–818 (2014). https://doi.org/10.1038/nbt.29937
- Kunze, K.P., et al. Quantitative cardiovascular magnetic resonance: extracellular volume, native T1 and 18F-FDG PET/CMR imaging in patients after revascularized myocardial infarction and association with markers of myocardial damage and systemic inflammation. J. Cardiovasc. Magn. Reson. 20, 33 (2018). https://doi.org/10.1186/s12968-018-0454-y
- Romagnuolo, R., et al. Human Embryonic Stem Cell-Derived Cardiomyocytes Regenerate the Infarcted Pig Heart but Induce Ventricular Tachyarrhythmias. Stem Cell Rep. 12(5), 967-981 (2019). https://doi.org/10.1016/j.stemcr.2019.04.005
Figures
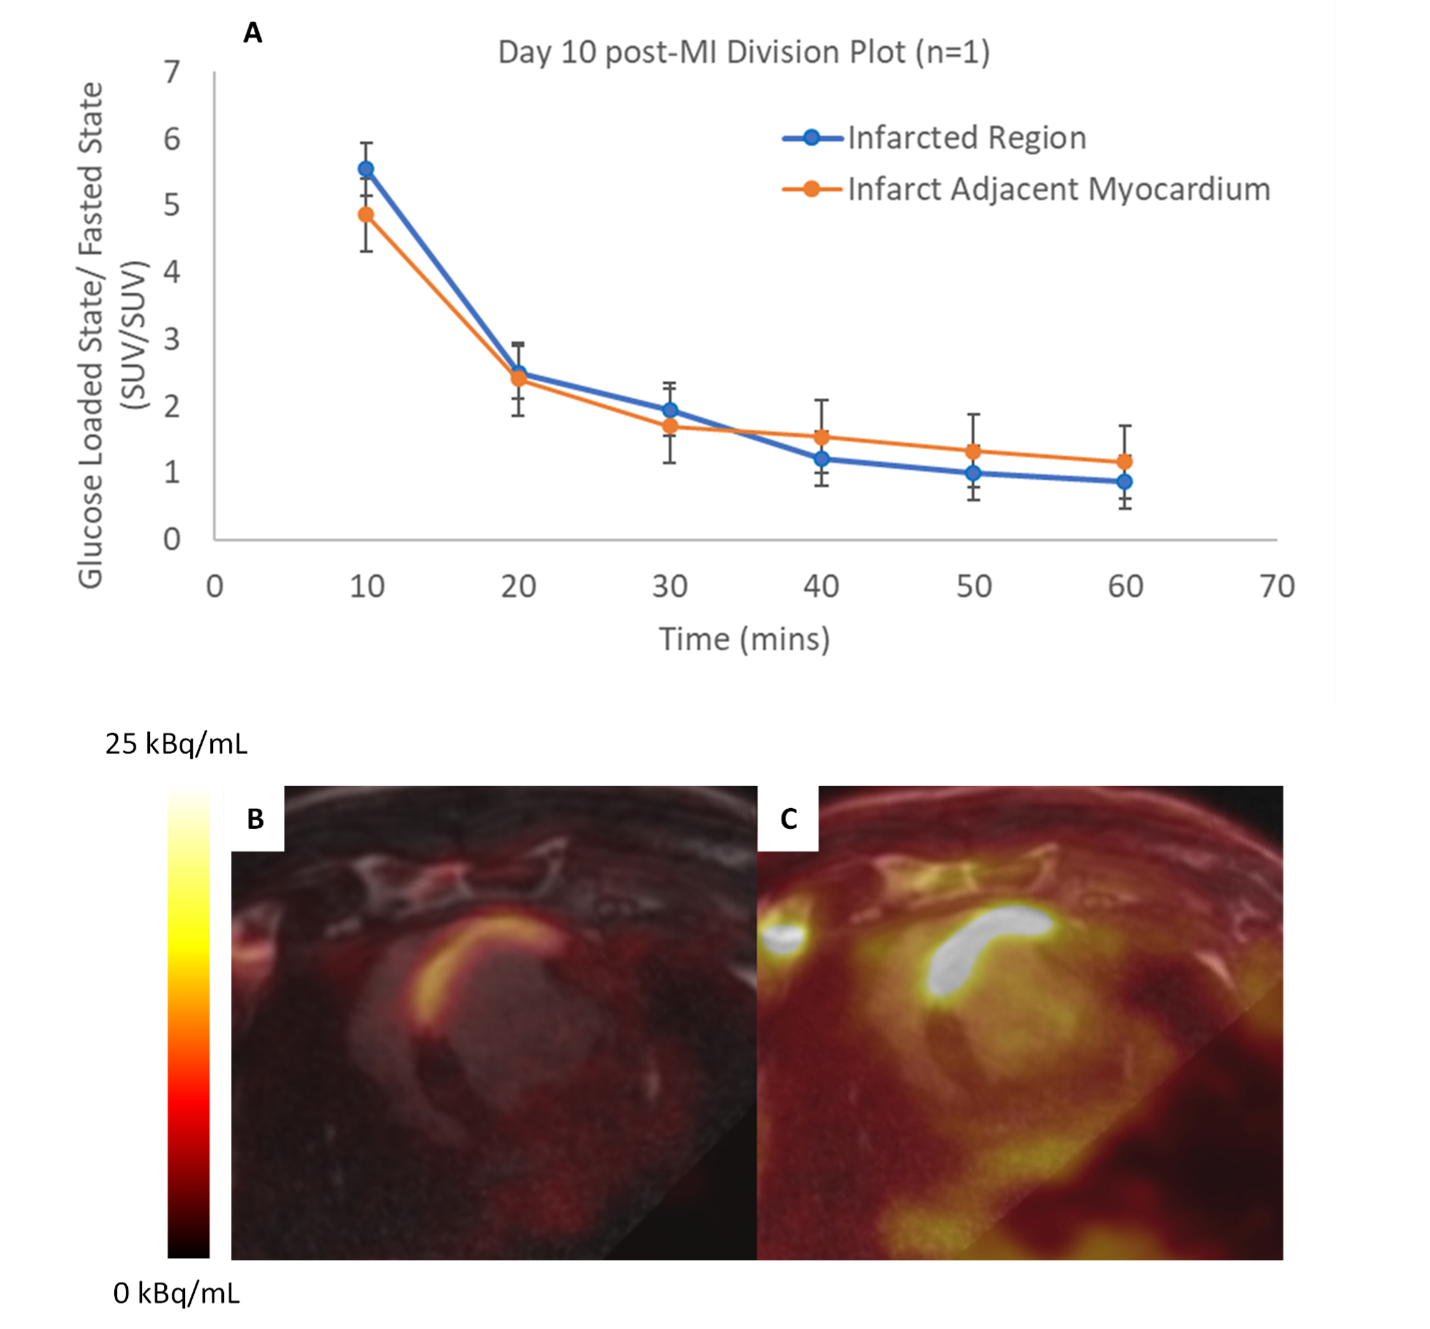
Figure 1: A) Division plot of 18FDG uptake
following fasting, divided by 18FDG uptake following glucose
loading, within infarcted region and infarct adjacent myocardium. Co-registered
3D LGE (FOV = 300 mm, TI = 200 ms) and 18FDG-PET images (Acq. Time =
10 mins, FOV = 258 mm) following B) 24 hour fast (2.5 mCi dose) and
C) 30 mins. dextrose infusion (7.5 mCi dose)
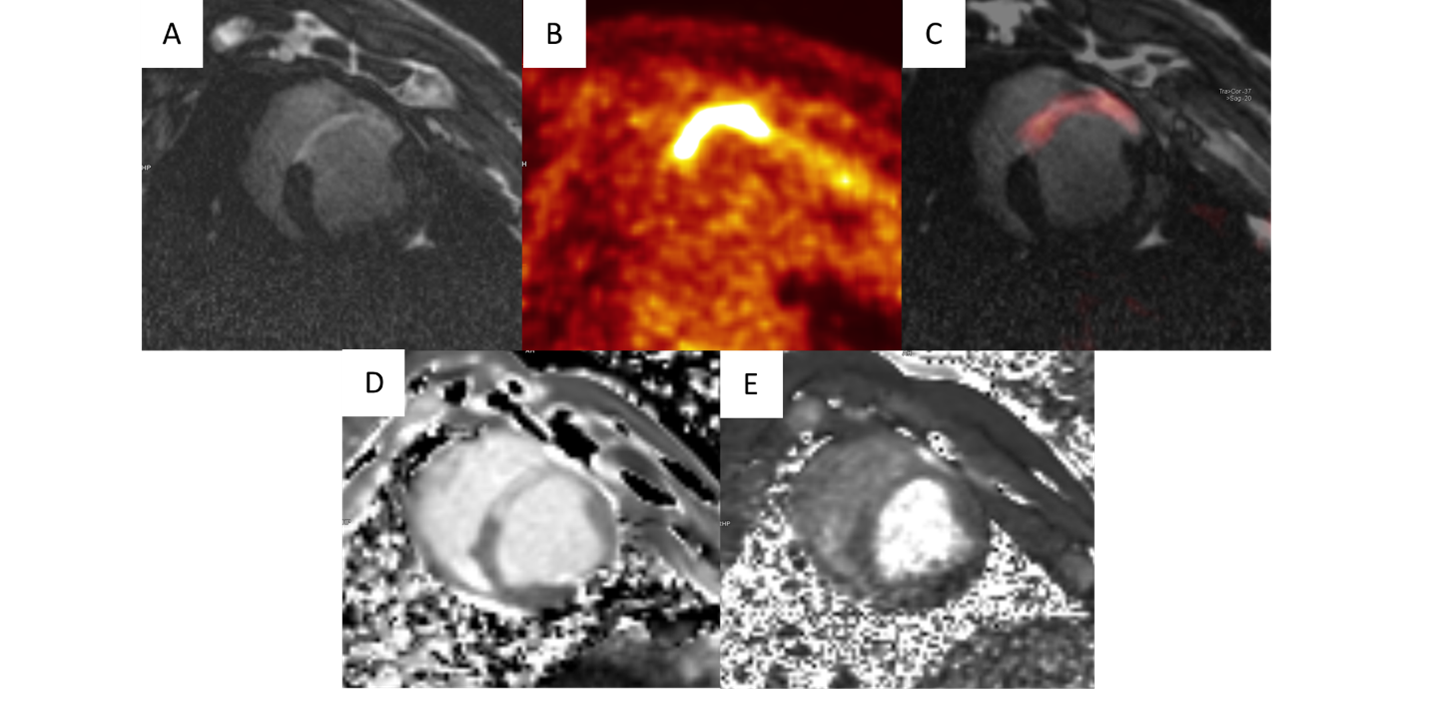
Figure 2: Left ventricular short axis view of
infarcted porcine heart (10 days post-MI). A) 3D Late Gadolinium
Enhancement (LGE) image of infarcted scar tissue (FOV = 300 mm, TI =
200 ms). B) 18FDG-PET image of inflammatory cell activity
within the infarct region, after 24 hour fast (Acq. Time = 10 mins, FOV
= 258 mm, FDG Dose = 2.5 mCi). C) Co-registered LGE and 18FDG-PET
images. D) Native T1 image and E) T2 image delineate areas of inflammation and edema
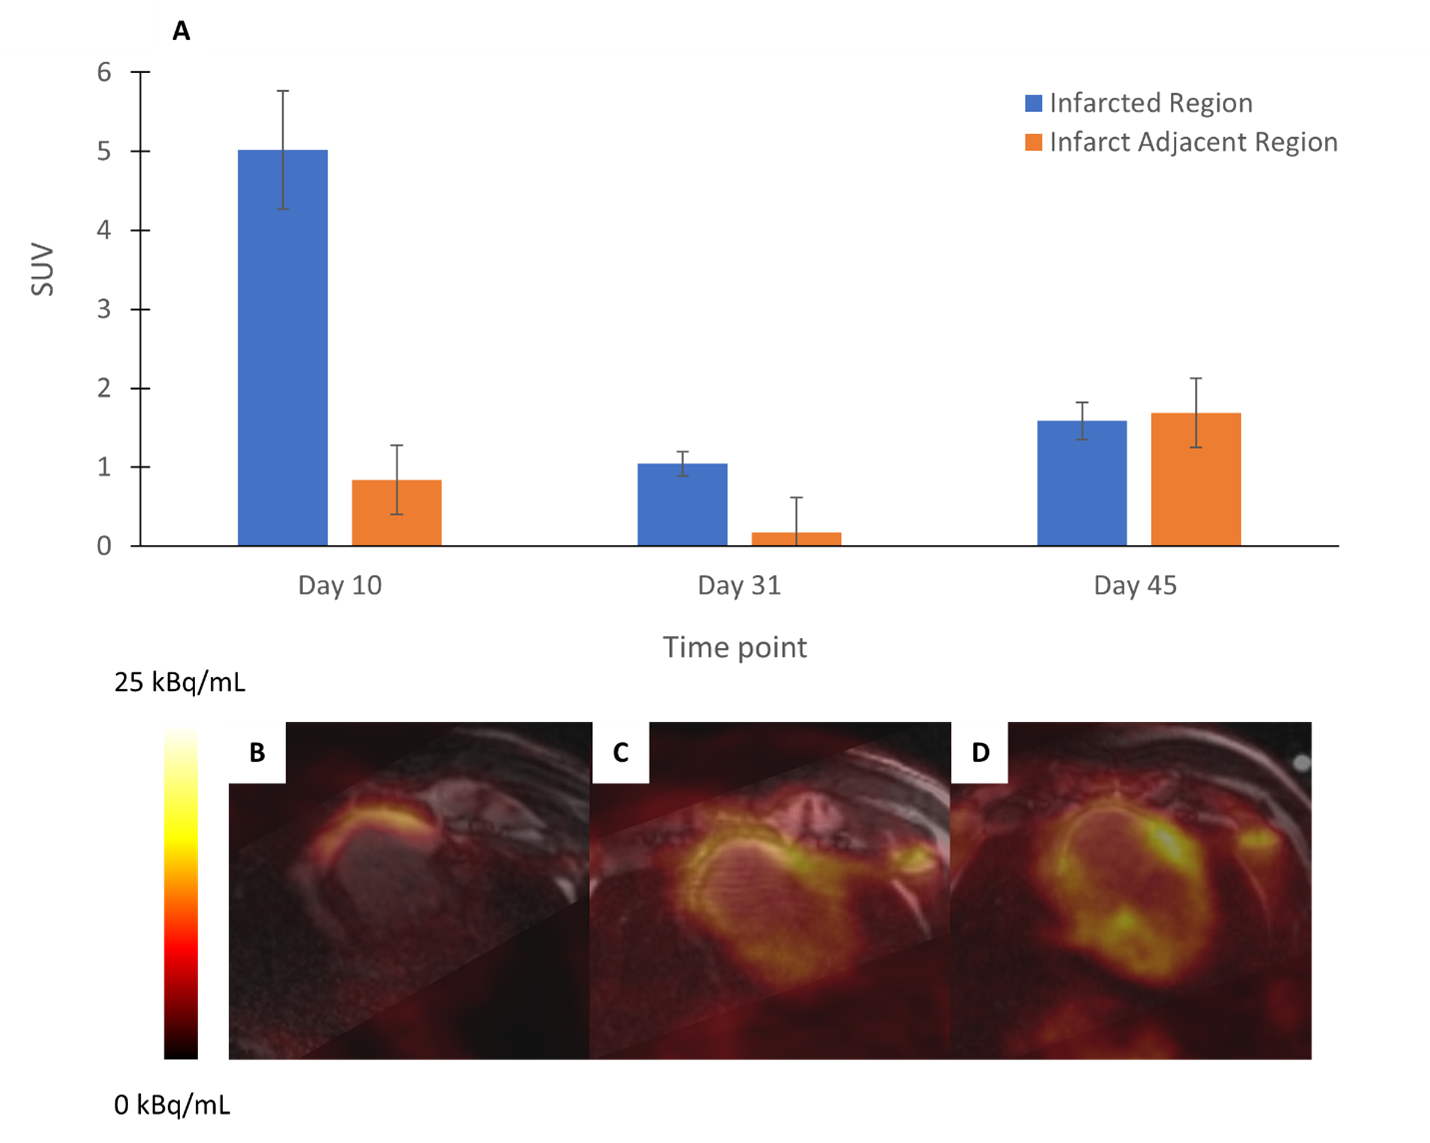
Figure 1: A) Longitudinal characterization of metabolic
activity within infarcted region and infarct adjacent myocardium, over a period
of 45 days. Co-registered 3D LGE (FOV = 300 mm, TI = 200 ms) and 18FDG-PET
images (Acq. Time = 10 mins, FOV = 258 mm, FDG Dose = 2.5 mCi) following 24
hour fast B) 10 days C) 31 days and D) 45 days post-MI
DOI: https://doi.org/10.58530/2022/1578