1573
Interventional continuous cardiac thermometry via simultaneous catheter tracking and undersampled radial golden angle acquisition1Electrophysiology and Heart Modeling Institute, Pessac, France, 2U1045, Centre de Recherche Cardio-Thoracique de Bordeaux Inserm, Bordeaux, France, 3Department of Biomedical Engineering, Vanderbilt University, Nashville, TN, United States
Synopsis
Interventional MR thermometry has the potential to increase the success rate of the radio-frequency cardiac ablative procedure by allowing real-time monitoring of the lesion growth. Available methods are dependent on ECG-gating, which is poorly reliable in arrhythmic conditions. We propose a new approach based on radial continuous gradient echo acquisition combined with concomitant 2D intra-scan motion correction and direct estimation of the temperature from k-space data which could be a robust alternative to the more classical but ECG-triggered and artifact-prone EPI methods.
Introduction
Real-time MRI guidance during cardiac electro-physiology procedures remains challenging with a number of obstacles such as the magnetic environment preventing its wide clinical adoption. In regards of the MR protocol, the adoption of MR thermometry for real-time monitoring of cardiac ablation procedures is hampered by the inherent complexity of performing highly T2* weighted imaging at high spatial and temporal resolutions on a moving organ. These constraints impose the use of ultrafast sequences such as EPI which are sensitive to magnetic field susceptibility artifacts, require important compromises between spatial resolution and echo time, and are dependent on ECG-gating which is poorly reliable in arrhythmic conditions. To get rid of these limitations, we decided to use a continuous radial golden angle (RGA) GRE acquisition which is well-known to be robust against motion artifacts, and to increase its robustness even more via intra-scan 2D rigid motion correction based on the catheter position determined concomitantly with the acquisition by the catheter micro-coil signal localization. The high temporal resolution (<1s) required in cardiac thermometry was then achieved by using direct estimation of the temperature from undersampled k-space data1 allowing to get temperature maps at acceleration factor up to 17. This method was tested both in a phantom and in vivo on sheep hearts and its uncertainty was evaluated for various spatial and temporal resolutions.Method
Acquisition: All acquisitions were performed on a 1.5T Aera MRI system (Siemens Healthcare, Erlangen, Germany) equipped with spine and body coils. The RGA GRE acquisitions were performed without respiratory or ECG gating. The acquisition parameters were: 220×220 mm² Field of View (FoV); 512 readout points including 2x oversampling; 3 mm-thick slice; 250 Hz/pixel readout bandwidth; 20 ms echo time (TE); 24.14 ms repetition time (TR); flip angle (FA) optimized at 15° for the 3%-agar gel and 10° for the in vivo experiment.Device: An MR compatible RFA catheter (Vision-MR Ablation Catheter, Imricor Medical Systems, Burnsville, MN, USA) with two embedded micro-coils (proximal and distal) was used to perform the ablation in two sheep hearts (approved by the ethics committee for animal studies) with different slice orientations. The RFA catheter was inserted in the femoral artery and navigated through the left ventricle under MRI guidance using active tracking via the prototype Monte Carlo platform (Siemens Healthcare, Erlangen, Germany).
Motion detection & correction: The catheter motion is quantitatively determined by tracking its micro-coils signal by a Radon transformation of two consecutive projections2. Following the high-intensity spot in the Radon transform allow retrieving the catheter position in the 2D acquisition plan and performing intra-scan 2D rigid motion correction and/or extracting the motions curves via filtering.
Temperature calculation: Direct estimation of the temperature from undersampled k-space data combined with a hybrid multi-baseline referenceless treatment3 was applied after 2D intra-scan rigid motion correction. The temperature uncertainty was determined for three spatial resolutions (1 × 1 × 3 mm3, 2 × 2 × 3mm3, and 3 × 3 × 3mm3) and three temporal resolutions (0.48, 0.72, and 0.97 seconds) with undersampling acceleration factors ranging from 2 to 17.
Result & Discussion
In Figure 1, the GRE image showed reduced magnetic field inhomogeneity distortions artifacts compared to its EPI counterpart especially in the vertical dimension due to the important difference in bandwidth: 10 Hz/pixel for the EPI phase dimension compared to 250 Hz/pixel for the GRE. However, the intra-voxel dephasing artifacts: the two black discs present at the tip and 20 mm above at the second micro-coil location in the catheter, are not reduced. These artifacts can only be reduced by decreasing the echo time (TE) as shown in Figure 2 which is possible only with the GRE: in EPI the value of 20 ms already corresponds to the minimum TE. Reducing TE increases the temperature uncertainty due to the decrease in temperature-induced phase shift4. Figure 2 also shows the good agreement between the temperature measured with EPI and with the GRE sequence. The use of high TE value increases the acquisition time and intra-scan motion correction became mandatory to image the heart without gating. The motion detection by radon transformation of the two projections is demonstrated on an agar phantom attached to a trolley switching between two positions in figure 3a and b. The panels c and d show the images reconstructed without and with motion correction. In vivo, the temporally filtered motion curve can be used to retrieve the cardiac or respiratory component of the motion as illustrated in figure 4.Finally, thermometry can be performed at different temporal resolutions by using various numbers of consecutive projections. The in vivo cardiac thermometry results are shown in figure 5 for three spatial and temporal resolutions. In each case, the RF-induced temperature elevation can be measured with an uncertainty ranging from 0.2 ± 0.1°C to 1.8 ± 0.2°C allowing preclinical monitoring of the RF ablation procedure.
Conclusion
The proposed method is a robust and promising alternative to EPI acquisition to monitor in vivo RF cardiac ablations at high spatial and temporal resolution. Further studies remain required to improve the temperature uncertainty and establish its clinical applicability.Acknowledgements
We thank Dr. Solenn Toupin (Siemens Healthcare) and Dr. Wadie Ben Hassen (Siemens Healthcare) for their help during the in vivo acquisitions. We thank Tom Lloyd (Imricor Medical Systems) and Jason Stroup (Imricor Medical Systems) for help and guidance using the Advantage MR system. Funding This work was supported by the “Agence Nationale de la recherche” under the program ‘‘Future Investments’’ with the reference ANR-17-CE19-0007 (CARTLOVE)References
1. Gaur, P. & Grissom, W. A. Accelerated MRI thermometry by direct estimation of temperature from undersampled k-space data. Magn. Reson. Med. 73, 1914–1925 (2015).
2. Rasche, V., Holz, D., Köhler, J., Proksa, R. & Röschmann, P. Catheter tracking using continuous radial MRI. Magn. Reson. Med. 37, 963–968 (1997).
3. Grissom, W. A. et al. Hybrid referenceless and multibaseline subtraction MR thermometry for monitoring thermal therapies in moving organs. Med. Phys. 37, 5014–5026 (2010).
4. Rieke, V. & Pauly, K. B. MR thermometry. J. Magn. Reson. Imaging 27, 376–390 (2008).
Figures
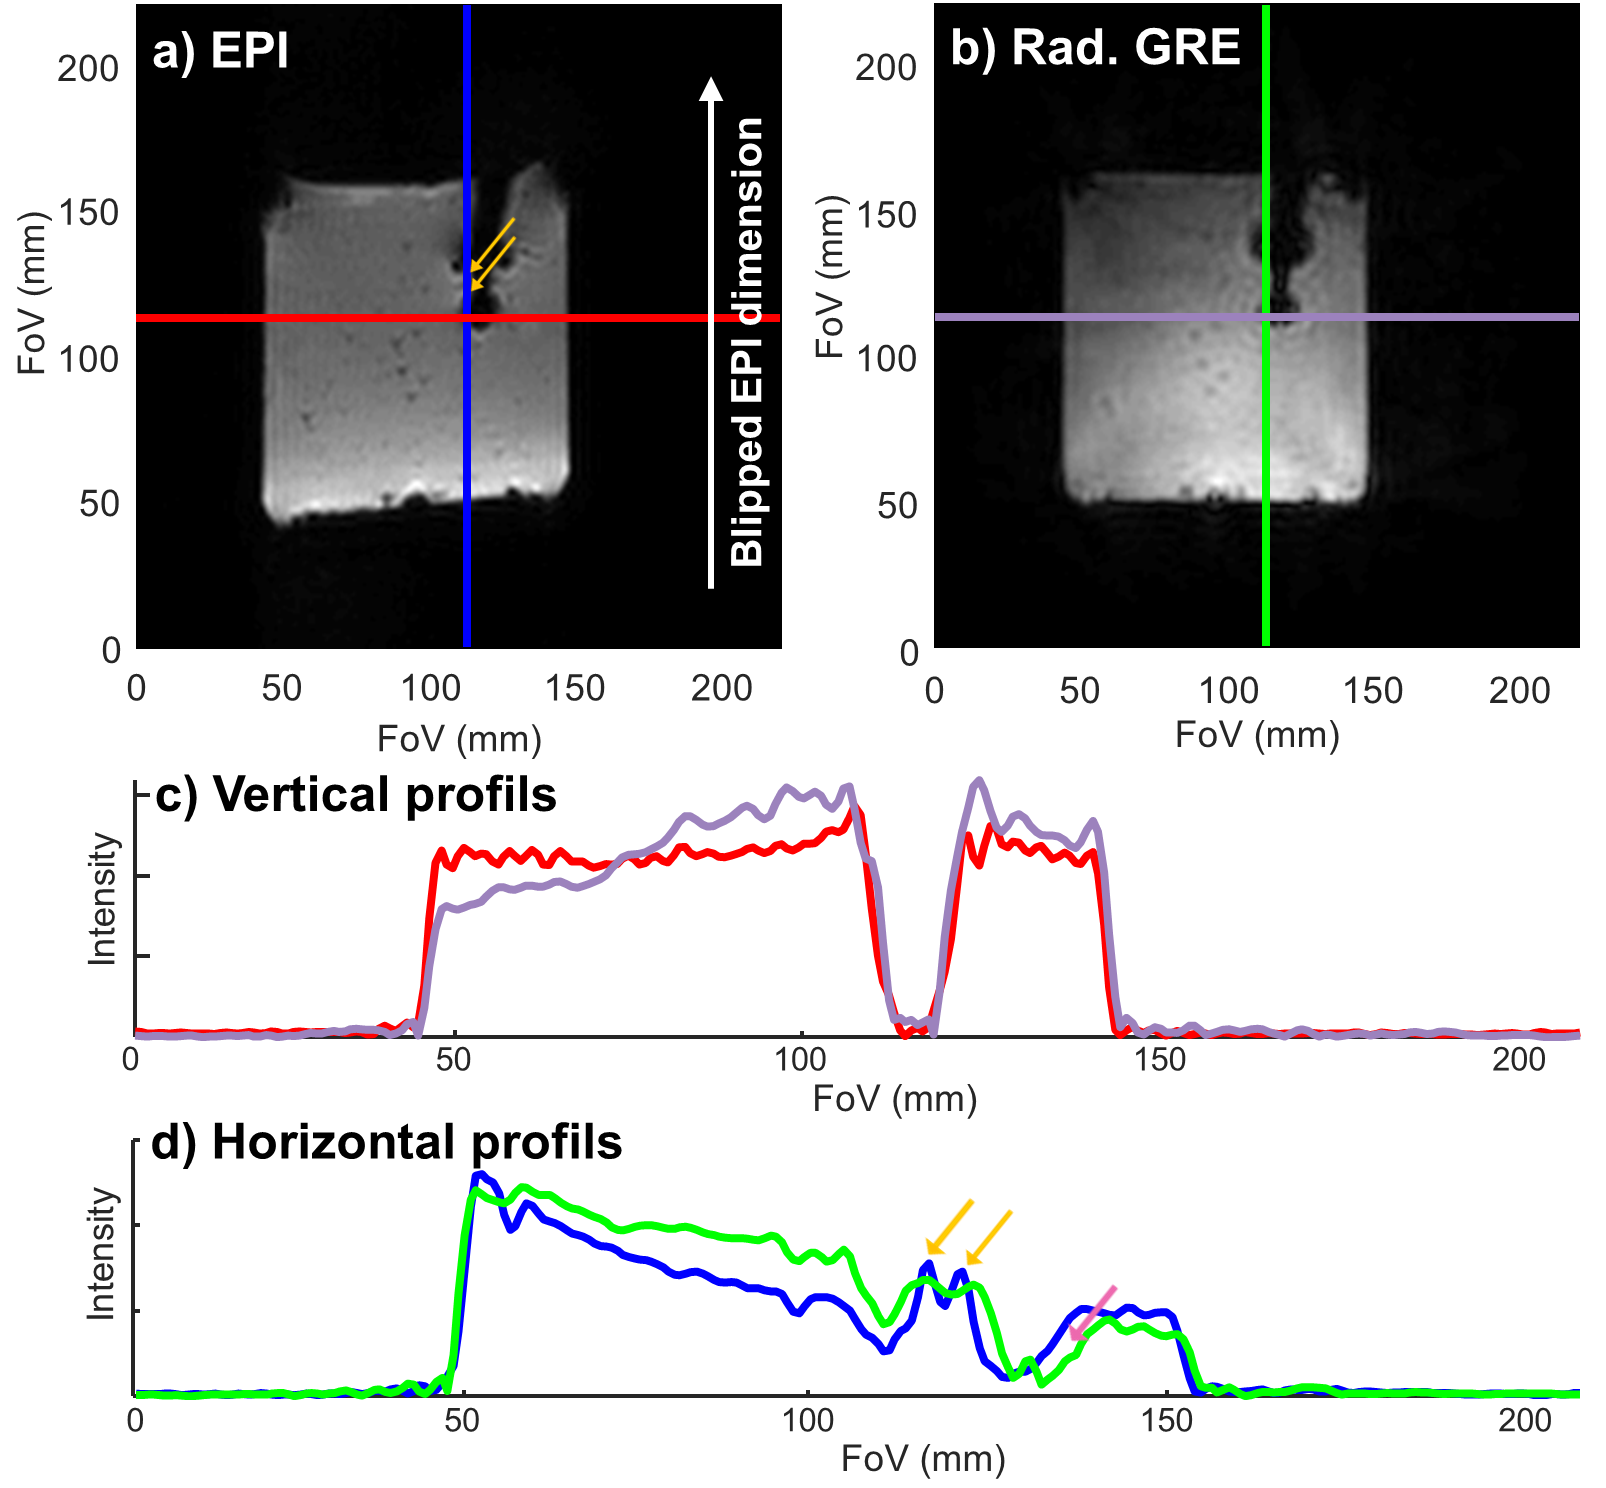
Figure 1: Comparison of the magnitude images and profiles obtained with EPI and GRE sequences on an MR compatible catheter inserted in an agar gel phantom. a) GE-EPI image. b) GRE image. c) Horizontal profiles corresponding to the locations of the red and purple lines in the EPI and GRE images respectively. d) Vertical profiles corresponding to the locations of the blue and green lines in the EPI and GRE images respectively. The orange arrows exhibit the B0 inhomogeneity artifacts and the pink arrow exhibits the B0 inhomogeneity induced shift between the EPI and GRE image.
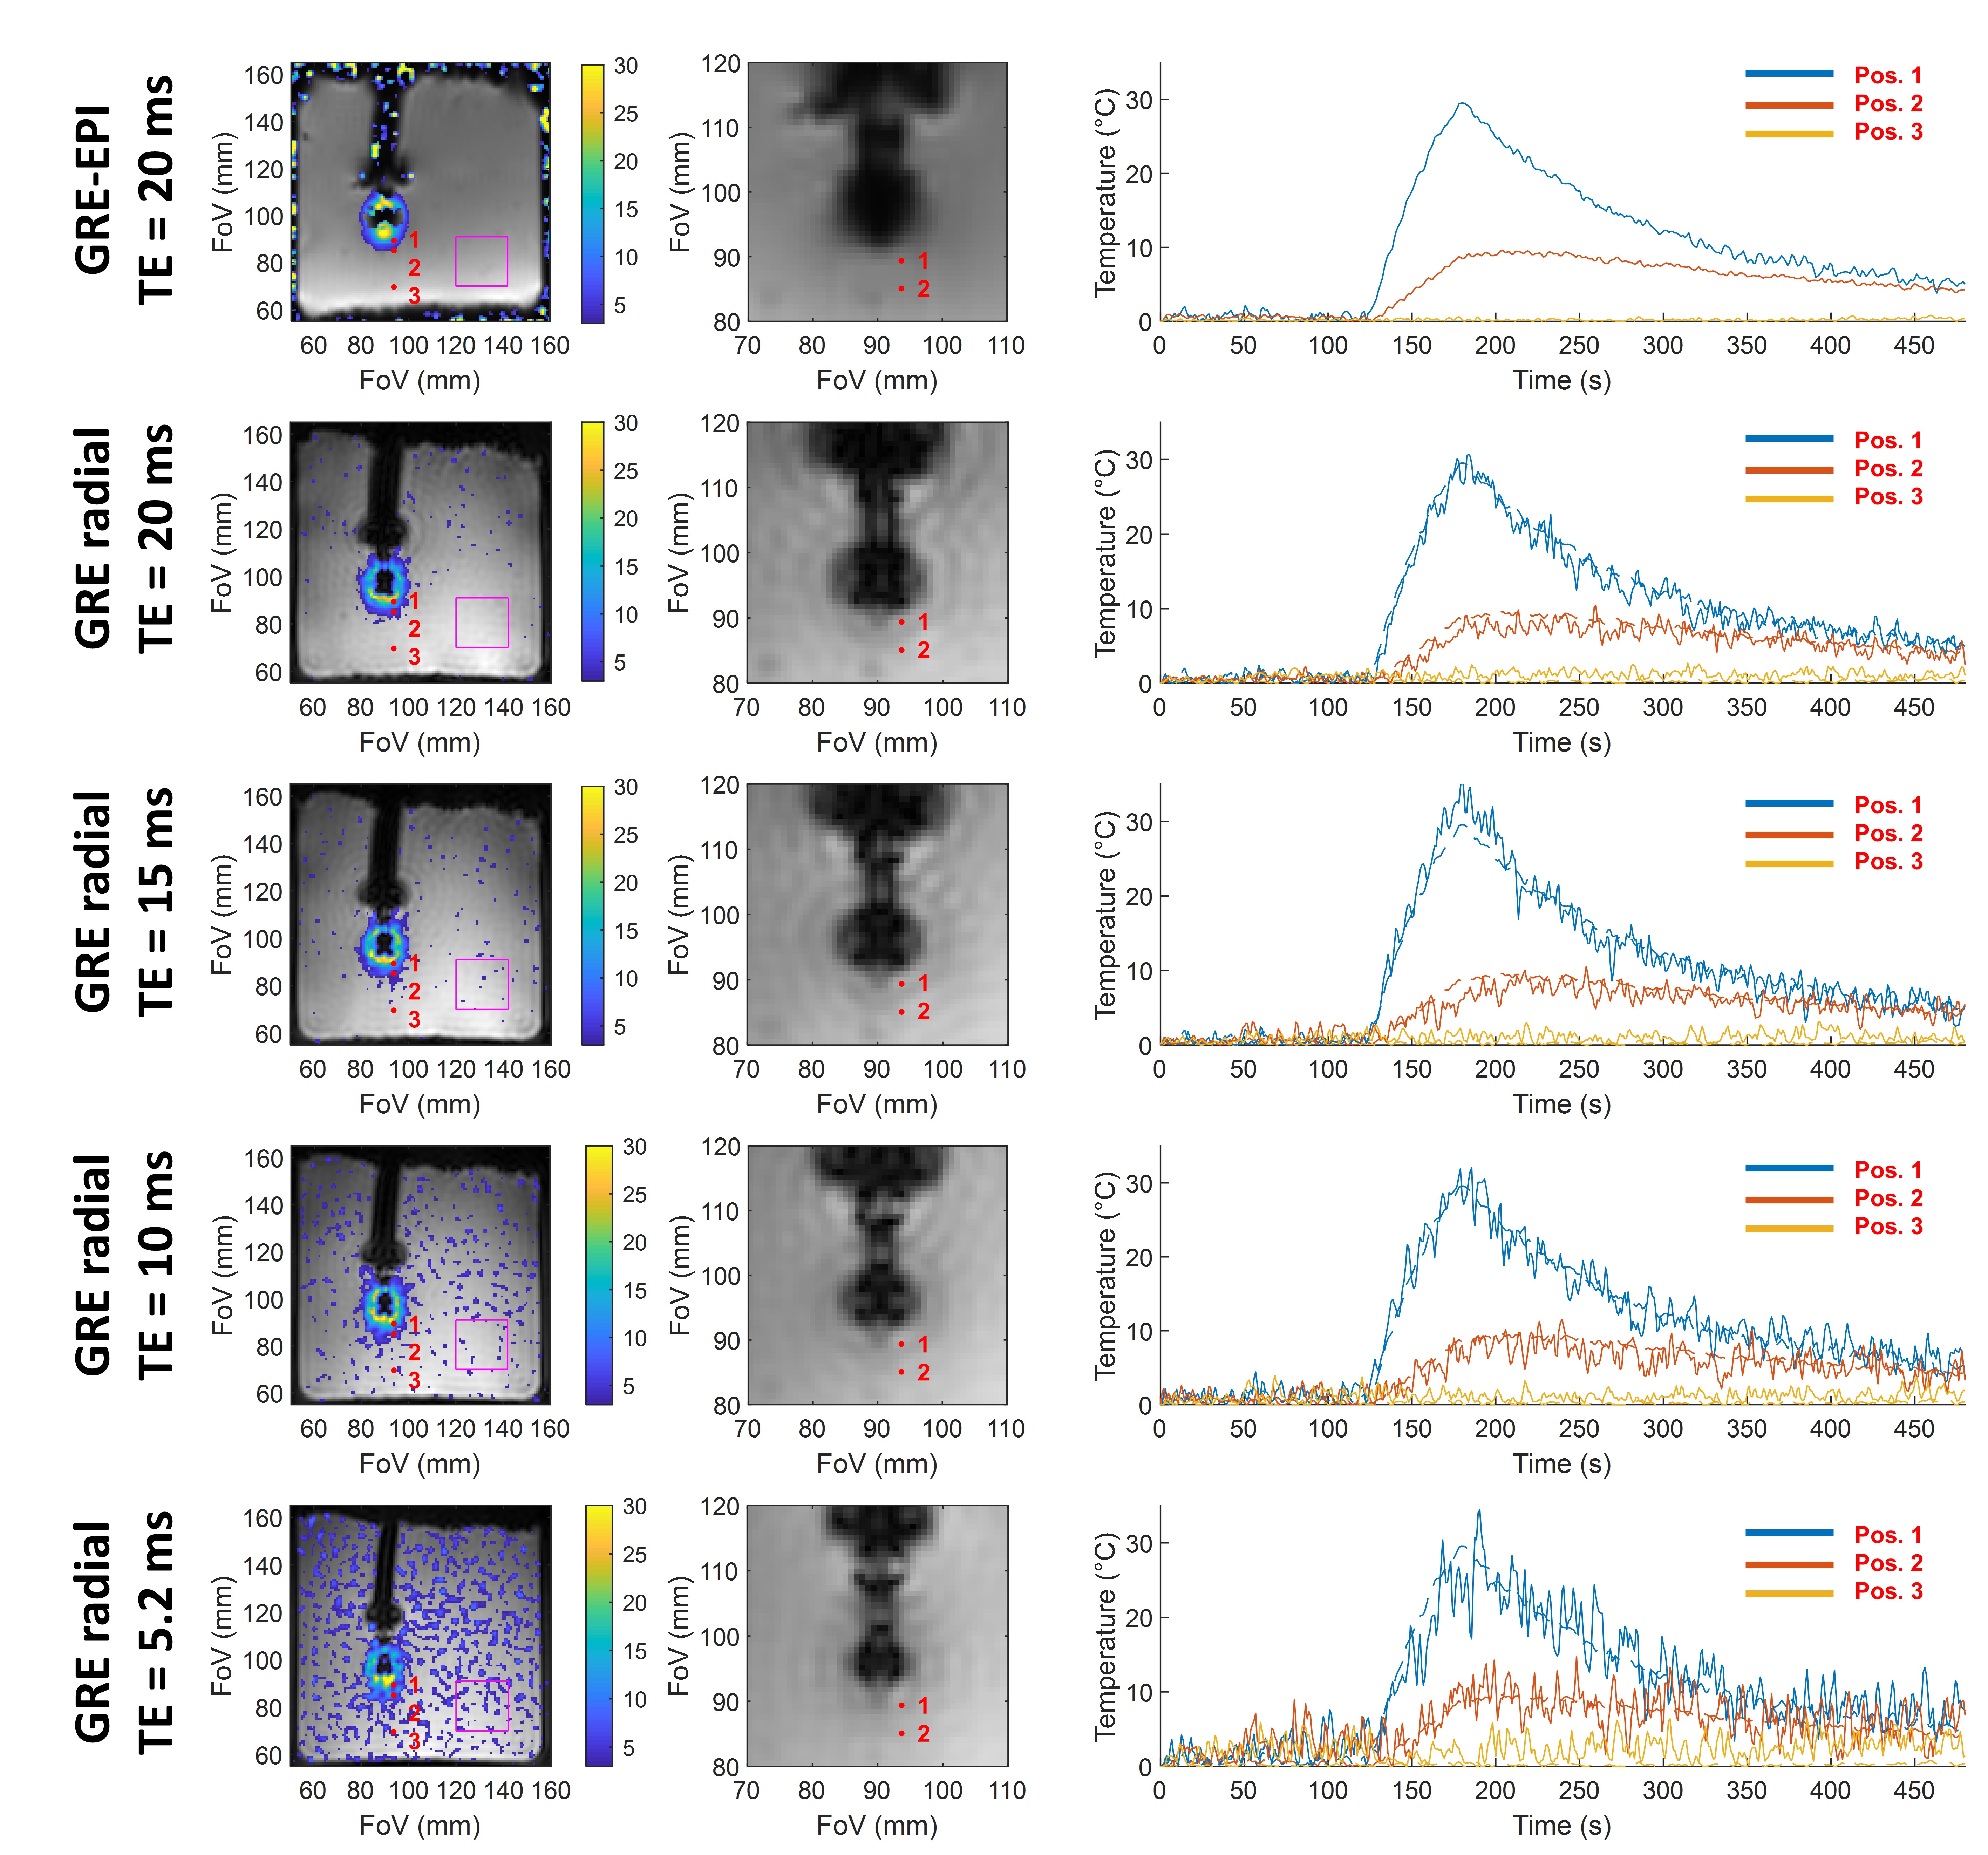
Figure 2: Comparison of magnitude images and thermometry uncertainty for GRE and EPI acquisition with four different echo times: 20, 15, 10, and 5.2 ms. The temporal resolution is 1.2 second in EPI and 0.97 s for the four GRE radial acquisitions corresponding to 40, 50, 68, and 104 projections for TEs of 20, 15, 10, and 5 ms respectively. The standard deviations of the temperature in the purple ROI are 0.19 ± 0.03 °C for the EPI acquisition and 0.53 ± 0.06 °C, 0.63 ± 0.08 °C, 0.9 ± 0.1 °C and 1.5 ± 0.2 °C for the GRE acquisition with TE of 20, 15, 10 and 5.2 ms respectively.
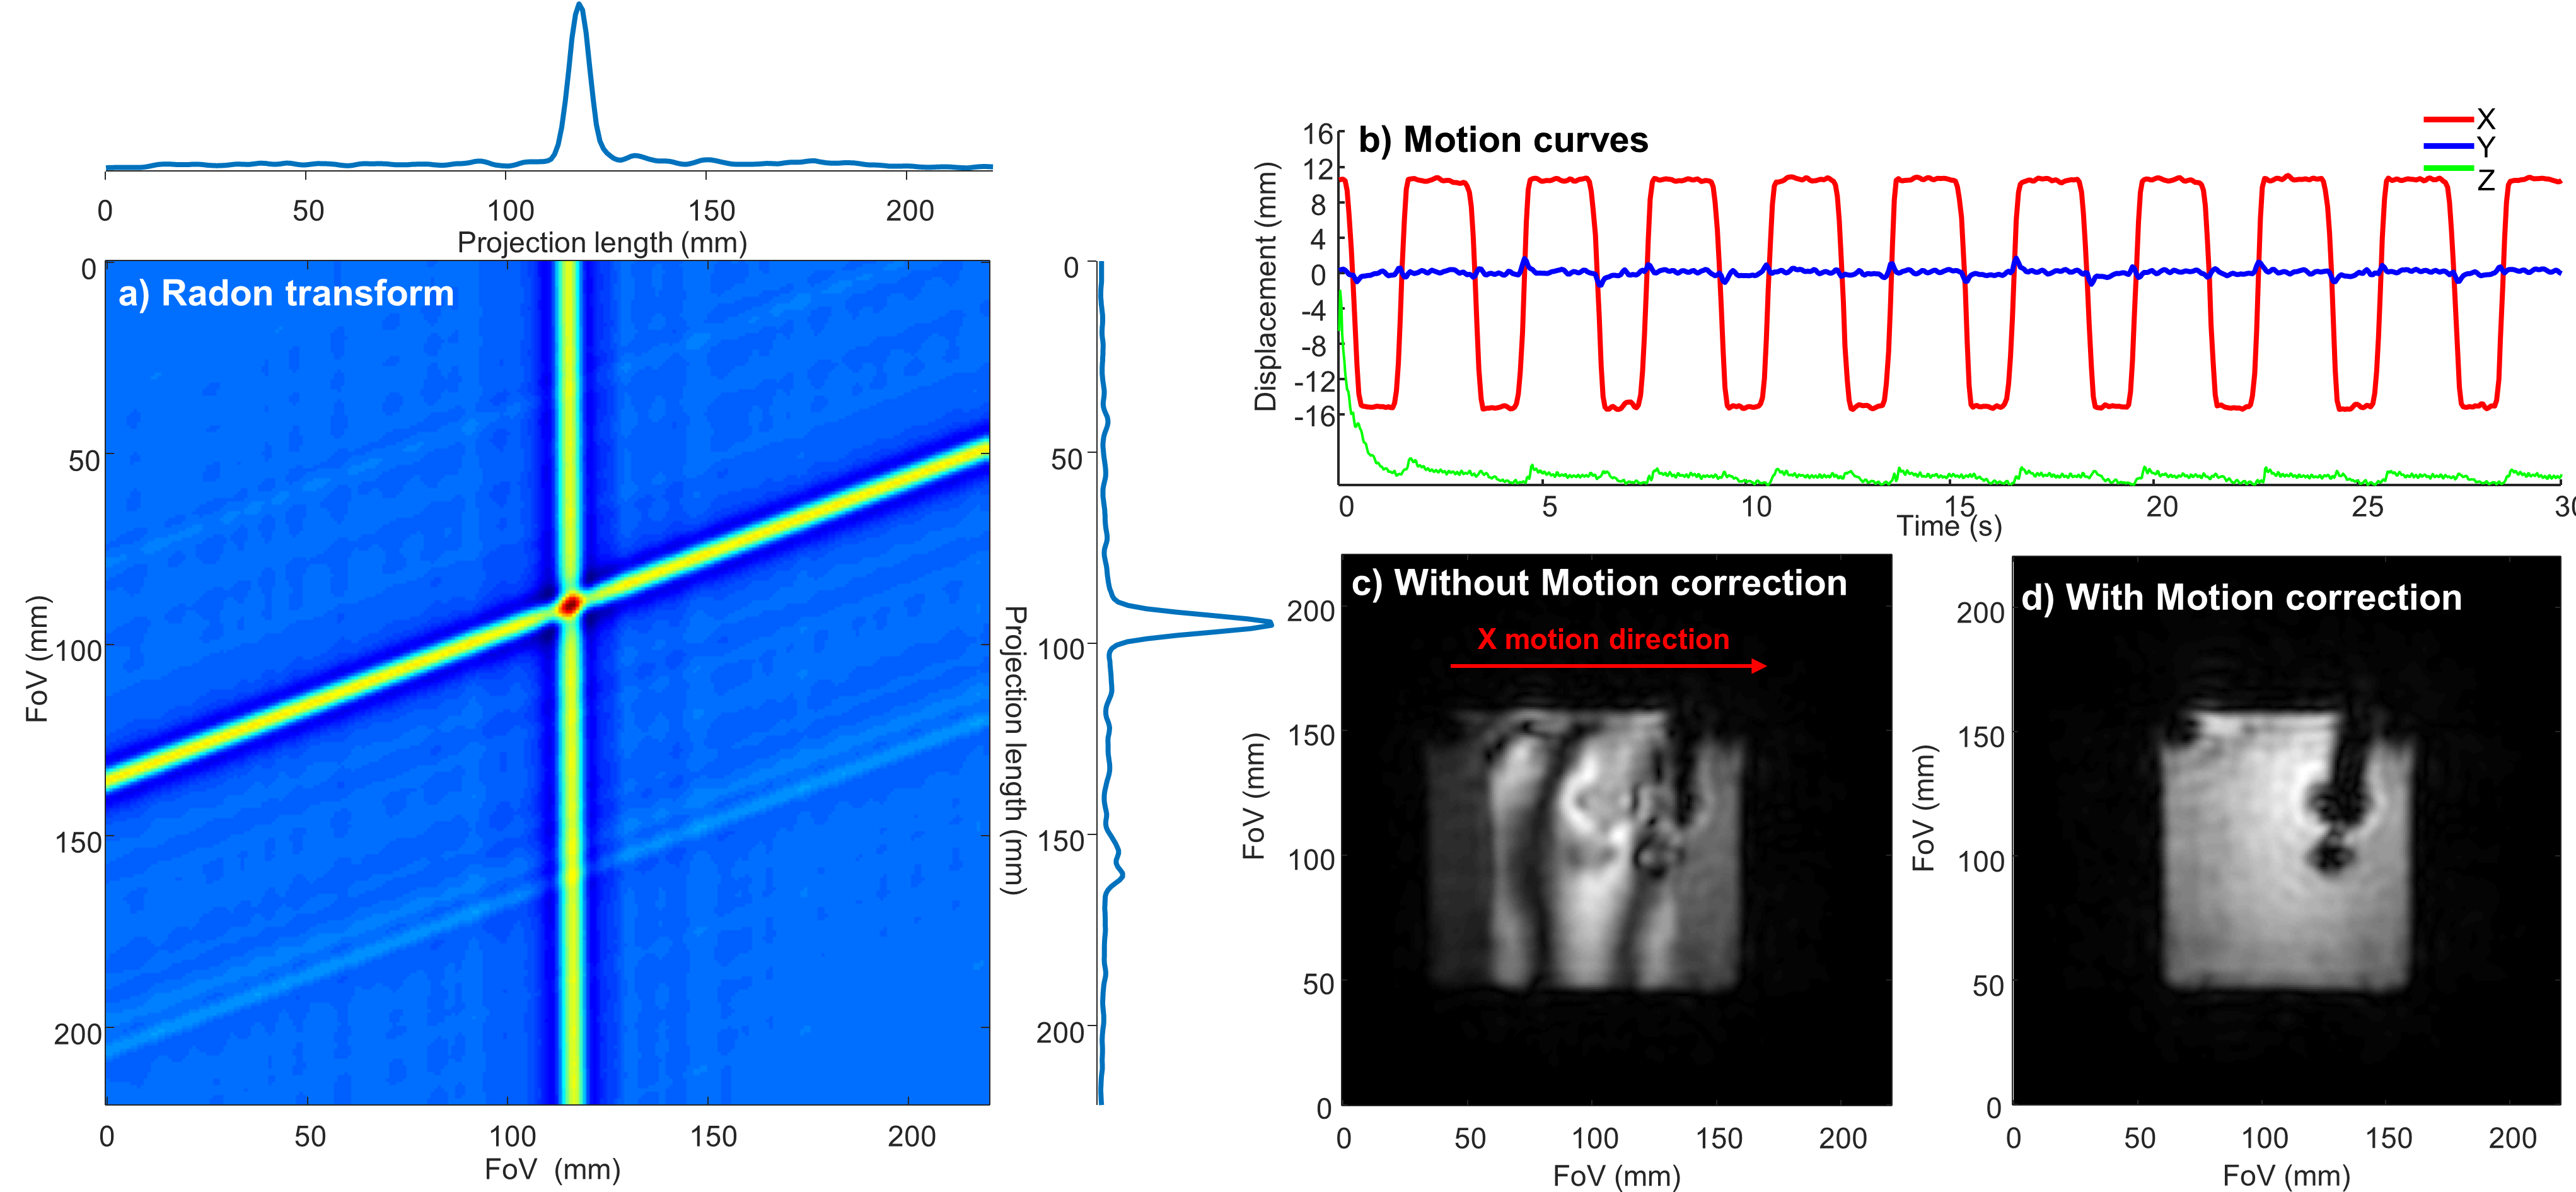
Figure 3: Motion detection and effect of its correction on magnitude images of a moving agar gel phantom. a) intensity map obtained by 2D radon transform of the two projections. b) Motion curves of the micro-coil of the RFA catheter inserted in the moving phantom. The X (red) and Y (blue) curves describe the in-plane motion quantitatively while the Z (green) curve shows qualitatively the variation of the micro-coil signal intensity. Panels c) and d) show the magnitude images reconstructed by NUFFT without and with rigid 2D in-plane motion correction respectively.
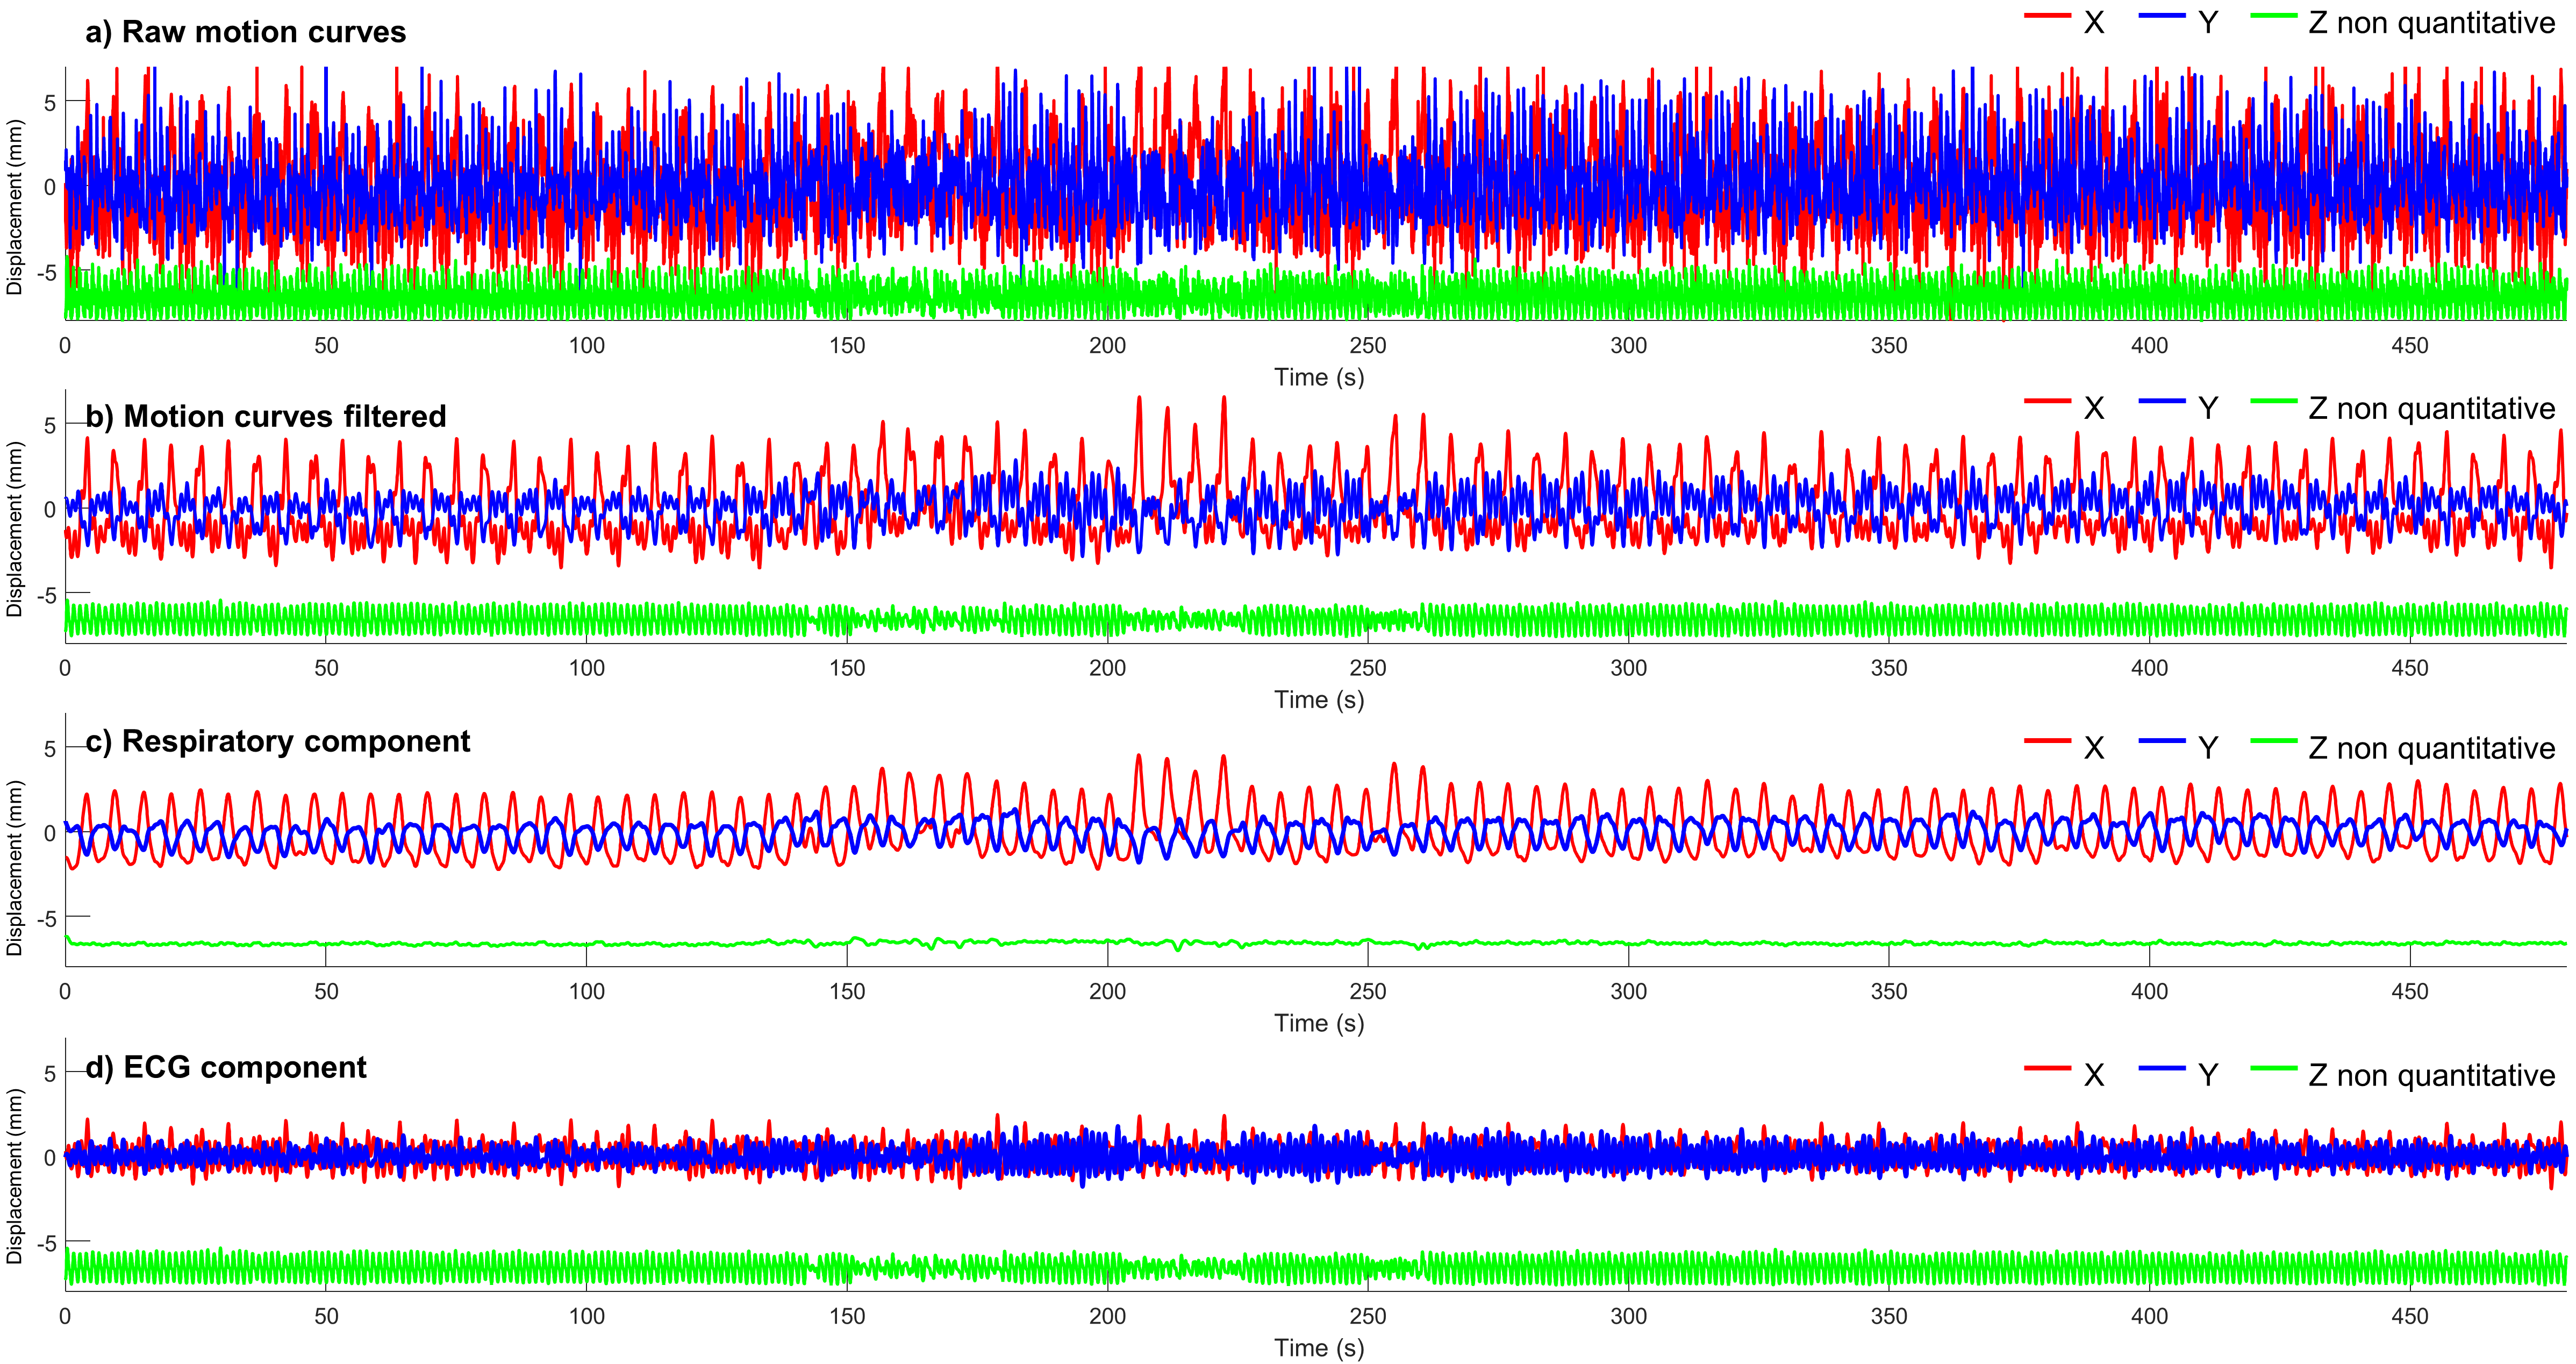
Figure 4: Motion curves obtained by following the catheter micro coils with the catheter in contact with the myocardium of the left ventricle. The signals have a temporal resolution of two TR (≈50 ms). a) Motion curves without any temporal filtering. b) Motion curves filtered by a Gaussian filter with a cut of frequency at 0.883 Hz. c) Respiratory component of the motion curves obtained by Gaussian low-pass temporal filtering. d) ECG component of the motion curve obtained by subtracting the respiratory component from the filtered signal.
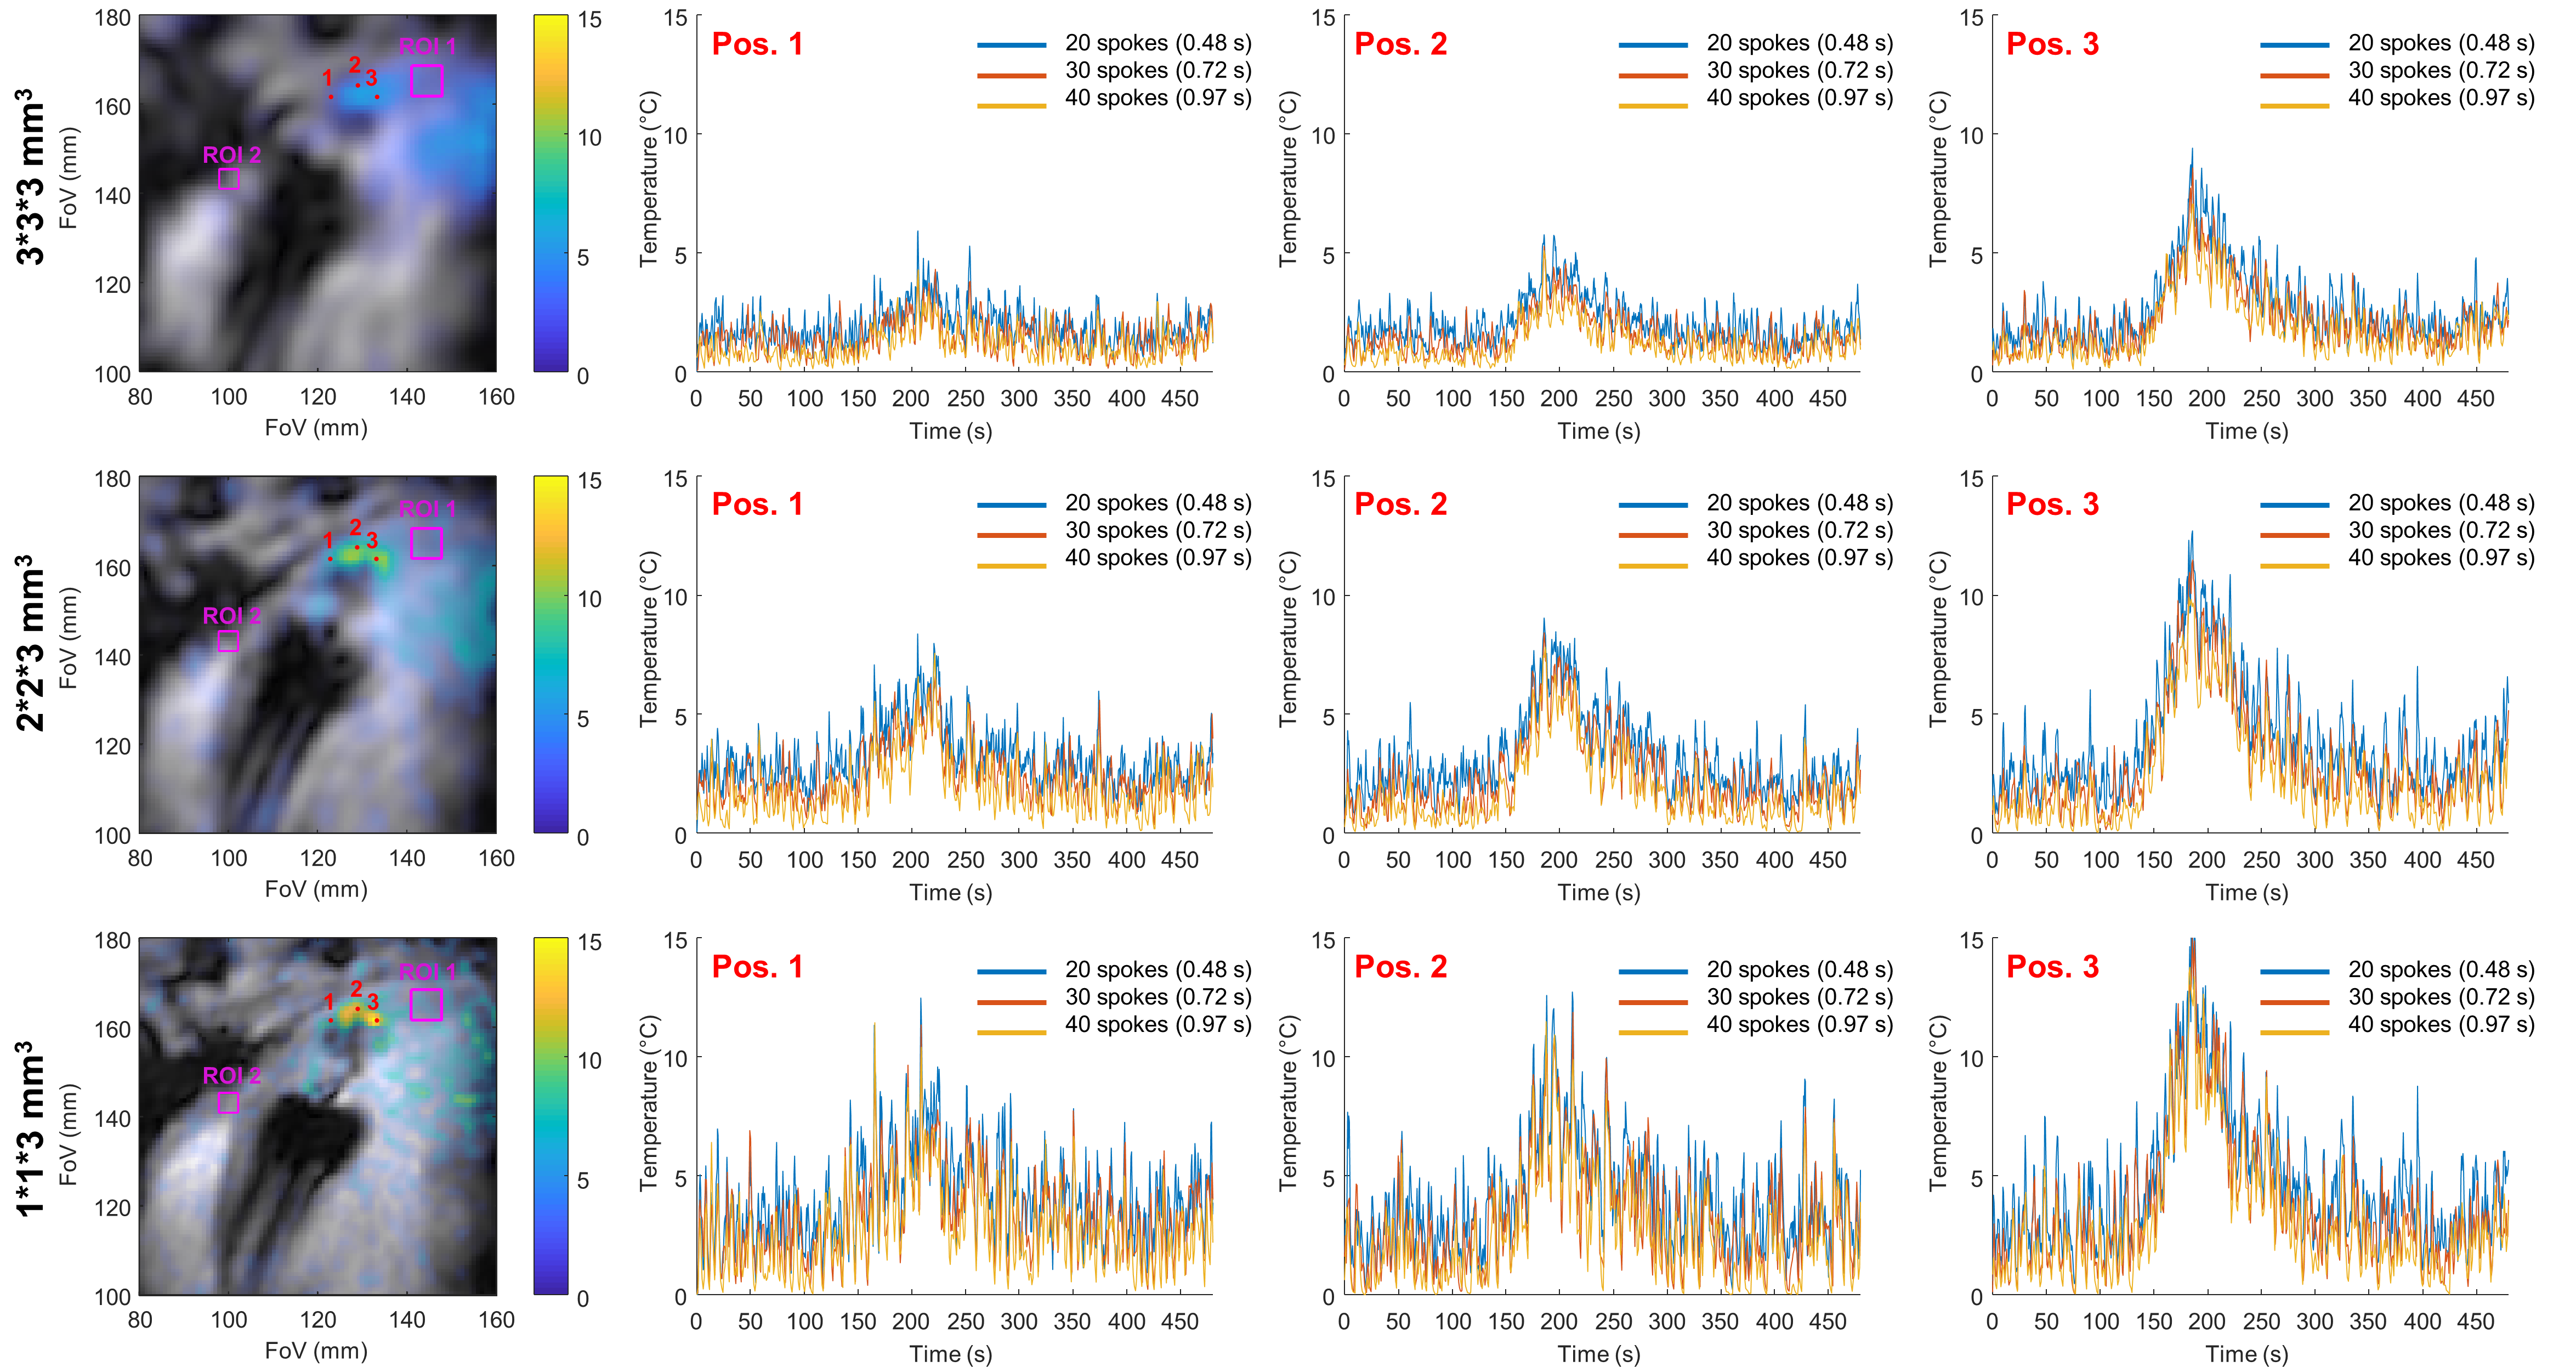
Figure 5: Influence of temporal and spatial resolutions on temperature maps in vivo. left column: temperature maps obtained with 40 projections a time = 188s with in-plane resolutions of 1 × 1 mm², 2 × 2 mm², and 3 × 3mm² from top to bottom and a 3 mm slice thickness. The temperature curves are presented at three spatial locations identified by the red points 1, 2, 3. The three curves: blue, red, and yellow show the results at three temporal resolutions: 0.48, 0.72, and 0.97 s corresponding respectively to the acquisition of 20, 30, and 40 consecutive projections.