1572
Preliminary Clinical Validation of Non-rigid Motion-compensated 3D Whole-heart T2 mapping in a hybrid PET-MR system1School of Biomedical Engineering and Imaging Sciences, King's College London, London, United Kingdom, 2MR Research Collaborations, Siemens Healthcare Limited, Frimley, United Kingdom
Synopsis
Simultaneous 18F-FDG PET-MRI has shown promise for improved diagnostic accuracy of inflammatory cardiac diseases. However, respiratory motion and mis-registration between free-breathing 3D PET and 2D breath-held MR images remain challenges that have hindered its clinical adoption. We have recently proposed a free-breathing non-rigid motion-compensated 3D whole-heart T2-mapping that enables detection of myocardial inflammation and provides non-rigid respiratory motion fields to correct simultaneously acquired PET data in a 3T PET-MR system. Here, we perform a preliminary clinical validation of this approach in 8 patients with suspected cardiovascular disease. Good image quality with T2 values comparable to clinical 2D T2-mapping was achieved.
Introduction
Simultaneous 18F-FDG PET-MR imaging and quantitative T2-mapping have the potential to improve the diagnosis of inflammatory cardiac diseases, such as cardiac sarcoidosis[1,2]. PET-MR imaging of cardiac sarcoidosis can provide information about myocardial function, the pattern of injury and disease activity in a single scan. However, respiratory motion related mis-registration between conventional cardiac MR data, usually acquired in 2D under multiple breath holds, and simultaneously acquired 3D free-breathing PET data remains a challenge when interpreting imaging findings, thus hindering clinical adoption. Moreover, respiratory motion degrades both image quality and quantification of PET and MR images.Here we perform a preliminary clinical validation of an efficient (no resting periods) accelerated non-rigid motion compensated free-breathing 3D whole-heart T2-mapping sequence, which enables detection of myocardial inflammation and provides non-rigid respiratory motion fields to correct simultaneously acquired PET data[3] in a 3T hybrid PET-MR system. This was achieved by extending a previously introduced approach for 3D translational motion-corrected T2-mapping at 1.5T.[4] A repeatability study was performed in phantoms. Validation was also performed in 8 patients with suspected cardiovascular disease for 3D T2 mapping only at 3T scanner in comparison with conventional 2D T2-mapping.
Methods
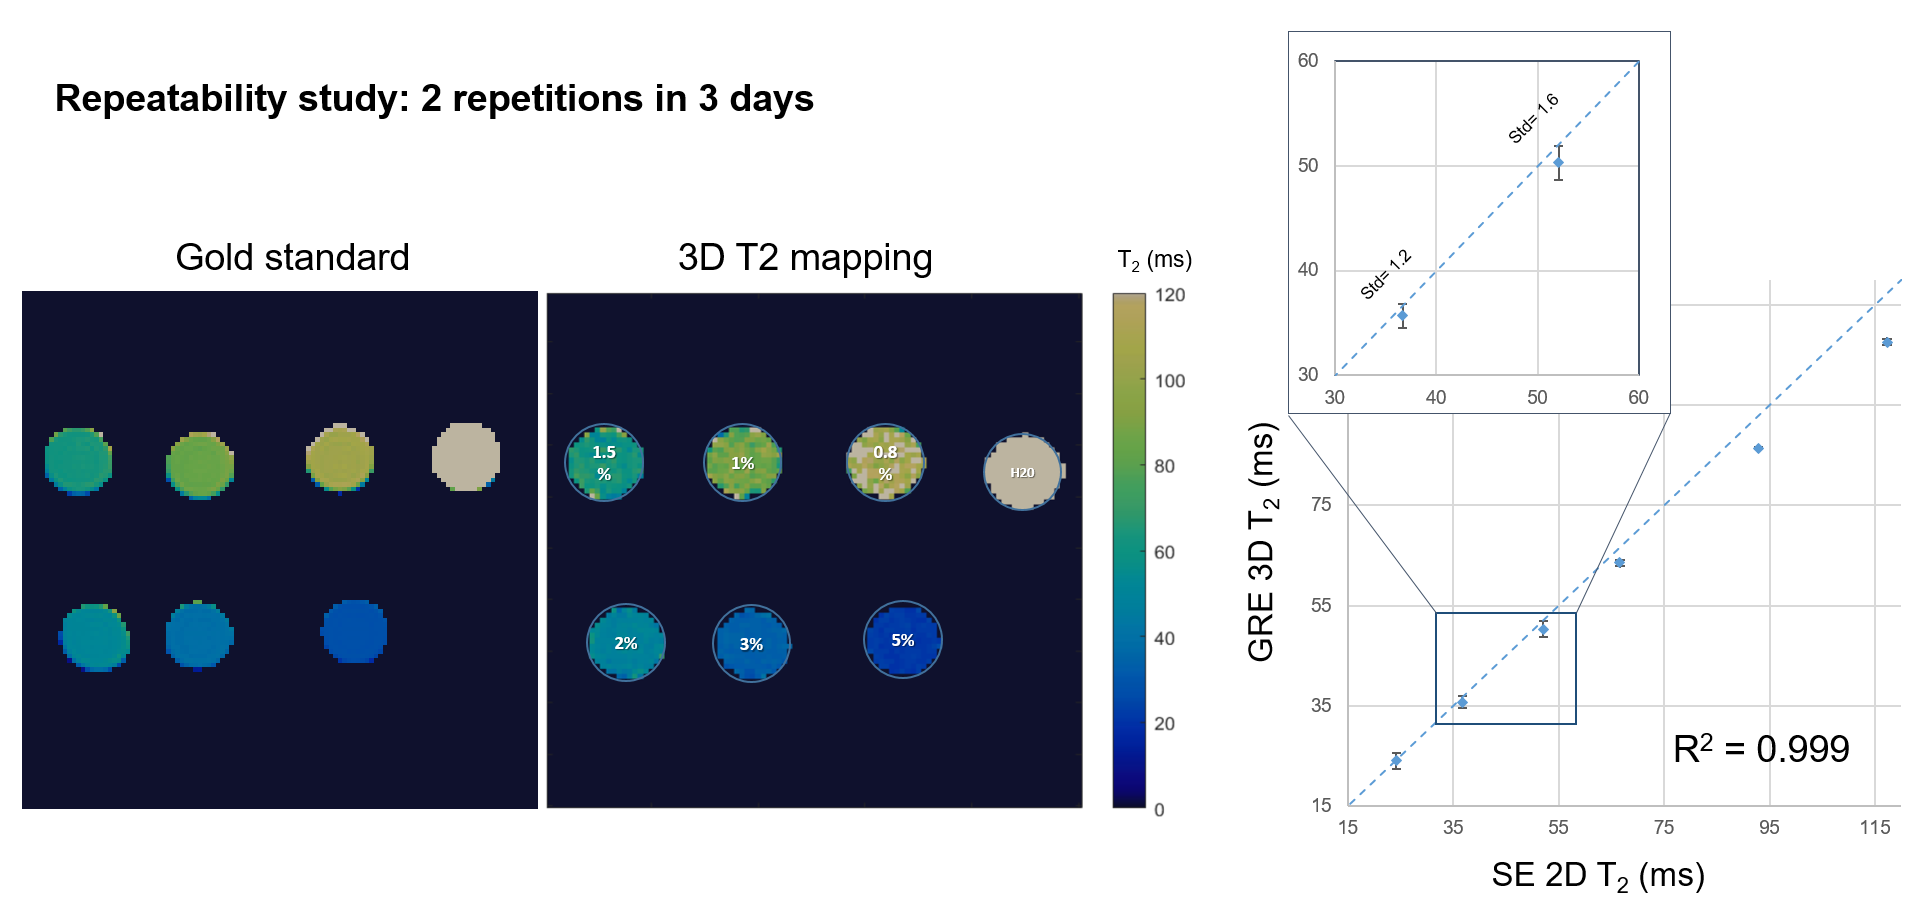
Acquisition & Reconstruction: A free-breathing 3D whole-heart T2-mapping prototype sequence (Figure 1) was implemented on a 3T PET-MR system (Biograph mMR, Siemens Healthcare, Erlangen, Germany). Three T2-prepared gradient echo datasets were acquired using a 3-fold undersampled variable-density Cartesian trajectory[5]. The sequence included a saturation pulse performed immediately after each R-wave to render the sequence heart-rate insensitive, followed by a T2-preparation pulses of different durations (0, 28 and 55ms) and fat saturation pulse immediately prior to the imaging sequence. Image navigators (iNAVs)[6] are integrated in the sequence to enable 100% respiratory scan efficiency and predictable scan time. Beat-to-beat translational motion is estimated from 2D iNAVs (foot-head and right-left directions) and virtual 3D iNAVs based on autofocus[7,8] (right-left and anterior-posterior direction), and used to motion-correct and bin the MR data and produce respiratory-resolved 3D images. 3D non-rigid motion is then estimated and incorporated into a motion-compensated reconstruction[9] with patch-based low-rank regularization (HD-PROST[4]) to produce motion-free datasets. Final T2-maps are computed using dictionary-matching[10].Imaging & Analysis: Phantom studies were performed using an in-house built phantom with different agarose concentrations (0.8, 1, 1.5, 2, 3 and 5%) with the same parameters as used for the in-vivo scans (acquisition time=3min43s), and compared to a gold-standard 2D multi-echo spin-echo sequence (TR=10s, TE=12, 28 and 55ms, matrix size=128x128, resolution 2x2x8mm3, acquisition time = 21min10s for each TE). Repeatability studies were performed acquiring 2 datasets on 3 consecutive days with the proposed 3D T2-mapping approach and compared to the gold standard to test for robustness and repeatability.
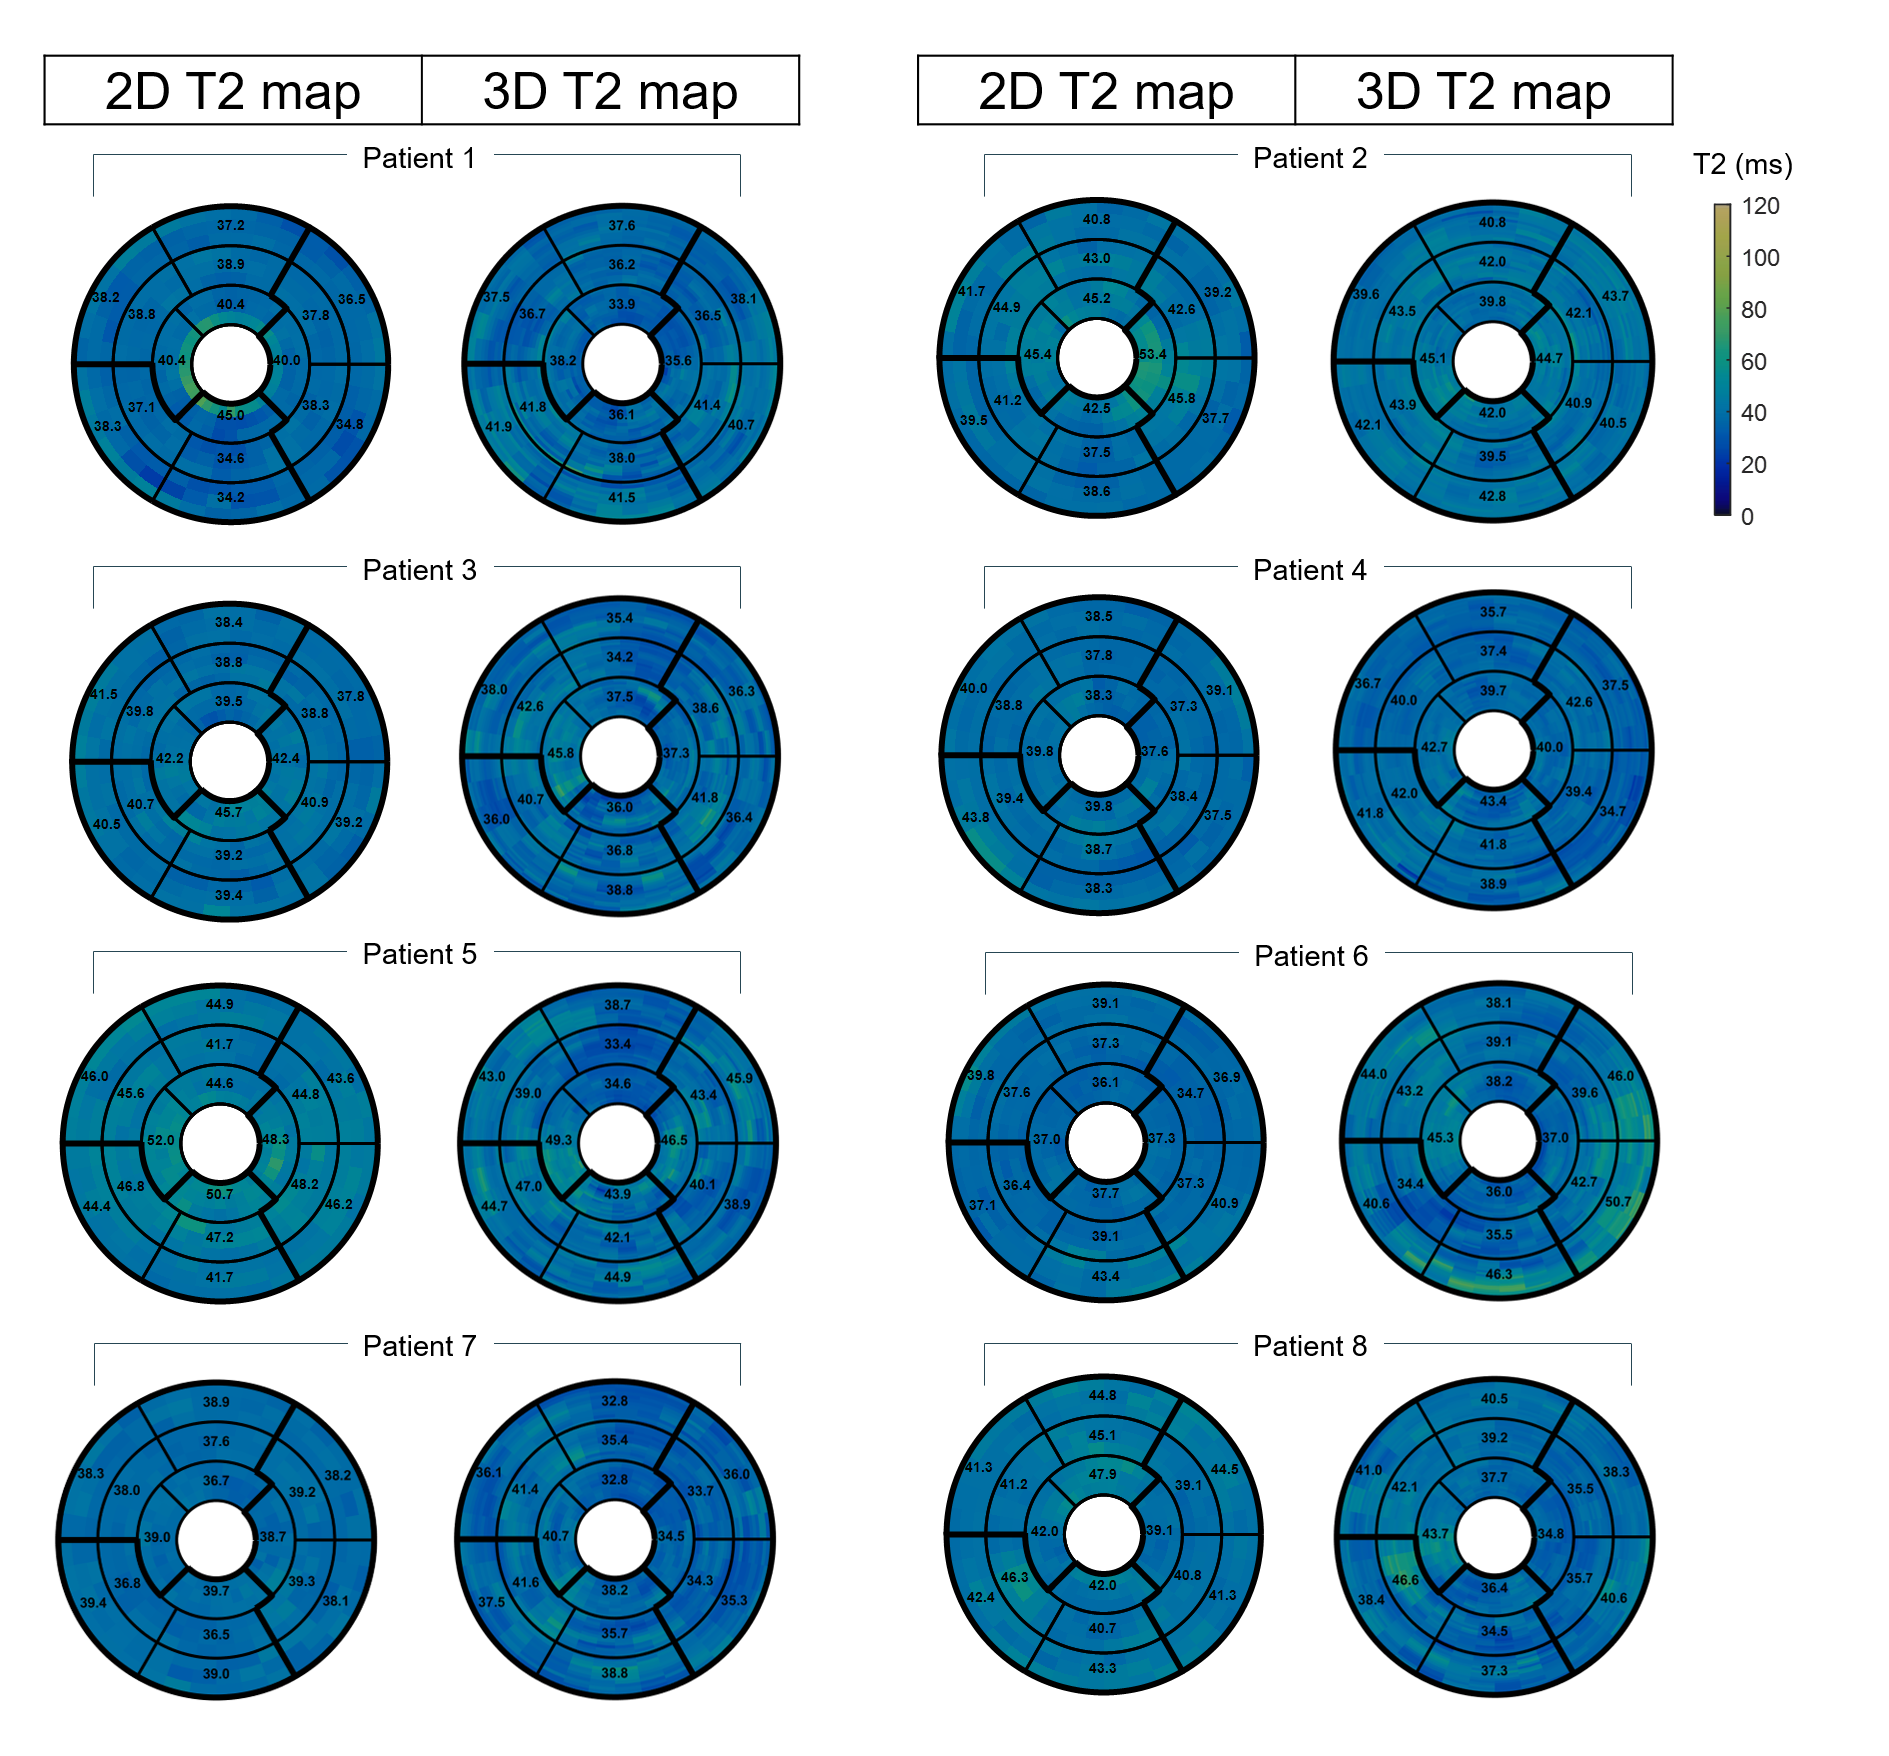
Eight MR-only patients with suspected cardiovascular disease (7 males, 33±16yo) (Table 1) were scanned using the proposed 3D T2-mapping sequence. Data was acquired during mid-diastole using a subject-specific trigger delay, acquisition window and saturation time (longest possible). Imaging parameters included: coronal orientation, FOV=312x312x108-132mm3, 1.5mm3 isotropic resolution, bandwidth=670Hz/px, TR/TE=3.45/1.57ms, flip angle=15°, acquisition time=10.3±1.9min. Image navigators were acquired using 14 low-flip angle (3°) excitations before the 3D acquisition using the same FOV. Conventional breath-held 2D T2prep-bSSFP T2-maps were acquired at apex, mid and base for comparison purposes (imaging parameters: resolution=1.9x1.9x8mm3, T2-preparation pulses=0, 28, 55ms, flip angle=12°, bandwidth=1155 Hz/px). The proposed 3D T2 maps were compared with the conventional 2D T2-maps using the 16-segment AHA model.
Results
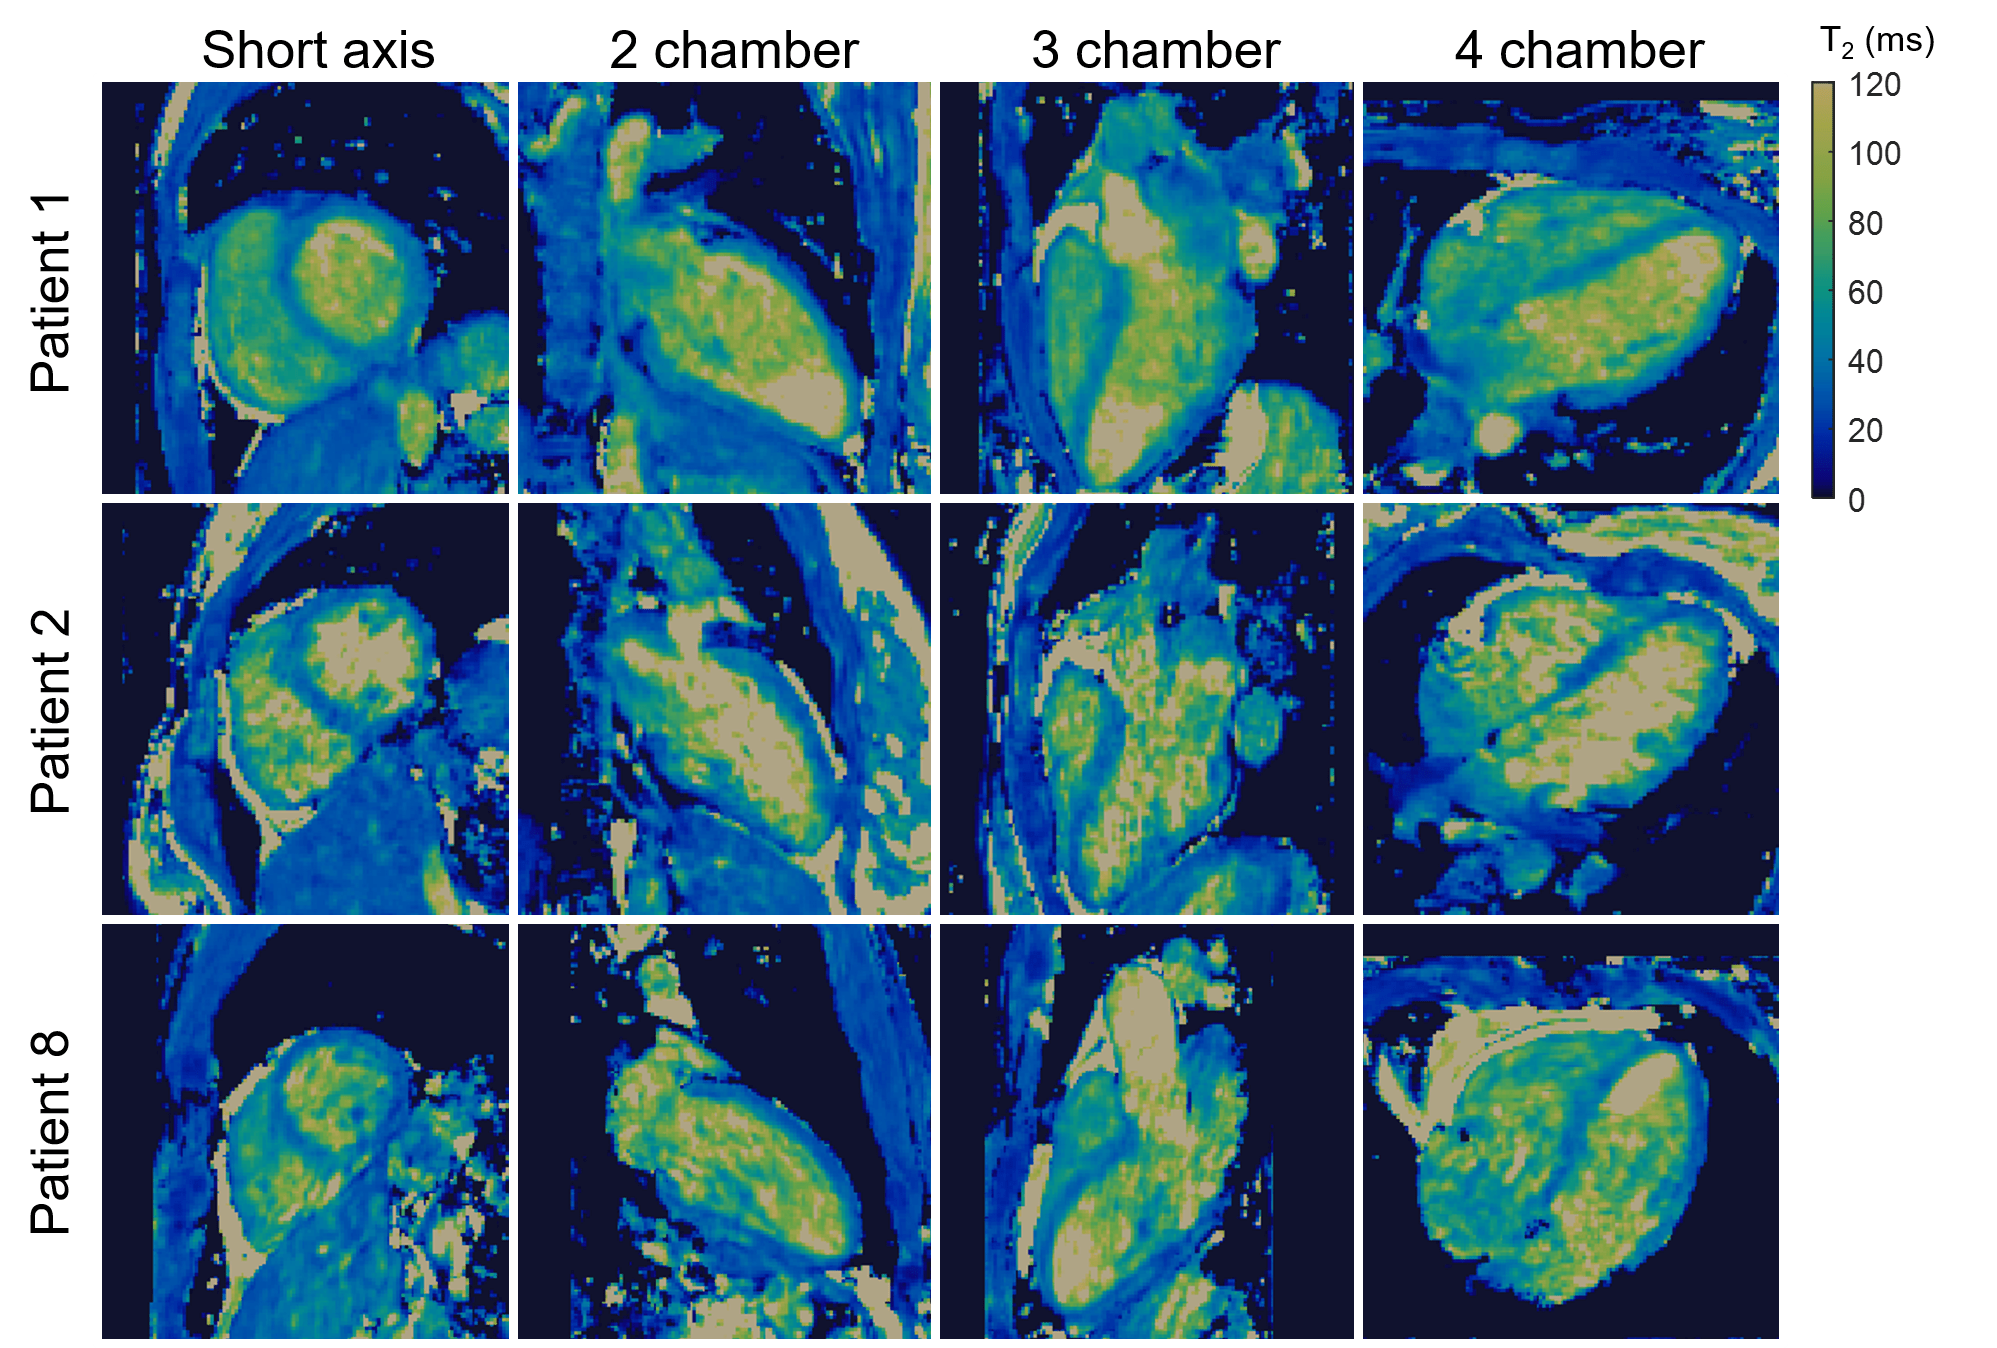
Good agreement was achieved between 3D T2-mapping and 2D multi echo spin echo sequences for all vials in the phantom in terms of image quality and T2-values for all the repetitions (Figure 2). A linear correlation with R2=0.99 was observed between the proposed technique and the reference values. In patients, the proposed approach showed comparable T2-values with conventional 2D T2-maps (Figure 3) while providing whole-heart coverage (Figure 4) with high isotropic resolution. Averaged T2 values were not found statistically different along the basal, mid-cavity and apical slices (basal slices: 3D-T2map=39.7±2.9ms, 2D-T2map=40.1±2.5ms, P=0.76; mid-cavity slices: 3D-T2map=39.5±1.5ms, 2D-T2map=40.2±3ms, P=0.47; apical slices: 3D-T2map=39.6±2.8ms, 2D-T2map=42.1±4.1ms, P=0.064) (Table 1). Most differences were found in apical slices (e.g. patient 2, normal scan), as 2D T2-values tend to be inherently higher in the apex due to the blood pooling, while with the 3D T2-maps interpretation is easier due to better resolution and number of slices. In patient 6, diagnosed with acute myocarditis, we observe higher values with the 3D approach, as an increased coverage of the basal slices are included compared to the 2D technique (Figure 3).Conclusion
We have presented a preliminary MR-only clinical validation of an efficient free-breathing 3D whole-heart T2-mapping sequence in 8 patients with suspected cardiovascular disease. The proposed sequence enables detection of myocardial inflammation and provides non-rigid respiratory motion fields for respiratory motion correction of simultaneously acquired PET data in a 3T hybrid PET-MR system. Repeatability studies in phantom showed good agreement with reference standard SE sequences. Furthermore, good image quality with T2-values comparable to the clinical 2D T2-mapping sequence was achieved in patients. Future studies will evaluate the proposed method in patients with cardiac sarcoidosis undergoing a PET-MR exam after FDG injection.Acknowledgements
This work was supported by EPSRC (EP/L015226/1, EP/P032311/1, EP/P007619/1 and EP/P001009/1) and the Wellcome/EPSRC Centre for Medical Engineering (NS/A000049/1).
References
[1] Birnie DH, Nery PB, Ha AC, Beanlands RSB. Cardiac Sarcoidosis. J Am Coll Cardiol 2016;68:411–21. https://doi.org/10.1016/j.jacc.2016.03.605.
[2] Dweck MR, Abgral R, Trivieri MG, Robson PM, Karakatsanis N, Mani V, et al. Hybrid Magnetic Resonance Imaging and Positron Emission Tomography With Fluorodeoxyglucose to Diagnose Active Cardiac Sarcoidosis. JACC Cardiovasc Imaging 2018;11:94–107. https://doi.org/10.1016/j.jcmg.2017.02.021.
[3] Munoz C, Neji R, Cruz G, Mallia A, Jeljeli S, Reader AJ, et al. Motion‐corrected simultaneous cardiac positron emission tomography and coronary MR angiography with high acquisition efficiency. Magn Reson Med 2018;79:339. https://doi.org/10.1002/mrm.26690.
[4] Bustin A, Milotta G, Ismail TF, Neji R, Botnar RM, Prieto C, et al. Accelerated free-breathing whole-heart 3D T2 mapping with high isotropic resolution. Magn Reson Med 2019;83:988–1002. https://doi.org/10.1002/mrm.27989.
[5] Prieto C, Doneva M, Usman M, Henningsson M, Greil G, Schaeffter T, et al. Highly efficient respiratory motion compensated free-breathing coronary mra using golden-step Cartesian acquisition. J Magn Reson Imaging 2015;41:738–46. https://doi.org/10.1002/jmri.24602.
[6] Henningsson M, Koken P, Stehning C, Razavi R, Prieto C, Botnar RM. Whole-heart coronary MR angiography with 2D self-navigated image reconstruction. Magn Reson Med 2012;67:437–45. https://doi.org/10.1002/mrm.23027.
[7] Psenicny A, Cruz G, Munoz C, Hajhosseiny R, Kuestner T, Kunze KP, et al. Whole-heart CMRA non-rigid motion compensation with autofocus virtual 3D iNAV. ISMRM 2021 2021. https://cds.ismrm.org/protected/21MPresentations/abstracts/0009.html (accessed June 21, 2021).
[8] Atkinson D, Hill DLG, Stoyle PNR, Summers PE, Keevil SF. Automatic correction of motion artifacts in magnetic resonance images using an entropy focus criterion. IEEE Trans Med Imaging 1997;16:903–10. https://doi.org/10.1109/42.650886.
[9] Batchelor PG, Atkinson D, Irarrazaval P, Hill DLG, Hajnal J, Larkman D. Matrix description of general motion correction applied to multishot images. Magn Reson Med 2005;54:1273–80. https://doi.org/10.1002/mrm.20656.
[10] Weigel M. Extended phase graphs: Dephasing, RF pulses, and echoes - pure and simple. J Magn Reson Imaging 2015;41:266–95. https://doi.org/10.1002/jmri.24619.
Figures