1568
Wideband Pulse Sequences for Suppressing Image Artifacts Induced by an ICD: A study in a Pediatric Anthropomorphic Phantom
Oluyemi Aboyewa1,2, KyungPyo Hong2, Fuchang Jiang1, Bhumi Bhusal2, Giorgio Bonmassar3, Andrada Popescu4, Gregory Webster5, Laleh Golestanirad1,2, and Daniel Kim1,2
1Department of Biomedical Engineering, McCormick School of Engineering, Northwestern University, Evanston, IL, United States, 2Department of Radiology, Feinberg School of Medicine, Northwestern University, Chicago, IL, United States, 3AA. Martinos Center Massachusetts General Hospital Harvard Medical School, Charlestown, MA, United States, 4Department of Medical Imaging, Ann & Robert H. Lurie Children's Hospital, Chicago, IL, United States, 5Division of Cardiology, Department of Pediatrics, Ann & Robert H. Lurie Children's Hospital, Chicago, IL, United States
1Department of Biomedical Engineering, McCormick School of Engineering, Northwestern University, Evanston, IL, United States, 2Department of Radiology, Feinberg School of Medicine, Northwestern University, Chicago, IL, United States, 3AA. Martinos Center Massachusetts General Hospital Harvard Medical School, Charlestown, MA, United States, 4Department of Medical Imaging, Ann & Robert H. Lurie Children's Hospital, Chicago, IL, United States, 5Division of Cardiology, Department of Pediatrics, Ann & Robert H. Lurie Children's Hospital, Chicago, IL, United States
Synopsis
This study investigated whether wideband late-gadolinium enhancement (LGE) and T1 mapping pulse sequences can suppress image artifacts induced by an ICD positioned 12cm inferior to the heart in a pediatric anthropomorphic phantom. The ICD induced a peak-to-peak center frequency shift of 970Hz across the heart. The normalized mean signal intensity within the heart was 1.91±1.20 and 0.98±0.39, for standard and wideband LGE with ICD, respectively. The mean myocardial T1 was 1486.1±607.7 and 1728.3±332.3msec for standard and wideband T1 mapping, respectively. Our results demonstrate that wideband pulse sequences can suppress image artifacts induced by an ICD in a pediatric anthropomorphic phantom.
Introduction
Infants and children with heart disease often require cardiac implanted electronic devices (CIED) [1]. The optimal approach to affixing a CIED to the heart of a young patient is to open the chest and sew the cardiac lead directly to the myocardium (“epicardial leads”) as opposed to passing it through veins and affix to the inside of the heart (“endocardial leads”). Unfortunately, once an epicardial lead configuration has been implanted, it is considered a relative contraindication to MRI due to the unknown risk of radiofrequency (RF) heating caused by CIEDs with epicardial leads [1]. The latest HRS/AHA/ACCF guideline makes no formal recommendation for MRI in pediatric patients with CIED, other than the case-by-case decision based on the risk/benefit ratio. As the field is gathering data to evaluate MR safety, it is paramount to prepare cardiovascular magnetic resonance methods such as late-gadolinium enhancement (LGE) and T1 mapping that produce diagnostically acceptable image quality, thereby amplifying the benefit. In this study, we sought to evaluate whether wideband LGE [2] and wideband T1 mapping [3] are capable of suppressing image artifacts induced by an implantable cardioverter-defibrillator (ICD) in a pediatric anthropomorphic phantom with a patient-specific epicardial lead configuration.Materials and Methods
Pediatric phantom: A 3D-printed anthropomorphic phantom was designed and constructed based on a segmented MRI of a 2.5-year-old patient [4]. The phantom consists of an artificial heart and a human-shaped body filled with a tissue-equivalent gel [5]. The heart was made from agar gel and impregnated with a vitamin E-capsule (fish oil) to simulate myocardial scarring at the apex. An ICD (Medtronic, USA) was placed at the abdomen 12 cm below the heart (see fig 1). MRI: All images were acquired with and without ICD in a coronal plane on a 1.5 T MRI scanner (Aera, Siemens). We performed multi-echo B0 mapping to measure the center frequency offset induced by the ICD using the following imaging parameters: field-of-view (FOV)=300x225 mm$$$^2$$$, reconstruction matrix=64x48, slice thickness=10 mm, first/second echo times (TE)=0.86/1.85 msec, repetition time (TR)= 3.1 msec, flip angle (FA)=15°, receiver bandwidth=1955 Hz/pixel, spoiled gradient echo (GRE) readout, asymmetric echo (0.73), and parallel imaging (GRAPPA) factor=2 [6]. We performed both standard and wideband LGE and T1 mapping sequences using the following relevant imaging parameters: FOV=360x270 mm$$$^2$$$, reconstruction matrix=192x144, slice thickness=6 mm, TE/TR=1.01/2.15 msec for LGE and 0.89/2.01 msec for T1 mapping, receiver bandwidth=1860 Hz/pixel, FA=15°, GRE, and GRAPPA=2. For LGE, the inversion time (TI) was set to 1200 msec, in order to null the signal of myocardium. For LGE, the frequency bandwidth of inversion-recovery (IR) RF pulse was 1 and 4 kHz for standard and wideband [7], respectively (see Figure 2), and inversion time (TI) was 1200 msec. For T1 mapping, the frequency bandwidth of saturation-recovery (SR) RF pulse was 2.5 and 8.9 kHz for standard and wideband [3], respectively, and saturation recovery time (TS) was 1000 msec. Image analysis: We calculated the B0 map from two phase-unwrapped images with different TEs. To compare the standard and wideband LGE sequences, we normalized the LGE images scanned with ICD by those obtained without ICD (reference). We manually drew the region of interest (ROI) in the heart and calculated 1) peak-to-peak center frequency shift in the B0 map and 2) mean and standard deviation (SD) of the signal intensities in the normalized LGE images and mean and SD of T1 values in the T1 maps.Results
Figure 3 shows two phase-wrapped images with different TEs and their corresponding B0 map. The peak-to-peak center frequency variation across the heart was 970 Hz, which is 13.7-times higher than center frequency variation of 71 Hz across the heart in non-device patients at 1.5 T [8]. Figure 4 shows standard and wideband LGE images without and with ICD. The normalized mean and SD of signal intensity were 1.91 ± 1.20 and 0.98 ± 0.39 for standard and wideband, respectively. Figure 5 shows standard and wideband T1 maps with ICD. The mean myocardial T1 values were 1486.1 ± 607.7 and 1728.3 ± 332.3 msec for standard and wideband, respectively.Conclusion
This study demonstrated that wideband LGE and T1 mapping pulse sequences are capable of suppressing image artifacts induced by an ICD in a pediatric anthropomorphic phantom. Future studies are warranted to investigate both MR safety and image quality in pediatrics with a CIED.Acknowledgements
This work was partially supported by the following grants: National Institutes of Health (R01HL116895, R01HL138578, R21EB024315, R21AG055954, R01HL151079, R21EB030806) and American Heart Association (19IPLOI34760317).References
- C. M. Tracy et al., “2012 ACCF/AHA/HRS focused update incorporated into the ACCF/AHA/HRS 2008 guidelines for device-based therapy of cardiac rhythm abnormalities: a report of the American College of Cardiology Foundation/American Heart Association Task Force on Practice Guidelines and the Heart Rhythm Society,” Journal of the American College of Cardiology, vol. 61, no. 3, pp. e6–e75, 2013.
- S. Rashid et al., “Improved late gadolinium enhancement MR imaging for patients with implanted cardiac devices,” Radiology, vol. 270, no. 1, pp. 269–274, 2014.
- K. Hong, E. Jeong, T. S. Wall, S. G. Drakos, and D. Kim, “Wideband arrhythmia‐insensitive‐rapid (AIR) pulse sequence for cardiac T1 mapping without image artifacts induced by an implantable‐cardioverter‐defibrillator,” Magnetic resonance in medicine, vol. 74, no. 2, pp. 336–345, 2015.
- H. Jeong et al., “Development, validation, and pilot MRI safety study of a high-resolution, open source, whole body pediatric numerical simulation model,” Plos one, vol. 16, no. 1, p. e0241682, 2021.
- A. International, “ASTM F2182–11a Standard Test Method for Measurement of Radio Frequency Induced Heating on or Near Passive Implants During Magnetic Resonance Imaging,” 2011.
- M. A. Griswold et al., “Generalized autocalibrating partially parallel acquisitions (GRAPPA),” Magnetic Resonance in Medicine: An Official Journal of the International Society for Magnetic Resonance in Medicine, vol. 47, no. 6, pp. 1202–1210, 2002.
- R. Ranjan et al., “Wideband late gadolinium enhanced magnetic resonance imaging for imaging myocardial scar without image artefacts induced by implantable cardioverter-defibrillator: a feasibility study at 3 T,” Ep Europace, vol. 17, no. 3, pp. 483–488, 2014.
- S. B. Reeder, A. Z. Faranesh, J. L. Boxerman, and E. R. McVeigh, “In vivo measurement of T* 2 and field inhomogeneity maps in the human heart at 1.5 T,” Magnetic resonance in medicine, vol. 39, no. 6, pp. 988–998, 1998.
- M. A. Herráez, D. R. Burton, M. J. Lalor, and M. A. Gdeisat, “Fast two-dimensional phase-unwrapping algorithm based on sorting by reliability following a noncontinuous path,” Applied optics, vol. 41, no. 35, pp. 7437–7444, 2002.
Figures

3D printed anthropomorphic phantom of a 2.5-year-old patient, showing
the skull, ribs, heart, with an ICD positioned in the abdomen at 12 cm from the
heart. The phantom was filled with a tissue equivalent gel that submerges the
heart and ICD prior to the scan.
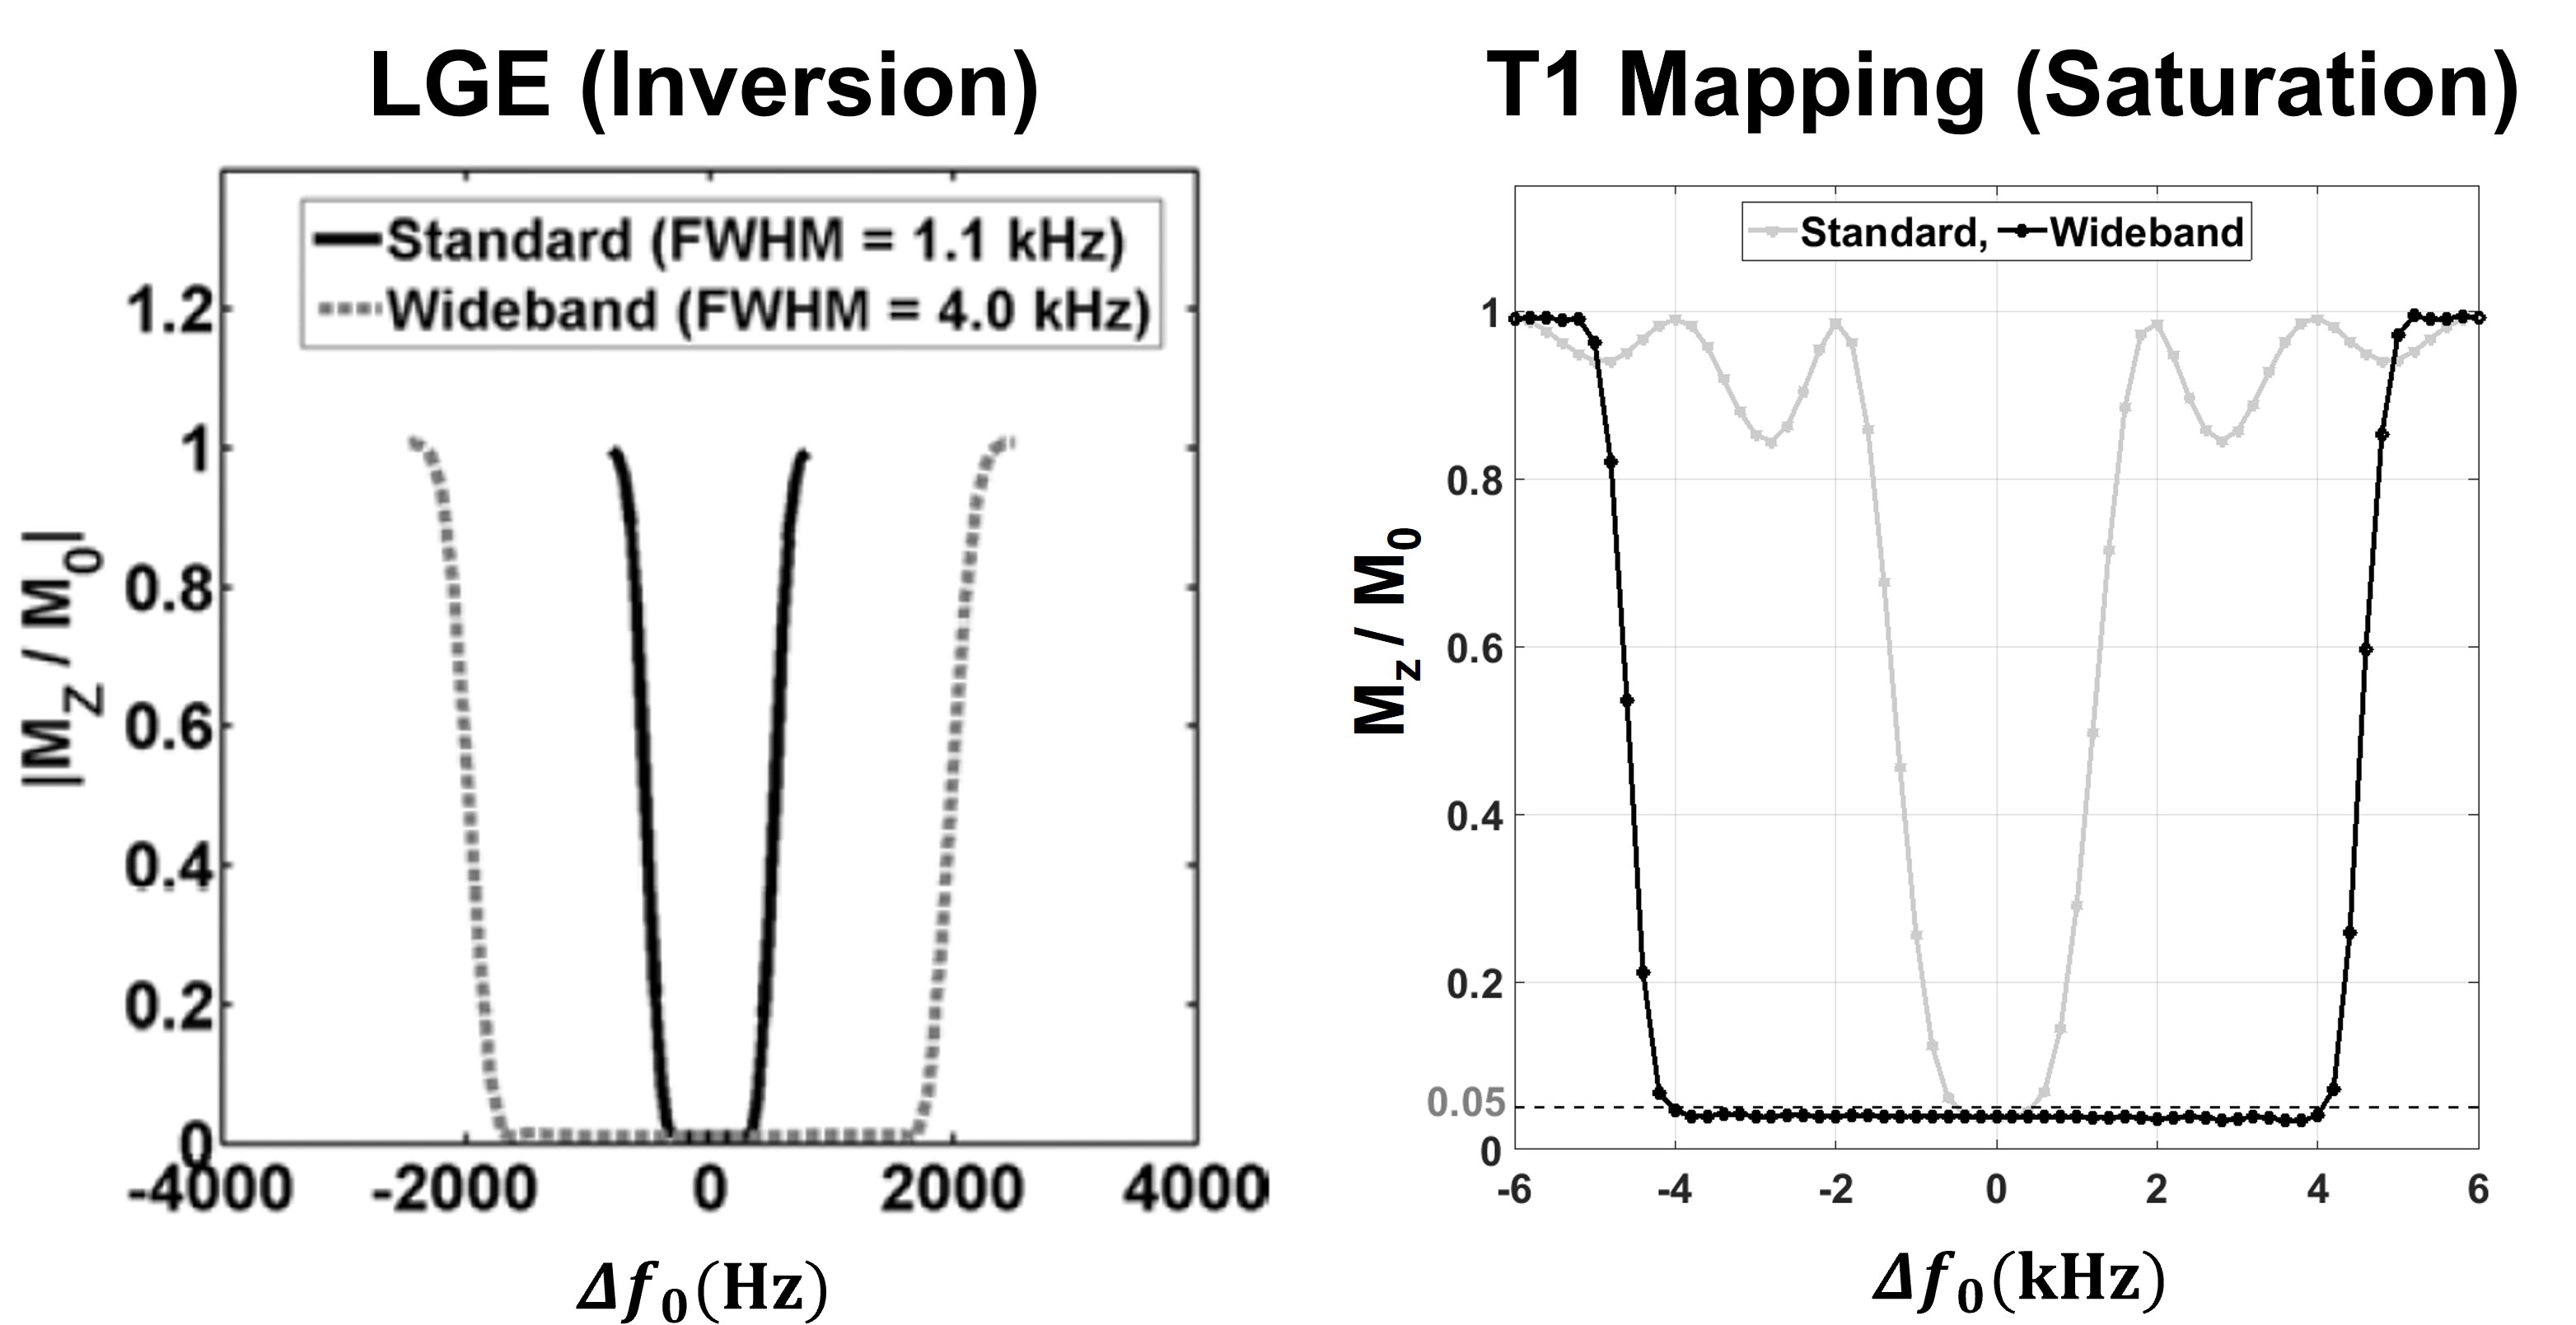
The profiles of Mz/M0 as a function of center frequency shifts ($$$\Delta{ f_{0}}$$$) for the standard and wideband pulses. For
inversion pulses (IR) [left], the residual Mz/M0 = 0 corresponds to perfect
inversion of magnetization at TI = 1200 msec, whereas |Mz / M0| > 0
corresponds to regions where the IR pulse is ineffective [7]. For saturation pulses [right], the
residual Mz = 0 corresponds to complete saturation of magnetization, while Mz =
1 corresponds to no saturation [3].

The center frequency offset ($$$f$$$) due to the ICD was calculated
from the B0 map obtained from the difference of two-phase images ($$$\Delta \phi$$$) with $$$\Delta$$$TE = 0.99 msec. Phase unwrapping was done using
the in-built phase unwrapping module in python [9]. The pink and yellow color ROIs on the B0
map are overlay of the phantom and heart outline, respectively.
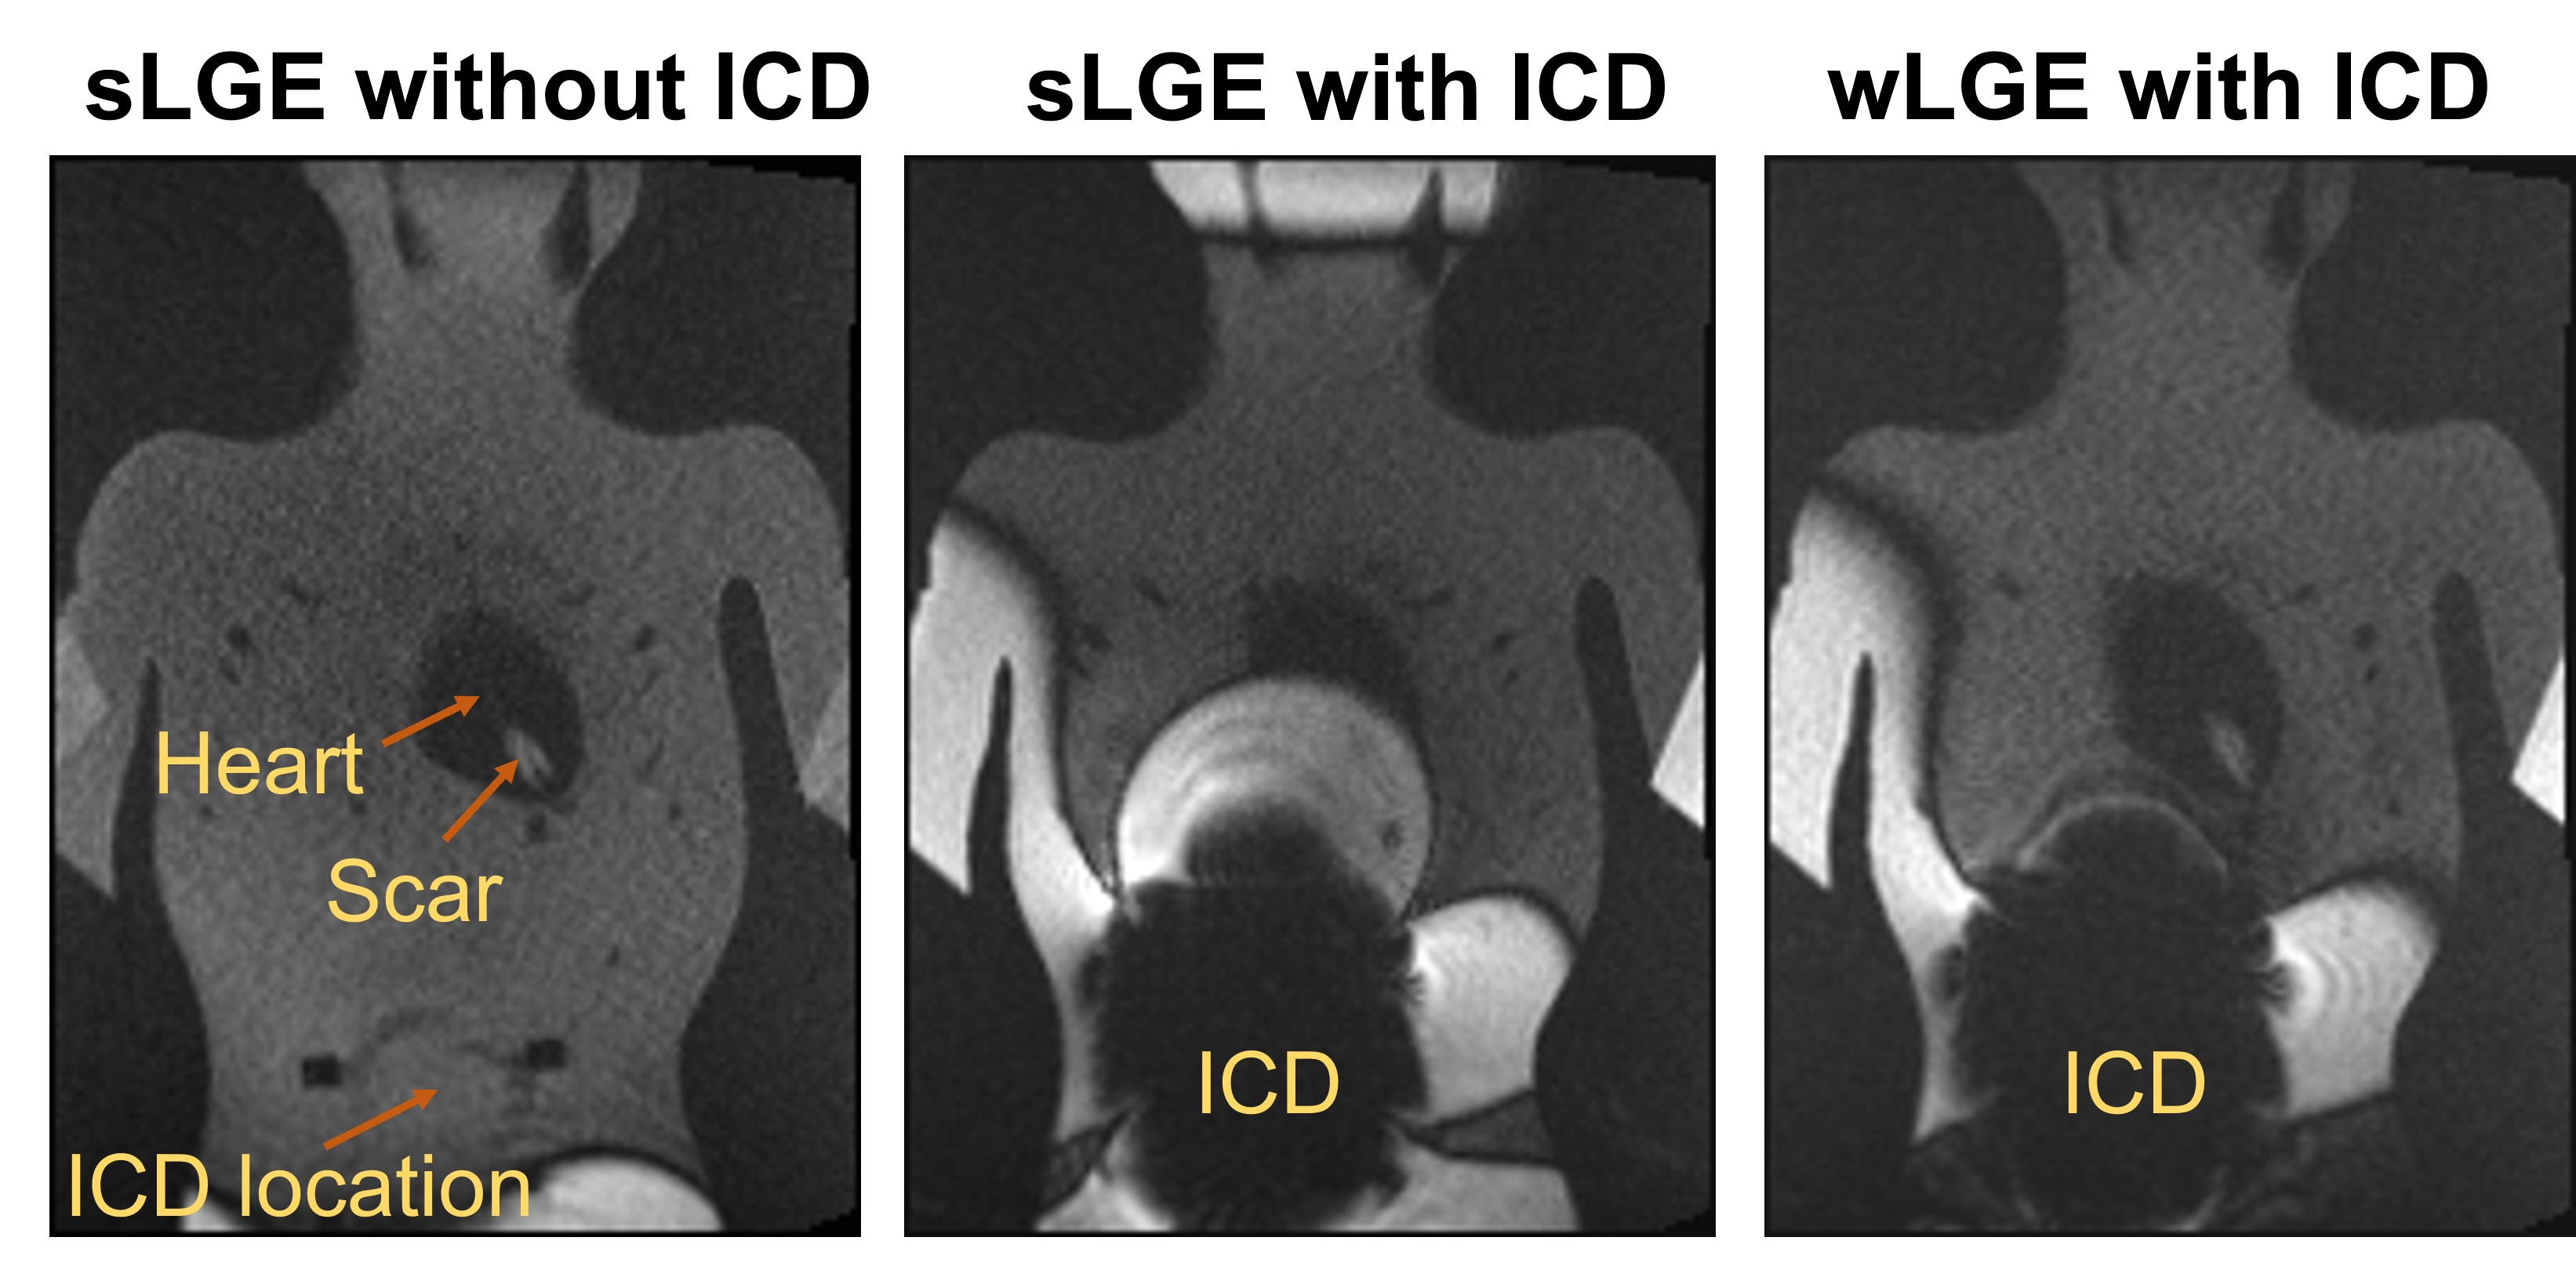
LGE images obtained in a coronal slice of the phantom: standard LGE
(sLGE) without the ICD [left column]; standard LGE with ICD [middle column];
wideband LGE (wLGE) with ICD. Compared with sLGE, wLGE suppressed hyperintense
image artifacts caused by the ICD. Both
sLGE and wLGE images show signal void in the ICD region.
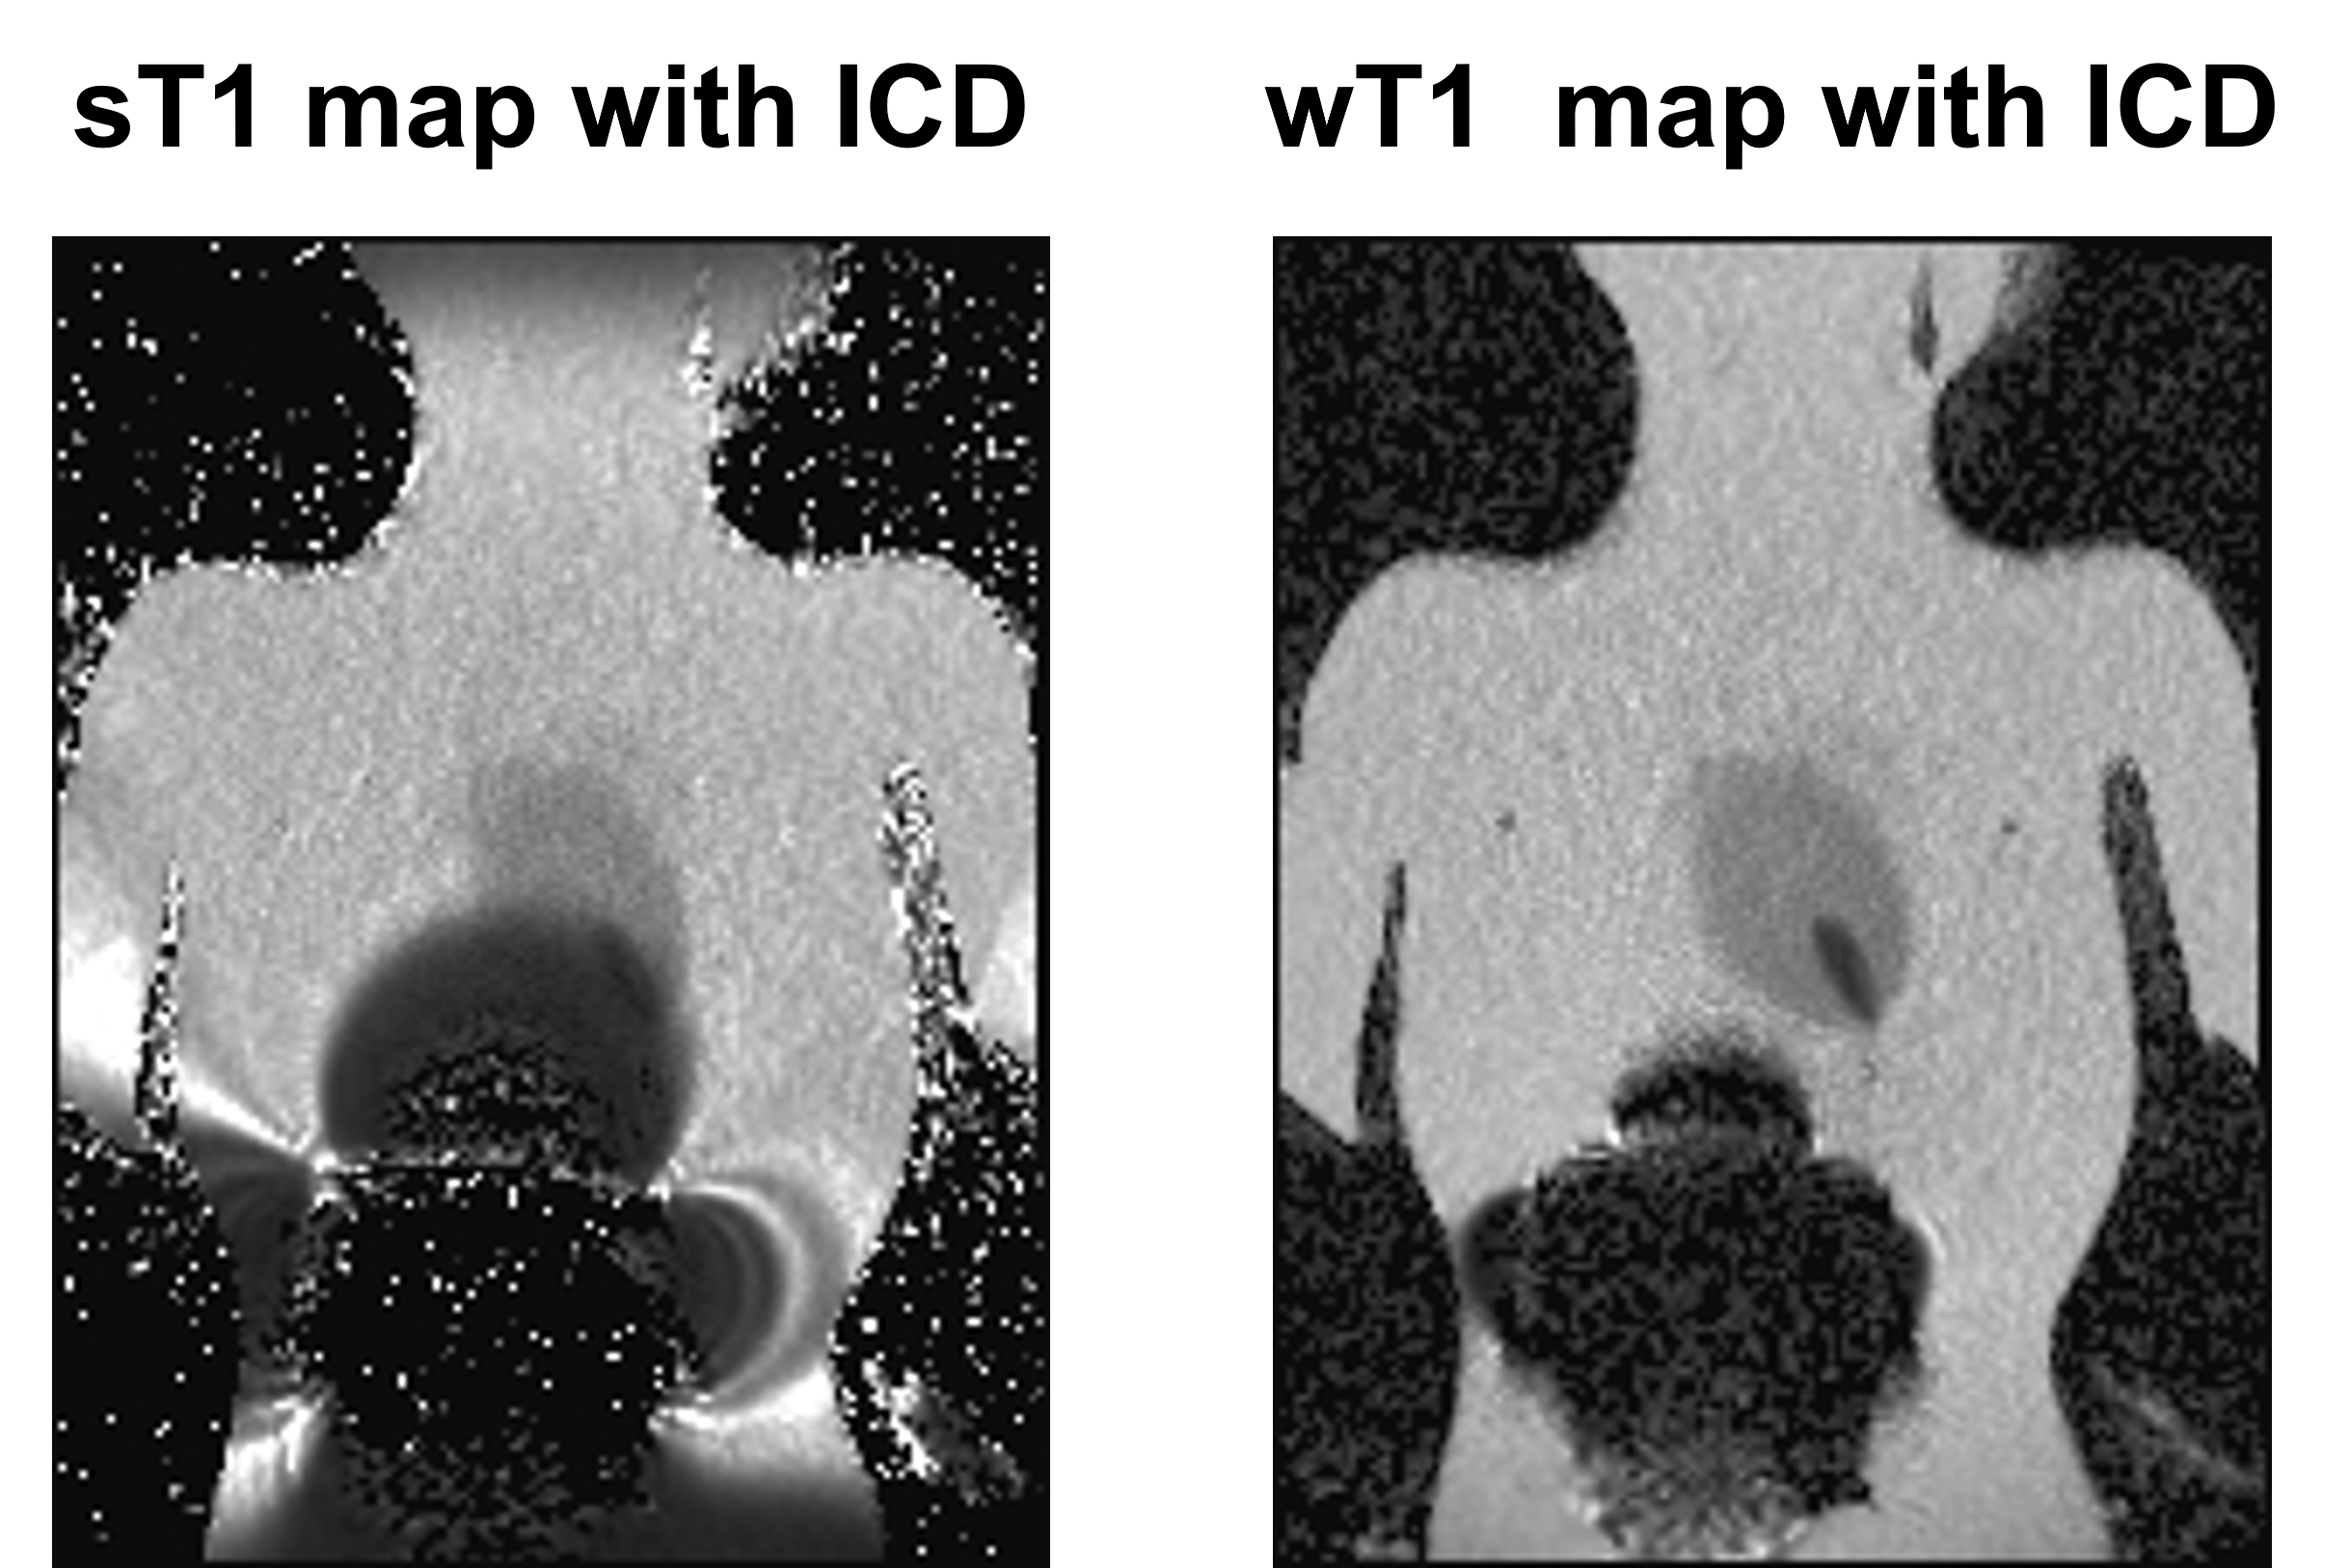
T1 mapping of the phantom: standard T1 (sT1) with ICD [left]; wideband
T1 (wT1) with ICD [right]. Compared with sT1, wT1 suppressed hypo-intense image
artifacts caused by the ICD.
DOI: https://doi.org/10.58530/2022/1568