1566
In-vivo comparison of Active Tracking based cardiac triggering and ECG-triggering for cardiac MR-thermometry1School of Biomedical Engineering and Imaging Sciences, Faculty of Life Sciences and Medicine, King's College London, London, United Kingdom, 2MR Research Collaborations, Siemens Healthcare Limited, Frimley, United Kingdom, 3Siemens Healthcare GmbH, Erlangen, Germany, 4Imricor Medical Systems, Burnsville, MN, United States, 5University of Edinburgh, Edinburgh, United Kingdom, 6Physikalisch-Technische Bundesanstalt (PTB), Braunschweig and Berlin, Germany
Synopsis
Continuous AT was used for cardiac synchronization of MR-thermometry with on-line signal filtering, calibration, and triggering. Experiments in a porcine animal model, where AT-trig was compared to ECG triggering, showed that AT-trig could potentially serve as alternative cardiac triggering strategy in situations where ECG triggering is not effective.
Introduction
MR-thermometry represents a promising approach for monitoring ablation lesion formation during radiofrequency ablation (RFA) in the left ventricle (LV)1–6. ECG-triggering is commonly employed for cardiac MR-thermometry but may be unreliable because of the RFA hardware and the fast switching gradients associated with EPI thermometry sequences4,7. Since MR RFA catheters contain microcoils to navigate the catheter using active tracking (AT)4,5,8, AT also has the potential to be used for cardiac triggering of an MR-thermometry sequence9,10. In this study, we present the first in-vivo head-to-head comparison between AT-based triggering and ECG-triggering for MR-thermometry and its in-vivo feasibility during RFA.Methods
Sequences and signal processingThe proposed AT-triggered MR-thermometry sequence (Figure 1) consists of an AT signal calibration phase and a run-time phase. During the calibration phase, the catheter displacement was continuously monitored using uninterrupted AT module acquisitions. The cardiac motion component of the catheter displacement was extracted from the AT signal and used to determine a cardiac trigger criterion. During the run-time phase, AT modules were continuously repeated until a trigger event was recorded that initiated each dynamic MR-thermometry imaging block (multi-slice single-shot EPI).
AT signal generation: The AT pulse sequence module measured the microcoil position along all three spatial dimensions in 25ms8,11. AT signal was defined as the sum-of-squares of the 3D coordinates of one of the two AT microcoils. Outliers were rejected to remove incoherent measurements and were defined as exceeding by two times the measured range of motion (excluding 5 lower and upper centiles) observed in the unfiltered data acquired during the calibration phase. A bandpass filter was applied to remove low and high frequencies associated with respiratory motion and noise12 using a finite impulse response filter (cut-off frequencies: 0.67Hz and 2.5Hz, filter order: 400). The most recent AT position after filtering was kept as the filtered AT signal.
Calibration phase: An AT signal threshold (SThresh) that could be used for cardiac triggering was calculated as the median position of the filtered signal obtained during the calibration phase.
Run-time phase: A trigger event was defined when 3 conditions were met:
1. The last 3 filtered AT signal entries contained an extremum (peak or valley) at the middle sample. Switching between peak or valley detection was implemented to help in synchronizing the thermometry acquisition with the desired cardiac phase.
2. The last 3 AT modules were measured sequentially, to avoid triggering on AT signals that were interrupted by thermometry imaging.
3. The position of the extremum was superior (peak triggering) or inferior (valley triggering) to SThresh.
Upon trigger detection the MR-thermometry block was started after a trigger delay, which was filled with additional AT modules to minimize the gap in AT signal for filtering (Figure 1).
Experimental validation
A mechanically ventilated porcine animal model was used with a 1.5T scanner (MAGNETOM Aera, Siemens Healthcare, Erlangen, Germany). An MR-compatible catheter (Vision-MR Ablation Catheter, Imricor Medical Systems, Burnsville, MN) was positioned in the LV of the animal. Three MR-thermometry scans were acquired using: 1) ECG-triggering, 2) AT-trig on peak, 3) AT-trig on valley, at six different locations within the LV. All MR-thermometry measurements5 used single-shot EPI to measure temperature changes using the proton-resonance-frequency-shift method (3 slices, 150 dynamics, 150ms trigger delay, TE 17ms, TR 93ms, FOV 180x180mm2, voxel size 1.6x1.6mm2, slice thickness 5mm, GRAPPA 2, partial Fourier 75%, BW 1540Hz/pixel). Temperature maps were reconstructed offline as described in5 using a conventional processing pipeline13 (including multibaseline correction, image-registration and temporal filtering). Stability of thermometry was computed for each voxel inside the myocardium as the temperature standard deviation across the last 110 dynamics. The feasibility of AT-triggered MR-thermometry during in-vivo RFA (30s, 30W) was demonstrated in 1 LV position.
Results
AT signal measurement, outlier rejection, and filtering resulted in smooth signals for triggering, with regular intervals between triggers that matched ECG-derived heartrate (Figure 2). Representative in-vivo stability of MR thermometry is shown in 2 LV positions in Figure 3. Figure 4 shows that similar ranges of temperature stabilities were obtained using AT-trig peak, AT-trig valley and ECG-triggering over all 6 LV positions: 1.5±0.6°C vs. 1.8±0.7°C vs. 1.5±0.6°C, respectively. AT-triggered MR-thermometry during RFA showed a localized temperature rise (Figure 5).Discussion
The respiratory-induced motion of the heart was small in the porcine model, therefore not showing the full potential of the AT signal filter. However, demodulation of cardiac and respiratory motion from catheter displacement recordings has previously been shown using this approach12 and the employed filter should translate into similar benefit in patients.Stability of temperature mapping with AT-trig on peak was higher than with AT-trig on valley. This bias could represent more successful trigger determination or MR-thermometry acquisition during a more favorable cardiac phase, depending on the position and orientation of the catheter inside the LV. An AT-triggered CINE scan could be developed to facilitate the selection of the optimal triggering condition and delay.
Conclusion
AT-based cardiac triggering was successfully demonstrated for in-vivo MR-thermometry with on-line signal filtering, calibration, and triggering. AT-trig and ECG-triggering led to similar in-vivo temperature stability maps. AT-trig could potentially serve as alternative cardiac triggering strategy in situations where ECG triggering is not effective.Acknowledgements
This work was supported by the Engineering and Physical Sciences Research Council (EPSRC) grant (EP/R010935/1), the British Heart foundation (BHF) grant (PG/19/11/34243), The Innovate UK grant (68539), the Wellcome EPSRC Centre for Medical Engineering at Kings College London (WT 203148/Z/16/Z), the National Institute for Health Research (NIHR) Biomedical Research Centre based at Guy’s and St Thomas’ NHS Foundation Trust and King’s College London. The views expressed are those of the authors and not necessarily those of the NHS, the NIHR or the Department of Health.
References
1. Kolandaivelu A, Zviman MM, Castro V, Lardo AC, Berger RD, Halperin HR. Noninvasive Assessment of Tissue Heating During Cardiac Radiofrequency Ablation Using MRI Thermography. Circ Arrhythmia Electrophysiol. 2010;3(5):521-529. doi:10.1161/CIRCEP.110.942433
2. de Senneville BD, Roujol S, Jaïs P, Moonen CTW, Herigault G, Quesson B. Feasibility of fast MR-thermometry during cardiac radiofrequency ablation. NMR Biomed. 2012;25(4):556-562. doi:10.1002/nbm.1771
3. Ozenne V, Toupin S, Bour P, et al. Improved cardiac magnetic resonance thermometry and dosimetry for monitoring lesion formation during catheter ablation. Magn Reson Med. 2017;77(2):673-683. doi:10.1002/mrm.26158
4. Toupin S, Bour P, Lepetit-Coiffé M, et al. Feasibility of real-time MR thermal dose mapping for predicting radiofrequency ablation outcome in the myocardium in vivo. J Cardiovasc Magn Reson. 2017;19(1):14. doi:10.1186/s12968-017-0323-0
5. Mukherjee RK, Roujol S, Chubb H, et al. Epicardial electroanatomical mapping, radiofrequency ablation, and lesion imaging in the porcine left ventricle under real-time magnetic resonance imaging guidance—an in vivo feasibility study. EP Eur. 2018;20(FI2):f254-f262. doi:10.1093/europace/eux341
6. Zaltieri M, Massaroni C, Cauti FM, Schena E. Techniques for temperature monitoring of myocardial tissue undergoing radiofrequency ablation treatments: An overview. Sensors. 2021;21(4):1-27. doi:10.3390/s21041453
7. Hey S, Cernicanu A, de Senneville BD, et al. Towards optimized MR thermometry of the human heart at 3T. NMR Biomed. 2012;25(1):35-43. doi:10.1002/nbm.1709
8. Dumoulin CL, Souza SP, Darrow RD. Real-time position monitoring of invasive devices using magnetic resonance. Magn Reson Med. 1993;29(3):411-415. doi:10.1002/mrm.1910290322
9. Mooiweer R, Schneider R, Neji R, et al. Active Tracking-based cardiac triggering of MR thermometry for MRI-guided cardiac ablation. In: Proc. Intl. Soc. Mag. Reson. Med. 27. ; 2019:3820.
10. Mooiweer R, Schneider R, Neji R, et al. Active tracking based cardiac triggering of MR thermometry in an animal model. In: Proc. Intl. Soc. Mag. Reson. Med. 28. ; 2020:0120.
11. Dumoulin CL, Mallozzi RP, Darrow RD, Schmidt EJ. Phase-field dithering for active catheter tracking. Magn Reson Med. 2010;63(5):1398-1403. doi:10.1002/mrm.22297
12. Roujol S, Anter E, Josephson ME, Nezafat R. Characterization of respiratory and cardiac motion from electro-anatomical mapping data for improved fusion of MRI to left ventricular electrograms. PLoS One. 2013;8(11):1-9. doi:10.1371/journal.pone.0078852
13. Roujol S, Ries M, Quesson B, Moonen C, Denis de Senneville B. Real-time MR-thermometry and dosimetry for interventional guidance on abdominal organs. Magn Reson Med. 2010;63(4):1080-1087. doi:10.1002/mrm.22309
Figures
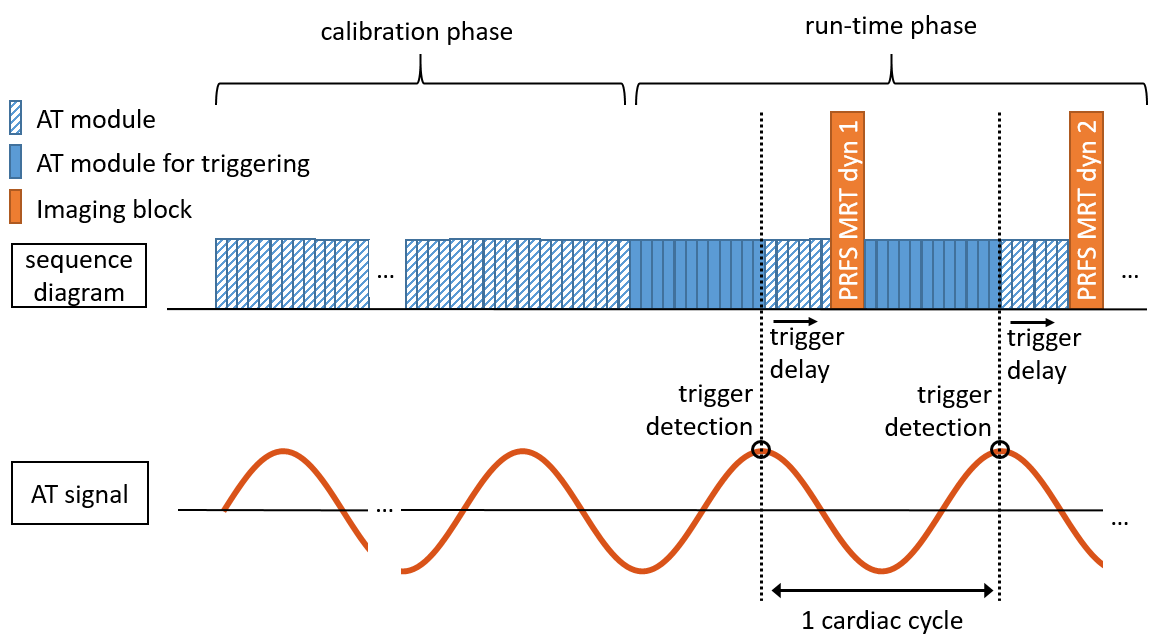
Figure 1. Schematic diagram of AT-based triggered MR thermometry. PRFS: Proton resonance frequency shift, MRT: MR-thermometry, dyn: dynamic image number.
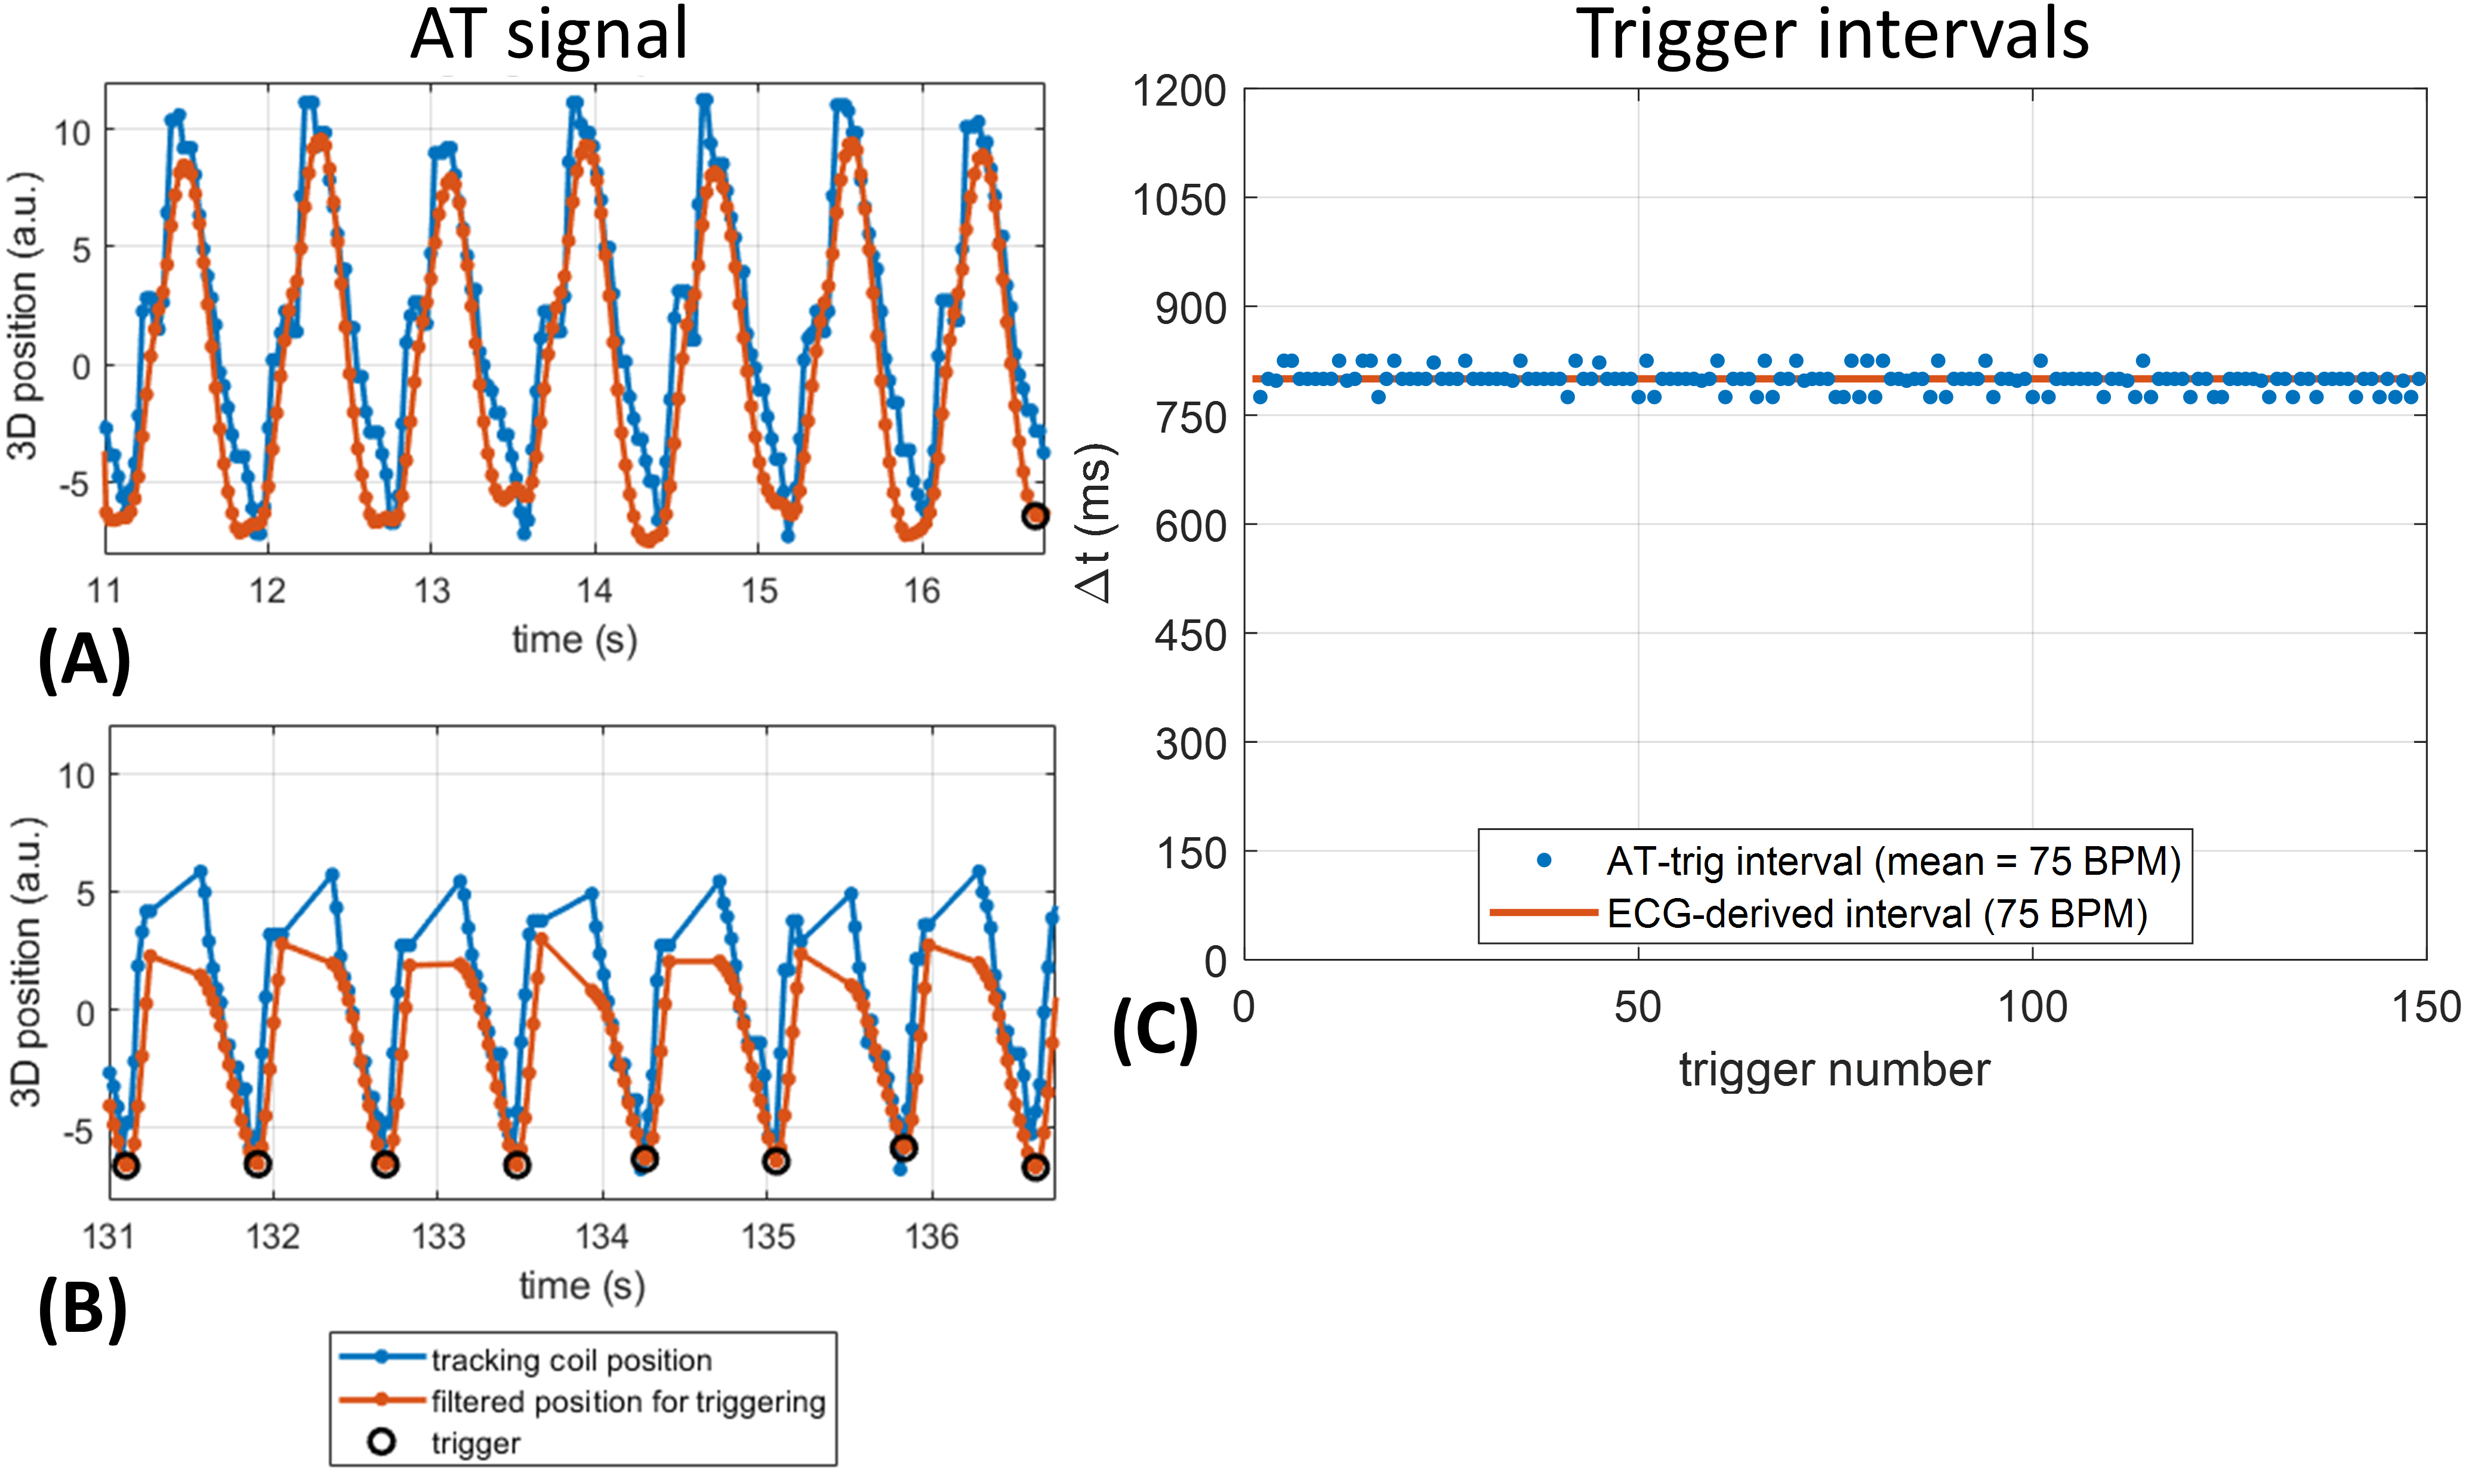
Figure 2. AT signal segments measured in LV position 5 with AT-trig on valleys. A) Continuous AT signal acquired during calibration phase. B) AT signal segment during run-time phase, showing triggers and AT signal interruptions by imaging. C) Intervals between all triggering events in the experiment, compared to an ECG-derived trigger interval measured immediately afterwards. The AT-trig-derived cardiac cycle length matches the ECG-derived value well throughout the experiment.
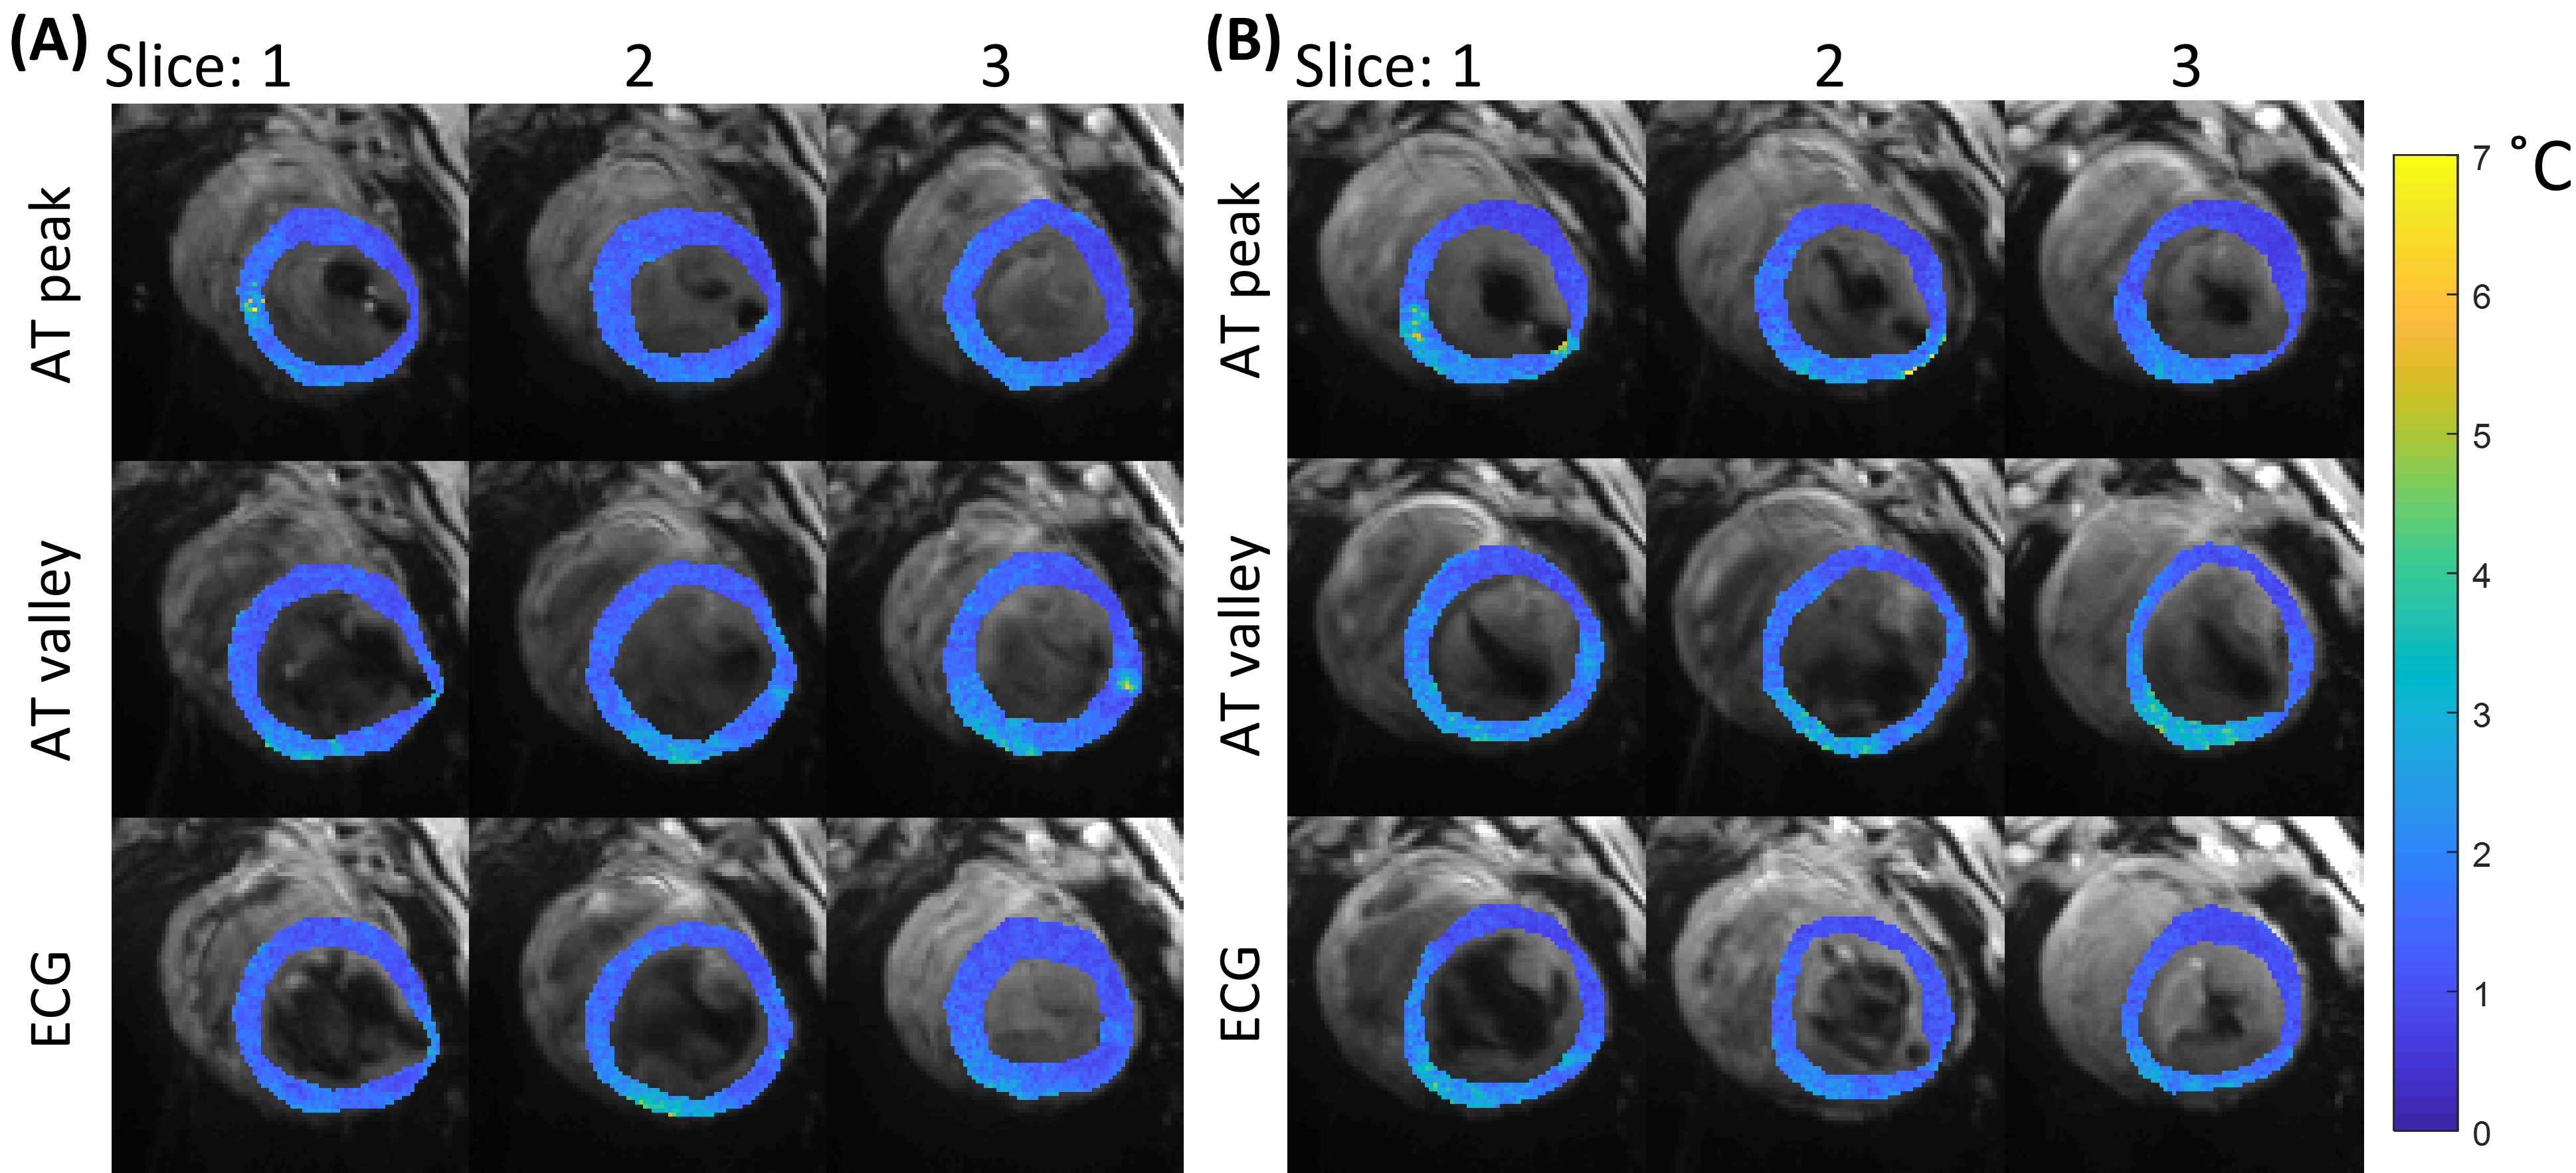
Figure 3. Temperature stability maps of myocardial tissue acquired with the 3 different strategies for cardiac triggering in 2 LV positions. The stability values (colored maps) are overlaid on average magnitude images (grey scale). Stable thermometry values are shown: A) position 4, mean±sd per method: 1.4±0.5°C, 1.6±0.6°C 1.5±0.5°C, for AT peak, AT valley and ECG respectively, B) position 5, mean±sd per method: 1.4±0.6°C, 1.8±0.7°C, 1.5±0.6°C, for AT peak, AT valley and ECG respectively.
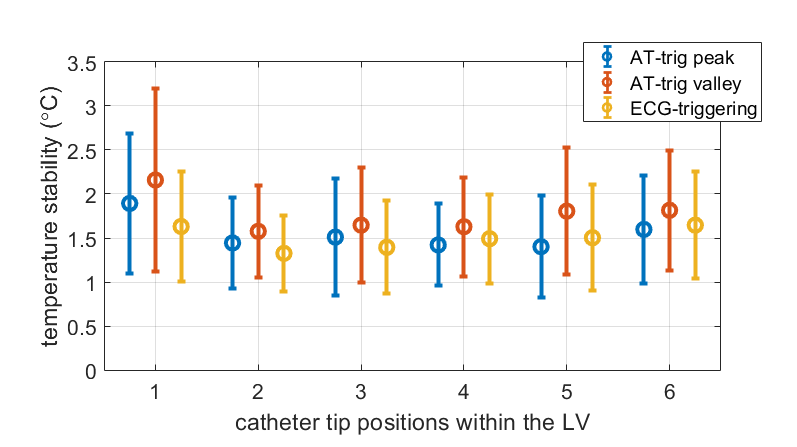
Figure 4. Temperature stability in all LV positions. Per triggering method, the mean and standard deviation were calculated for all voxels inside myocardial masks combined over the three slices. The 2 AT-trig strategies (AT-trig peak and AT-trig valley) resulted in similar temporal stability distributions compared to ECG-triggered sequences.
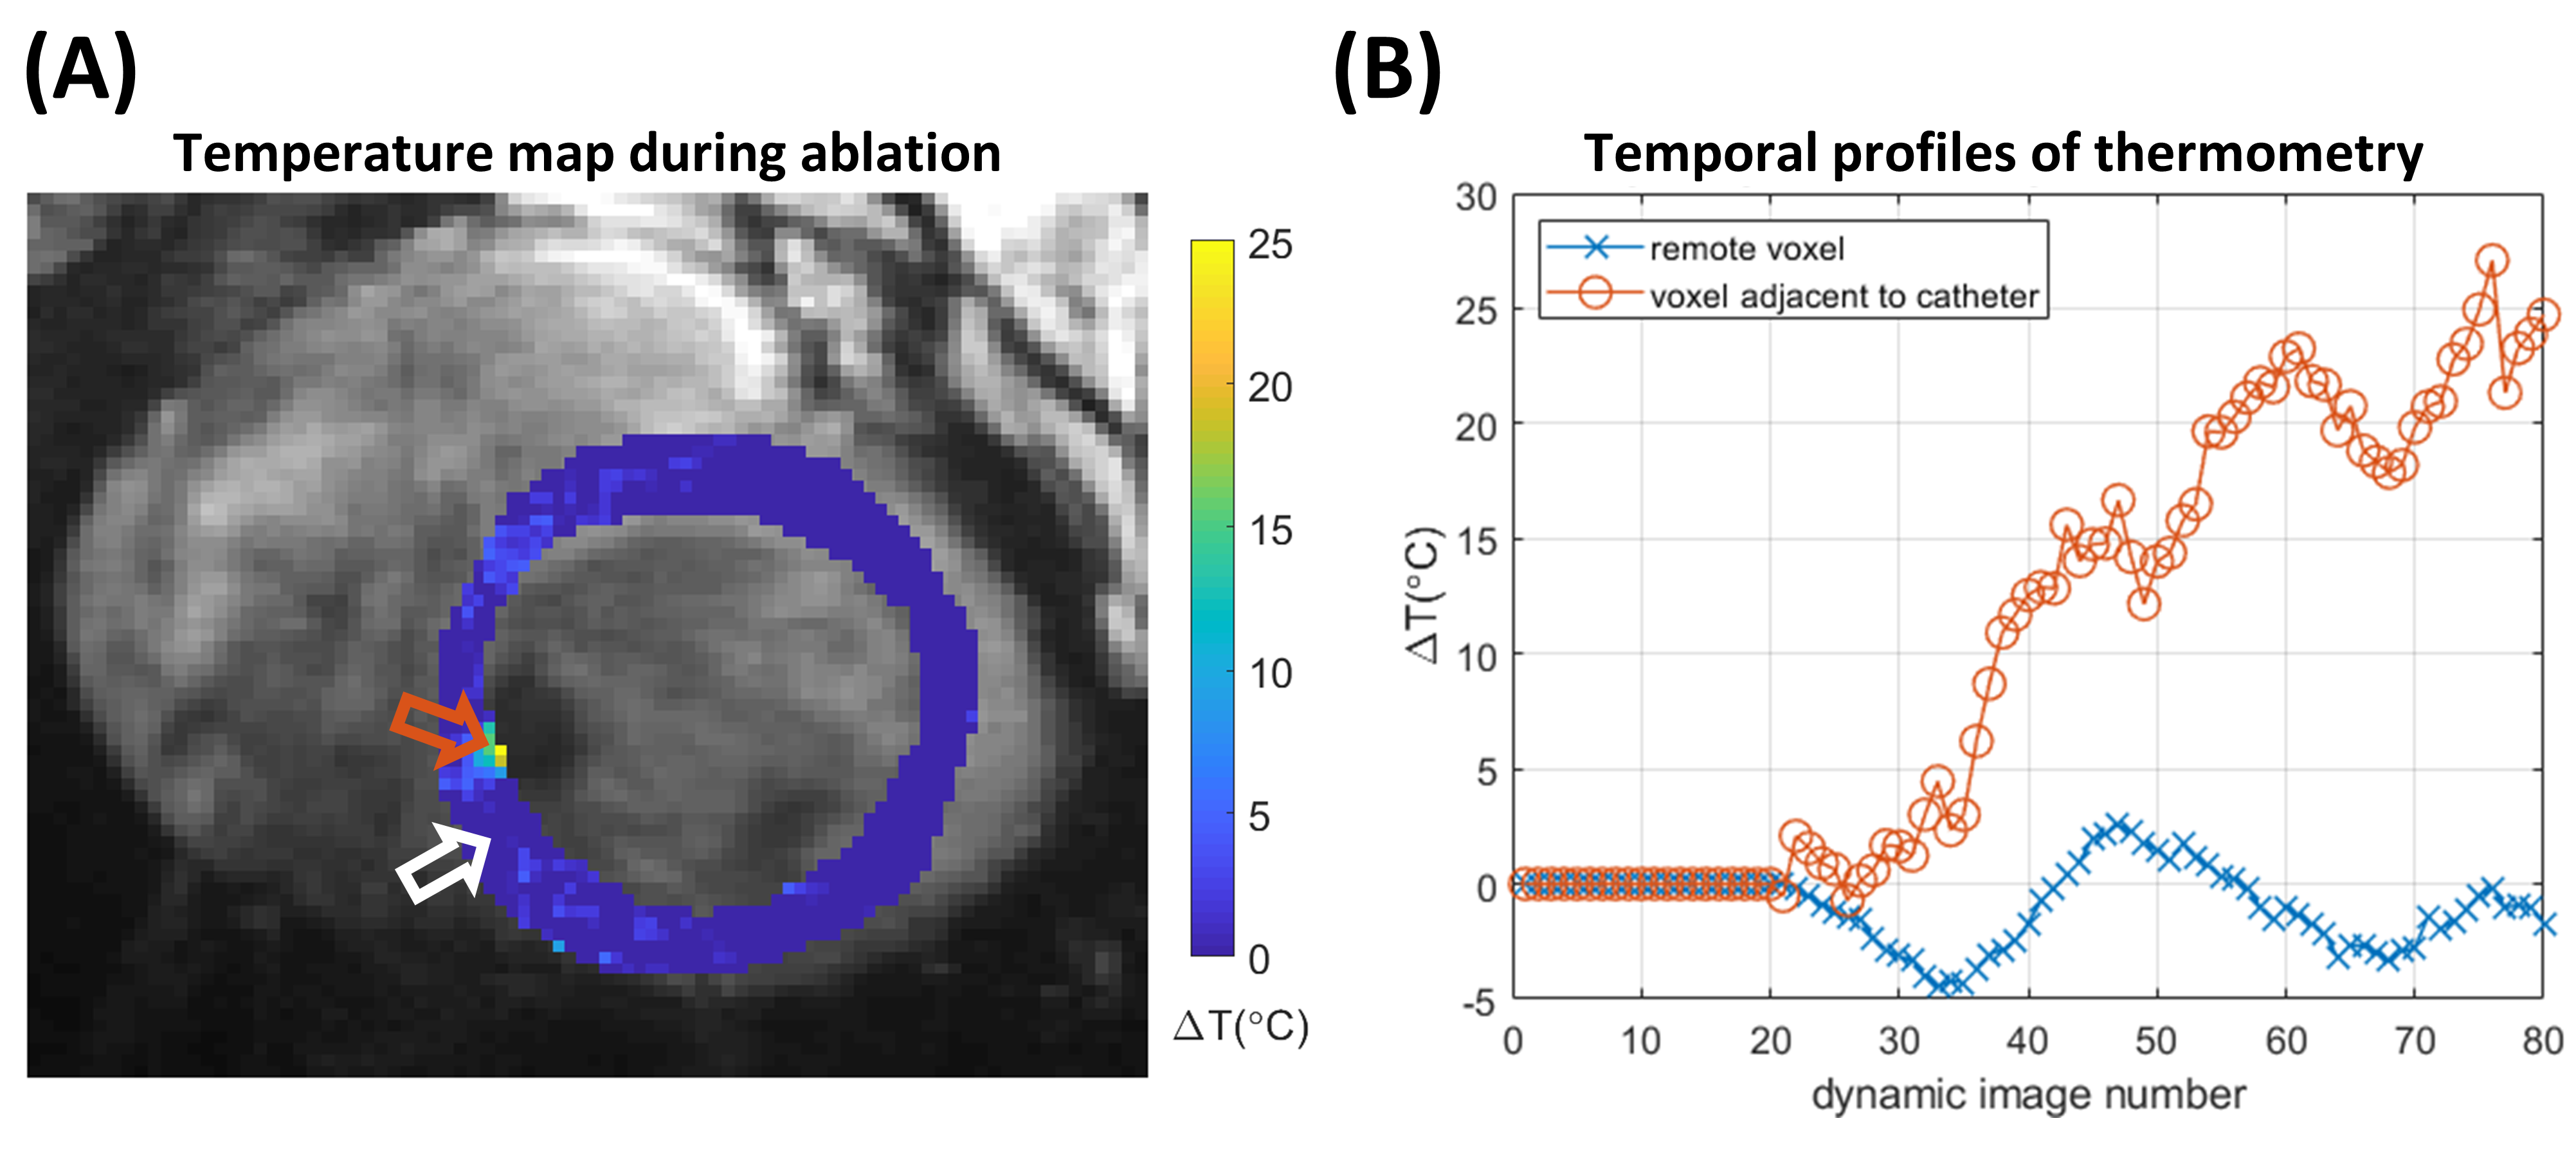
Figure 5. A) Temperature map acquired during ablation with AT-trig valley triggering in position 6, dynamic 63. Localized temperature rise is seen near the orange arrow, adjacent to the signal void caused by the presence of the catheter. B) Temporal profile of temperature changes in 2 voxels: a voxel remote from the catheter (white arrow in A) shows temperature measurements around 0°C while a voxel adjacent to the catheter (orange arrow in A) displays an elevated temperature during ablation.