1561
A comparison of oxygenation-sensitive cardiac MRI methods after hyperventilation1Utah Center for Advanced Imaging Research (UCAIR), University of Utah, Salt Lake City, UT, United States, 2Biomedical Engineering, University of Utah, Salt Lake City, UT, United States
Synopsis
Here we study SSFP-based OS-CMR and EPI-based T2*/T2 methods for detection of myocardial oxygenation changes. These techniques have been used previously, and OS-CMR has been investigated in many studies. However, quantifying T2* and T2 every heartbeat may add information to the semi-quantitative OS-CMR method. Here a limited study of subjects on a 3T scanner is performed. Preliminary quantitative results including comparisons between the methods are shown.
Introduction
Oxygenation-sensitive cardiac magnetic resonance (OS CMR) has become a promising technique in the last decade. OS-CMR capitalizes on the fact that deoxygenated hemoglobin in blood can act as an intrinsic contrast agent. The use of T2*-weighted images from readily available cine SSFP sequences have been used to reflect myocardial oxygenation in a number of areas such as sleep apnea 1 and myocardial ischemia 2. These works have used adenosine or breathing maneuvers such as hyperventilation to investigate the coronary vascular function. Hyperventilation and long breath-holds yield a detectable oxygenation responses with conventional semi-quantitative OS-CMR methods.Recent work has shown that an echo-planar method used in the brain can be adapted to quantify myocardial T2* and T2 each heartbeat (OS-EPI) 3. This was done at diastole during a long breath-hold and reported that T2 and T2* values increased as the BH continued in young controls. In subjects with high blood pressure, T2 and T2* values decreased. Here we make initial comparisons of the OS-CMR and OS-EPI methods using a hyperventilation and breath-holding protocol (post-HV).
Method
The OS-CMR sequence used a cine SSFP sequence similar to previous works (TR/TE=3.5/1.8msec, 1300 Hz/px bandwidth, 35° flip, 1.5x1.5x10mm3 voxels, 25 phases) 2. Hyperventilation was guided by a metronome at 80 ticks/minute and the volunteer breathed in or out with each tick for one minute. Cine SSFP was repeated approximately every 10 seconds for a total of 5 image sets over a 30-50s breath-hold. A healthy volunteer was imaged on a Siemens Prisma 3T scanner, and another volunteer on a Siemens Vida 3T scanner. To test repeatability, in the second subject, OS-CMR post-HV imaging was repeated a second time after a 5 minute recovery period. For all OS-CMR analyses, a region of interest was manually selected in the septal wall in end-systole frames.The gradient echo spin echo (GESE) OS-EPI sequence was patterned after 3. A 36 line echo-planar readout was used. The excited FOV was reduced using saturation bands such that the phase FOV could be reduced to 28% without image aliasing. Readout was 36 x 128, 320mm FOV, 7mm slice thickness, 1955Hz/px bandwidth. Fat saturation was used. Echo times of 15ms, 37.1ms, refocusing pulse at 50msec, 63.9ms, and 86ms were acquired with two image contrasts acquired before and two after the refocus pulse. Images were acquired at end-systole. Signal from a region of interest in the septal wall was fit to a model to quantify T2* and T2 values at each heartbeat, as in 3. The OS-EPI sequence was run post-HV on one subject, on a Siemens Prisma 3T scanner. OS-CMR was also performed twice on the same subject.
Results
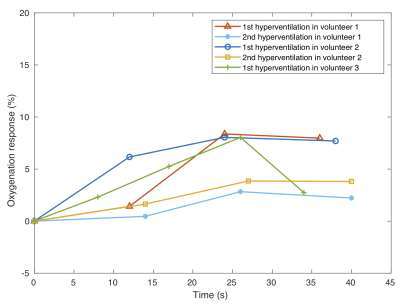
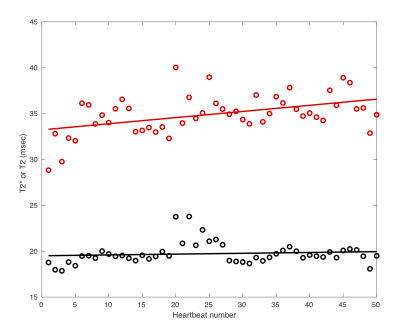
Figure 1 shows an example of the images acquired with each technique. The OS-EPI method loses signal quickly with the longer echo times, and susceptibility distortions can be seen away from the septal wall. Figure 2 shows the OS-CMR results in all three subjects. The first two subjects repeated the post-HV scans with both showing a reduced oxygen response after the second hyperventilation procedure. The OS-EPI results from one of the subjects in Fig. 2 (blue curve) is shown in Fig. 3. T2 changed during the post-HV method, with a slope for T2 of 0.07, while the T2* values were nearly constant, with a slope of 0.01 (.009). Rising T2 and T2* values were generally seen in normals, while decreasing T2 and T2start were observed in subjects with high blood pressure 3.Discussion/Limitations
The study focused on the septal region in a small number of subjects with an ongoing recruitment of subjects taking place. Initial results indicate that repeating hyperventilation relatively quickly (within 5 minutes) gives a smaller oxygenation change, even though the subjects felt completely recovered after 1 minute in these cases. It is likely that a longer wait time would give more repeatable post-HV results. In addition, parallel imaging could be utilized to reduce echo times and increase signal in OS-EPI to improve results3.Conclusion
After hyperventilation, quantifying T2 and T2* every heartbeat and T2*-weighted SSFP methods may be good approaches to detect oxygenation-related signal changes. The methods may be complementary for robustly determining myocardial oxygenation changes after breathing maneuvers.Acknowledgements
No acknowledgement found.References
[1] F. Roubille, K. Fischer, D. P. Guensch, J. C. Tardif, and M. G. Friedrich, "Impact of hyperventilation and apnea on myocardial oxygenation in patients with obstructive sleep apnea - An oxygenation-sensitive CMR study," J Cardiol, vol. 69, pp. 489-494, 2017.
[2] K. Fischer, K. Yamaji, S. Luescher, Y. Ueki, B. Jung, et al., "Feasibility of cardiovascular magnetic resonance to detect oxygenation deficits in patients with multi-vessel coronary artery disease triggered by breathing maneuvers," J Cardiovasc Magn Reson, vol. 20, p. 31, 2018.
[3] M. van den Boomen, M. K. Manhard, G. J. H. Snel, S. Han, K. E. Emblem, et al., "Blood Oxygen Level-Dependent MRI of the Myocardium with Multiecho Gradient-Echo Spin-Echo Imaging," Radiology, vol. 294, pp. 538-545, 2020.
Figures

Figure 1: Example images from OS-CMR and OS-EPI methods. Right side: signal intensity curves from yellow regions shown in images.

Figure 2: OS-CMR signal response during breath-hold post-HV. Signal change is relative to the first image acquired post-HV. The three volunteers have similar signal changes post-HV when done the first time. The second post-HV (done in two of the subjects) has a markedly lower response, though assumedly is more repeatable after a longer wait time.

Figure 3: T2* (black) and T2 (red) values each heartbeat during breath-hold post-HV. Both values slightly increase (the slope for the linear fit to T2 is 0.07, and the T2* values are nearly constant, with a slope of 0.01) as the vasoconstriction associated with HV changes to vasodilation associated with breath-holding.