1560
Comparison of Blip-Up and Blip-Down EPI Distortion Correction Methods for Cardiac Diffusion Tensor Imaging1Department of Radiology, Stanford University, Stanford, CA, United States, 2Division of Radiology, Veterans Administration Health Care System, Palo Alto, CA, United States, 3Department of Bioengineering, Stanford University, Stanford, CA, United States, 4CREATIS Laboratory, University of Lyon, Lyon, France, 5Department of Radiology, University Hospital Saint-Etienne, Saint-Etienne, France, 6Department of Electrical Engineering, Stanford University, Stanford, CA, United States, 7Cardiovascular Institute, Stanford University, Stanford, CA, United States
Synopsis
To maintain minimal scan times, cardiac Diffusion Tensor Imaging (cDTI) uses an echo-planar imaging (EPI) readout. Off-resonance, that causes geometric distortion in EPI, remains an obstacle that degrades image quality and can affect the underlying quantitative information. In cDTI, the lung/liver/heart interface amplifies the effect of geometric distortion. Distortion correction algorithms, such as TOPUP and DR-BUDDI, have proved to adequately correct distortion in neuroimaging, but limited work has been done for the heart. A first look at comparing these two correction strategies head-to-head was evaluated and resulting in TOPUP as a slightly better tool addressing distortion correction in the heart.
Introduction
Cardiac diffusion tensor imaging (cDTI) measures myocardial microstructural organization1-6 and is being evaluated as a biomarker for several cardiac conditions7. To maintain manageable clinical scan times, echo-planar imaging (EPI) is widely adopted due to its acquisition speed. EPI, however, is susceptible to geometric distortions caused by off-resonance8. In the heart, the liver/lung/heart interface are known locations of geometric distortion due to off-resonance differences between these tissues. Several techniques for correcting geometric distortion in cDTI are possible. One approach uses a high-resolution double-echo gradient echo sequence to acquire a B0 field map that is used to correct the distortion in the cDTI images9. A second approach acquires two acquisitions with opposite EPI phase encoding polarities to estimate a field map10 using TOPUP11. Another approach that uses opposing EPI polarities is DR-BUDDI12, which has shown to have improved and more reproducible results in neuro DTI13 applications. The objective of this work was to compare the effectiveness of DR-BUDDI and TOPUP distortion correction for blip-up and blip-down EPI acquisition, with comparison to traditional single-shot (single-polarity) EPI for cDTI.Methods
AcquisitionAfter obtaining informed consent, five volunteers were imaged using a 3T Skyra (Siemens, Erlangen, Germany) and a 32-channel chest and spine array coil at a mid-ventricular slice. Balanced steady-state free precession (bSSFP) images were acquired at mid-systolic cardiac phase to serve as a reference distortion-free image (resolution=1.0×1.0×8.0mm3). A breath-held, ECG-gated, spin-echo EPI cDTI sequence with symmetric first and second-order motion-compensated diffusion gradients6 was used to acquire blip-up (right-left) and blip-down (left-right) datasets (TE/TR=82ms/3×R-R intervals, BW=1776Hz/Px, resolution=2.0×2.0×8.0mm3, GRAPPA=2, Partial Fourier=6/8, b-values=[0,250s/mm2], six diffusion directions, and four averages).
Post-Processing
An overview of the entire post-processing pipeline can be seen in Figure 1. Blip-up and blip-down cDTI datasets underwent 2D rigid registration to normalize spatial-temporal shifts of the heart during the breath-held acquisitions. Two blip-up averages and two blip-down averages were retrospectively combined to make one complete blip-up/blip-down dataset with consistent scan time and signal-to-noise ratio relative to the other acquisitions. This complete blip-up/blip-down dataset was then distortion corrected using TOPUP (using the FSL package) and DR-BUDDI (using the TORTOISE package). Four sets of images were then compared:
1) blip-up (four repetitions);
2) blip-down (four repetitions);
3) TOPUP distortion corrected (two+two repetitions);
4) DR-BUDDI distortion corrected (two+two repetitions).
These four datasets were then separately averaged and subsequently denoised using a local PCA algorithm14,15. After post-processing, each dataset underwent DTI processing to calculate the diffusion tensors using the DIPY framework16.
Analysis
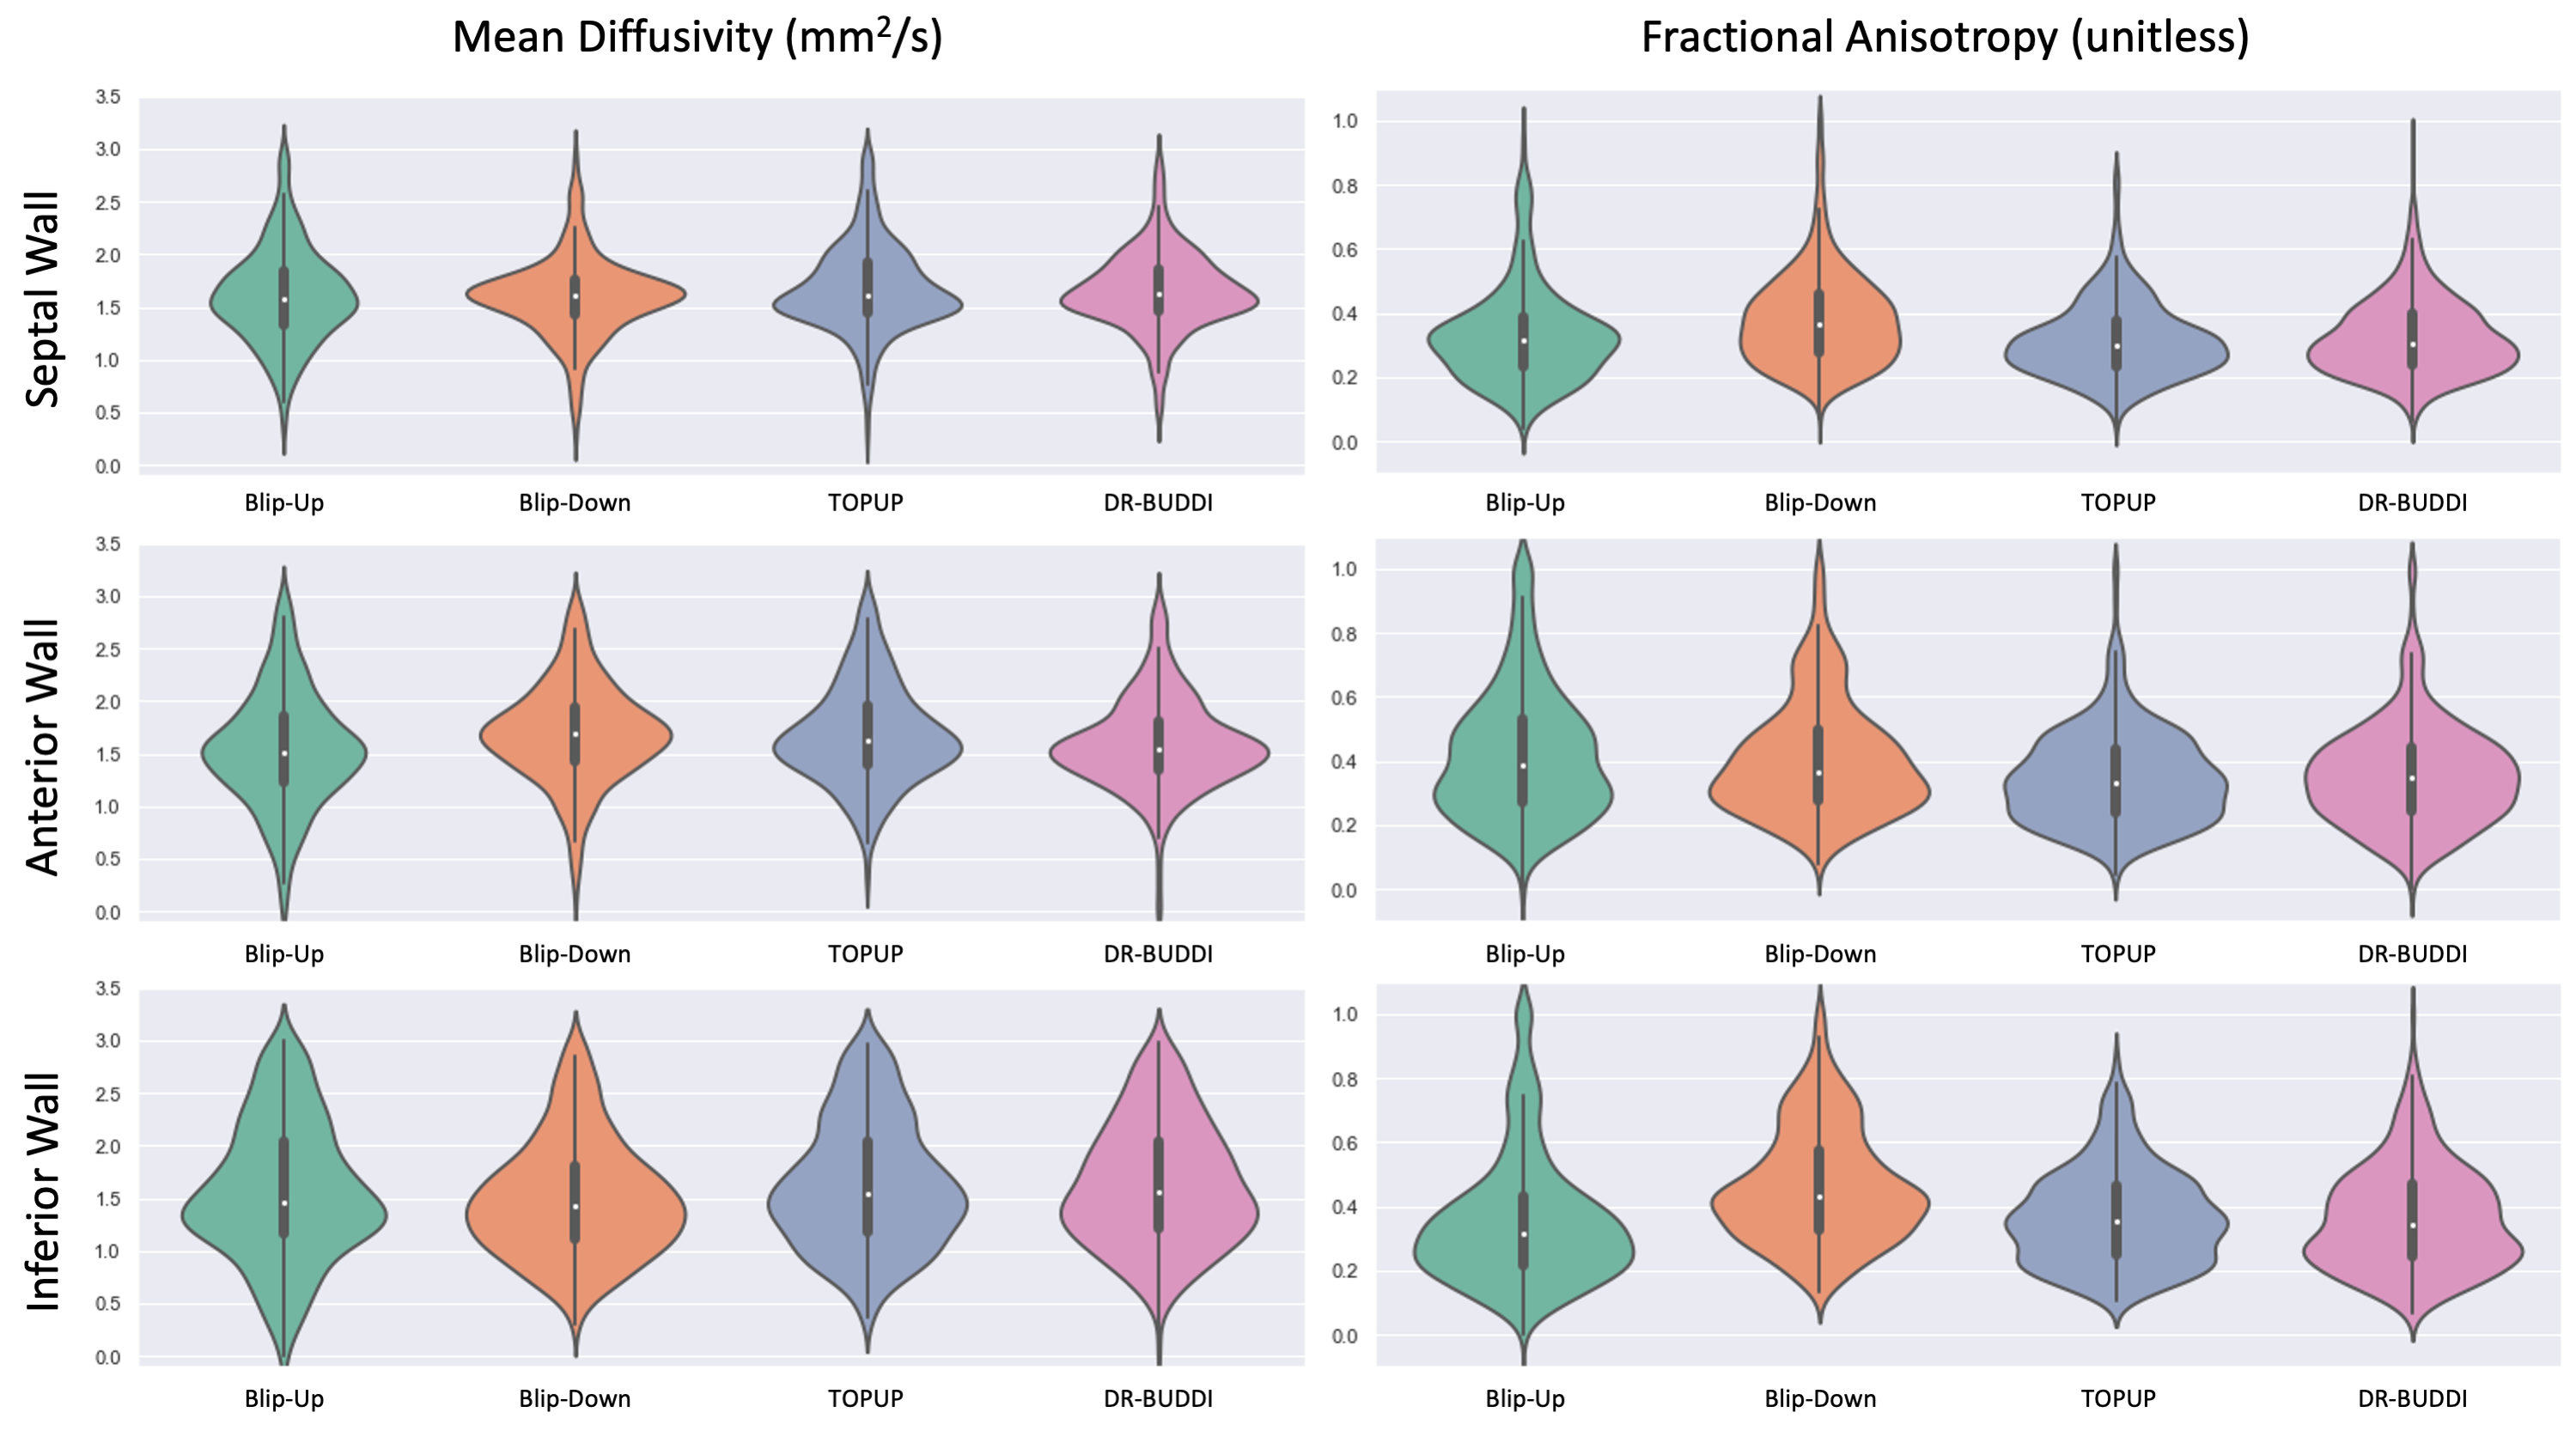
Geometric distortion and the LV myocardium mass percent error was computed using manual segmentations of the LV myocardium between the distortion-less reference bSSFP image and all four post-processed cDTI datasets (Table 1). Characterization of the geometric distortion was done by using the Dice similarity coefficient (DSC). Regional analysis using violin plots was performed on the four post-processed cDTI datasets for tensor derived metrics of mean diffusivity (MD) and fractional anisotropy (FA).
Results
As shown in Figure 2, DSCs calculated for all cDTI datasets with respect to the bSSFP reference image showed that blip-up, TOPUP, and DR-BUDDI were similar in mean DSCs (0.91, 0.89, and 0.87, respectively). TOPUP (-3.32±5.60) provides a slight underestimation of the LV mass compared to the reference image, while blip-up (9.66±10.45) overestimates and blip-down (-10.56±8.12) underestimates LV mass. DR-BUDDI provides a better estimate of LV compared to blip-up and blip-down but underestimates (-7.15±8.69) relative to TOPUP. In Figure 3, quantitative images of MD and FA are overlaid on the corresponding b=0s/mm2. The anterior wall (AW) for blip-up and inferior free wall (IW) for blip-down, show elevated FA values. Further investigation across all subjects is shown with violin plots in Figure 4 to investigate the AW, IW, and septal wall (SW). Differences in median and overall distribution were relatively similar for all three regions when comparing MD. However, overall distributions patterns observed for blip-down in the SW and IW are inconsistent with the other datasets. Additionally, overall distributions patterns observed for blip-up in the AW deviate from the other datasets.Discussion / Conclusion
DR-BUDDI and TOPUP are effective ways to mitigate image distortion in cDTI based on the observed results. The overestimation of LV mass for blip-up (Table 1) provides a potentially misleading result with a high DSC. In areas that are susceptible to geometric distortion, AW for blip-up and IW for blip-down, inaccurate quantification of the diffusion tensor invariants (MD, FA) is a concern when trying to use cDTI as a diagnostic tool. Both DR-BUDDI and TOPUP provide improvement in these areas and were in agreement in their distribution patterns and medians at the IW, AW, and SW. Additionally, TOPUP and DR-BUDDI were shown to provide accurate and more reliable geometries when compared to a traditional single-polarity cDTI EPI acquisition in the heart. Under a fixed amount of scan time, the more accurate estimate of LV boundaries and myocardial mass after the distortion correction is an improvement relative to single-polarity EPI acquisitions. When deciding which distortion correction method to use based on these findings, TOPUP has a slight edge over DR-BUDDI. Future work includes analyzing the helix angle, sheetlet angle, and transverse angle to provide a more quantitative analysis of the impact of these two distortion correction methods.Acknowledgements
We would like to acknowledge NIH R01 HL131823 to DBE as the funding source that is supporting this ongoing work.References
1. Aliotta E, Wu HH, & Ennis DB. Convex optimized diffusion encoding (CODE) gradient waveforms for minimum echo time and bulk motion–compensated diffusion‐weighted MRI. Magnetic Resonance in Medicine, 2016;77(2), 717–729.2. Moulin K, Verzhbinsky IA, Maforo NG, Perotti LE, & Ennis DB. Probing cardiomyocyte mobility with multi-phase cardiac diffusion tensor MRI. PLOS ONE, 2020;15(11).
3. Nielles-Vallespin S, Khalique Z, Ferreira PF, de Silva R, Scott AD, Kilner P, McGill, LA, Giannakidis A, Gatehouse PD, Ennis DB, Aliotta E, Al-Khalil M, Kellman P, Mazilu D, Balaban RS, Firmin DN, Arai A E, & Pennell DJ. Assessment of myocardial microstructural dynamics by in vivo diffusion tensor cardiac magnetic resonance. Journal of the American College of Cardiology, 2017;69(6), 661–676.
4. Nguyen C, Fan Z, Xie Y, Pang J, Speier P, Bi X, Kobashigawa J, & Li D. In vivo diffusion-tensor MRI of the human heart on a 3 tesla clinical scanner: An optimized second order (m2) motion compensated diffusion-preparation approach. Magnetic Resonance in Medicine, 2016;76(5), 1354–1363.
5. Scott AD, Nielles-Vallespin S, Ferreira PF, Khalique Z, Gatehouse PD, Kilner P, Pennell DJ, & Firmin DN. An in-vivo comparison of stimulated-echo and motion compensated spin-echo sequences for 3 T diffusion tensor cardiovascular magnetic resonance at multiple cardiac phases. Journal of Cardiovascular Magnetic Resonance, 2018;20(1).
6. Stoeck, CT, von Deuster C, Genet M, Atkinson D, & Kozerke S. Second-order motion-compensated spin echo diffusion tensor imaging of the human heart. Magnetic Resonance in Medicine, 2015;75(4), 1669–1676.
7. Nielles‐Vallespin S, Scott A, Ferreira P, Khalique Z, Pennell D, & Firmin D. Cardiac diffusion: Technique and practical applications. Journal of Magnetic Resonance Imaging, 2019;52(2), 348–368.
8. Jezzard P, & Balaban RS. Correction for geometric distortion in echo planar images from B0 field variations. Magnetic Resonance in Medicine, 1995;34(1), 65–73.
9. Gorkum RJ, Deuster C, Guenthner C, Stoeck CT, & Kozerke S. Analysis and correction of off‐resonance artifacts in echo‐planar cardiac diffusion tensor imaging. Magnetic Resonance in Medicine, 2020;84(5), 2561–2576.
10. Coll‐Font J, Chen S, Eder R, Fang Y, Han QJ, Boomen M, Sosnovik DE, Mekkaoui C, & Nguyen CT. Manifold‐based respiratory phase estimation enables motion and distortion correction of free‐breathing cardiac diffusion tensor MRI. Magnetic Resonance in Medicine, 2021.
11. Andersson JLR, Skare S, & Ashburner J. How to correct susceptibility distortions in spin-echo echo-planar images: Application to diffusion tensor imaging. NeuroImage, 2003;20(2), 870–888.
12. Irfanoglu MO, Modi P, Nayak A, Hutchinson EB, Sarlls J, & Pierpaoli C. DR-Buddi (diffeomorphic registration for blip-up blip-down Diffusion Imaging) method for correcting echo Planar Imaging distortions. NeuroImage, 2015;106, 284–299.
13. Irfanoglu MO, Sadeghi N, Sarlls J, & Pierpaoli C. Improved reproducibility of diffusion MRI of the human brain with a four‐way blip‐up and down phase‐encoding acquisition approach. Magnetic Resonance in Medicine, 2020;85(5), 2696–2708.
14. Manjón JV, Coupé P, Concha L, Buades A, Collins, DL, & Robles M. Diffusion weighted image denoising using overcomplete local PCA. PLoS ONE, 2013;8(9).
15. Xu X, Liu S, Guo M, Zhu Y, Chen R, & Yang Y. Comparison of three denoising methods for cardiac diffusion tensor imaging. 2020 5th International Conference on Mechanical, Control and Computer Engineering (ICMCCE).
16. Garyfallidis E, Brett M, Amirbekian B, Rokem A, van der Walt S, Descoteaux M, & Nimmo-Smith I. (2014). Dipy, a library for the analysis of diffusion MRI Data. Frontiers in Neuroinformatics, 2014;8.
Figures
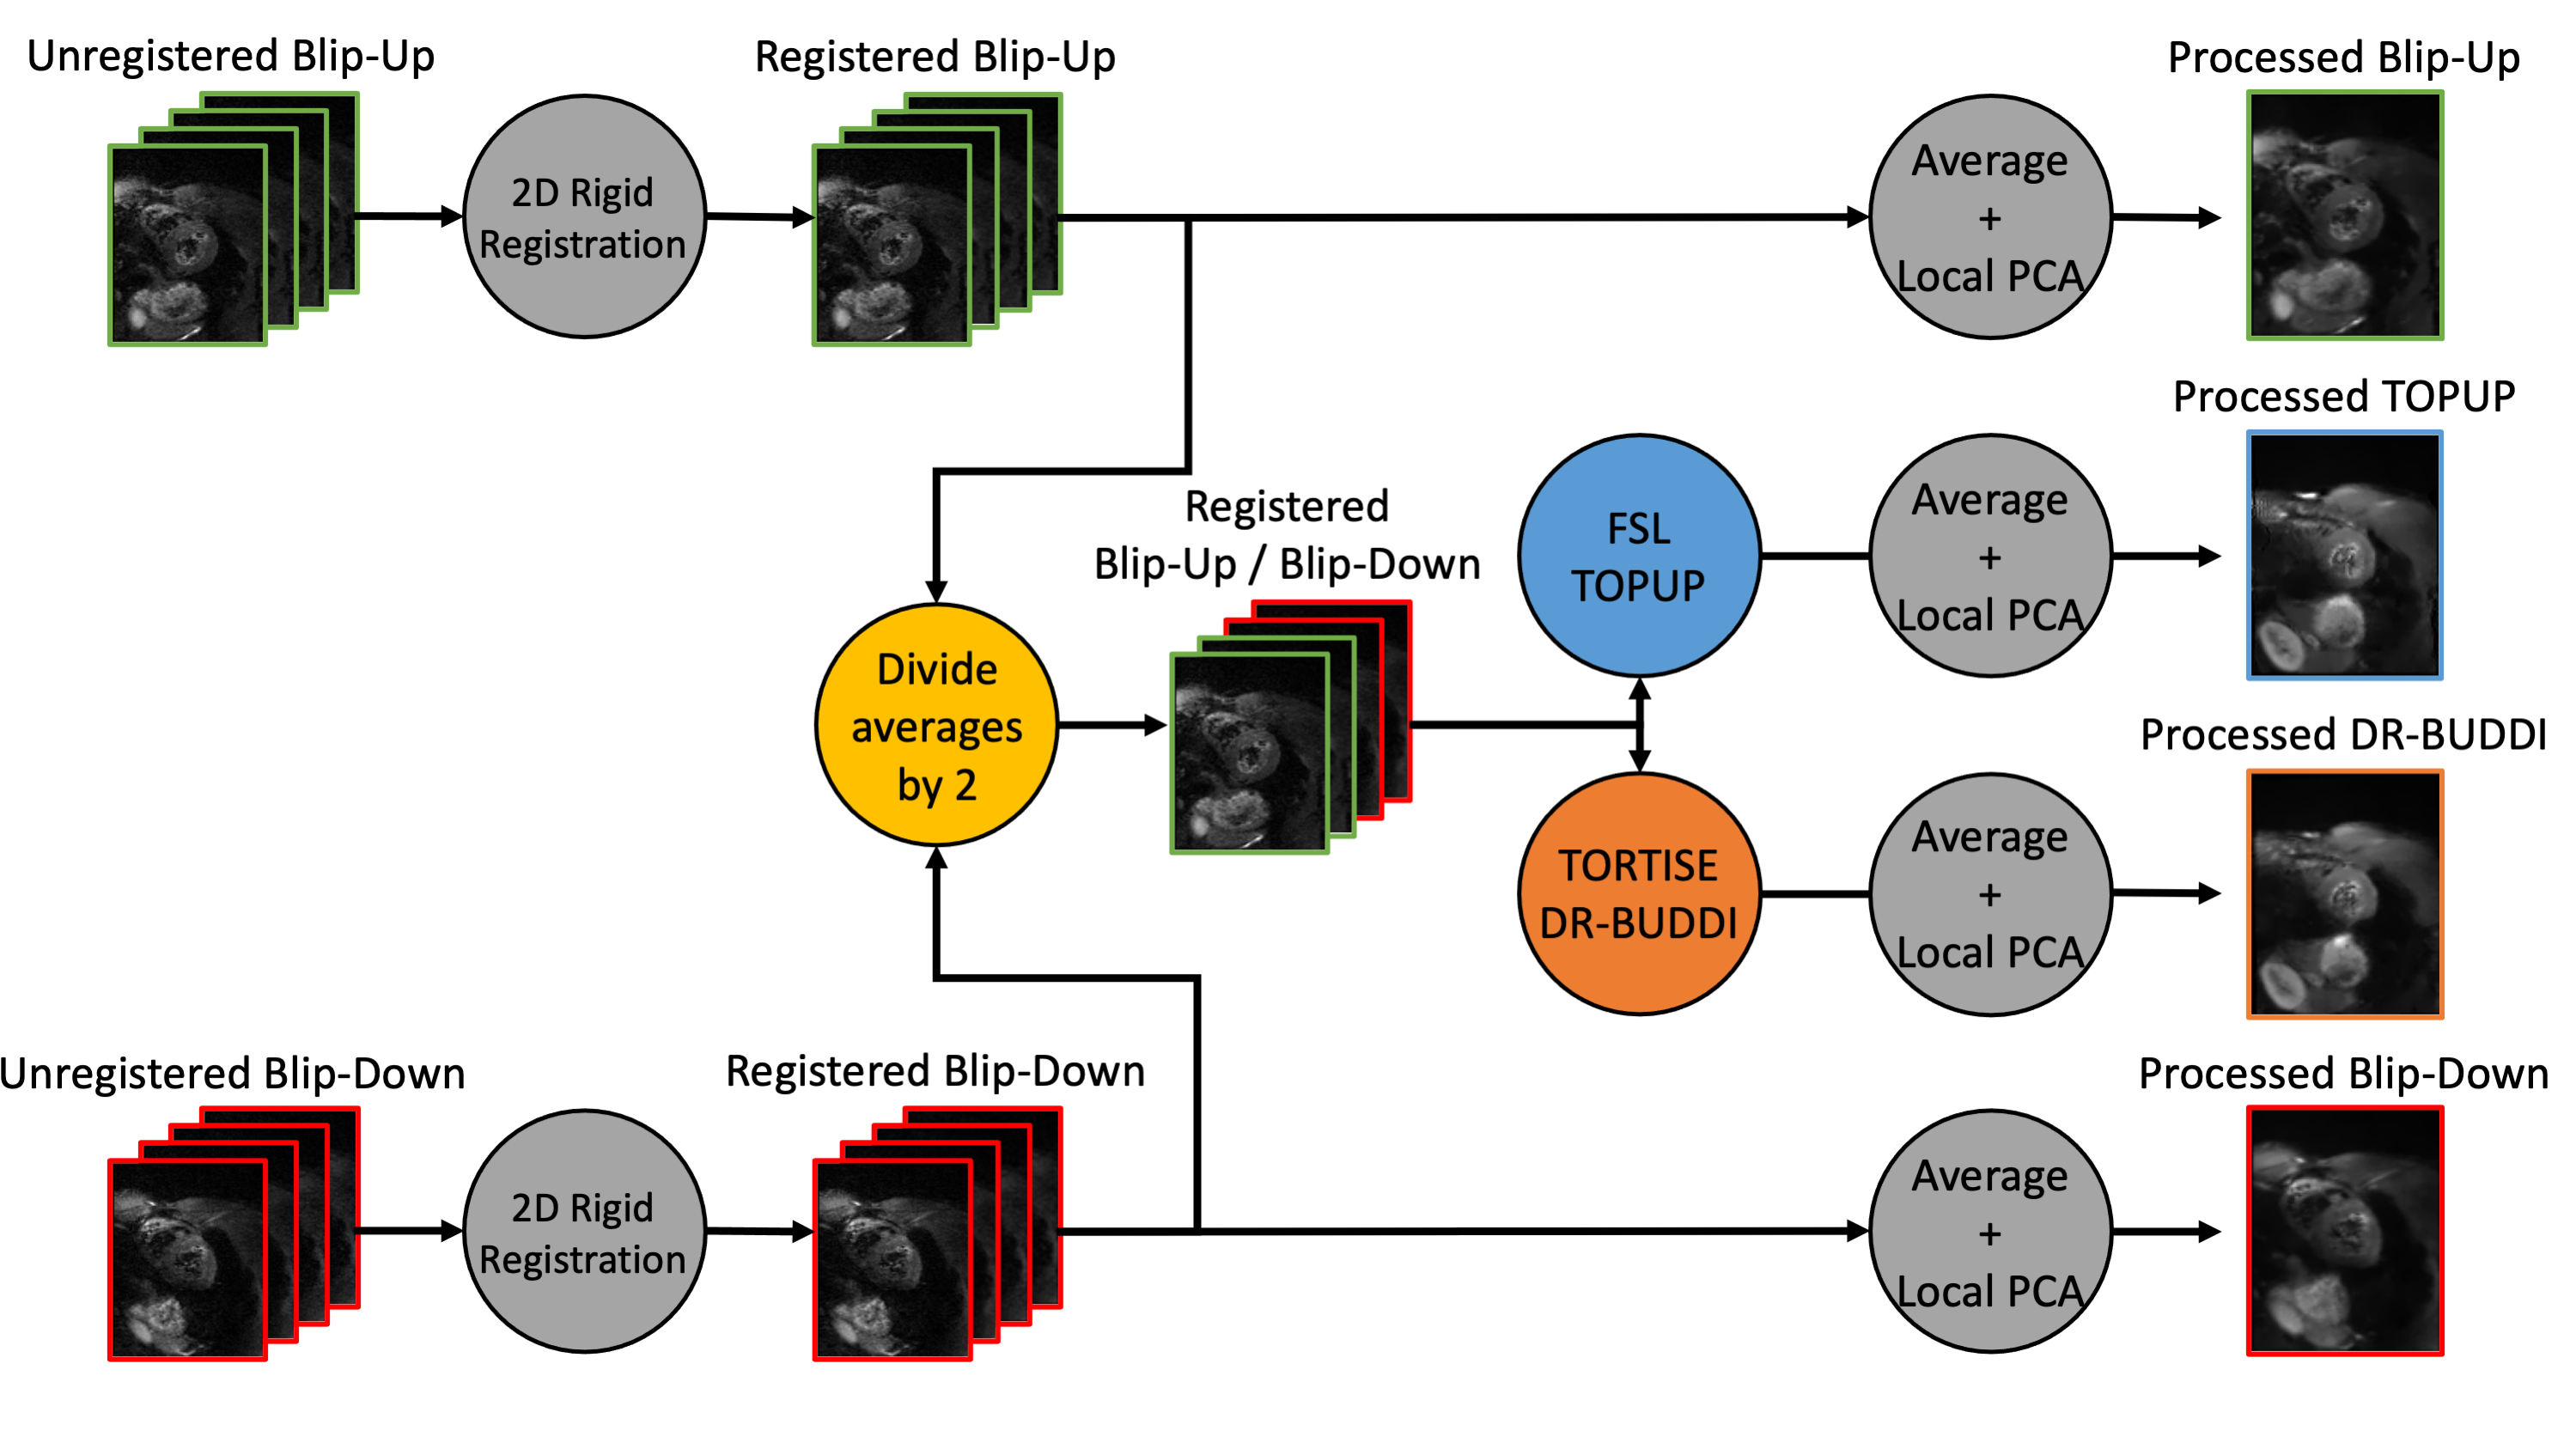
Figure 1. An overview of the cDTI post-processing pipeline. Blip-up and blip-down cDTI datasets are first registered using a 2D rigid registration. From there, half of the blip-up averages and half of the blip-down averages are combined into one blip-up/blip-down dataset. This blip-up/blip-down dataset is then separately run through TOPUP and DR-BUDDI to provide two unique distortion corrections. The four unique datasets: blip-up, blip-down, TOPUP corrected, and DR-BUDDI corrected all undergo averaging and the same local PCA denoising algorithm prior to the DTI reconstruction.
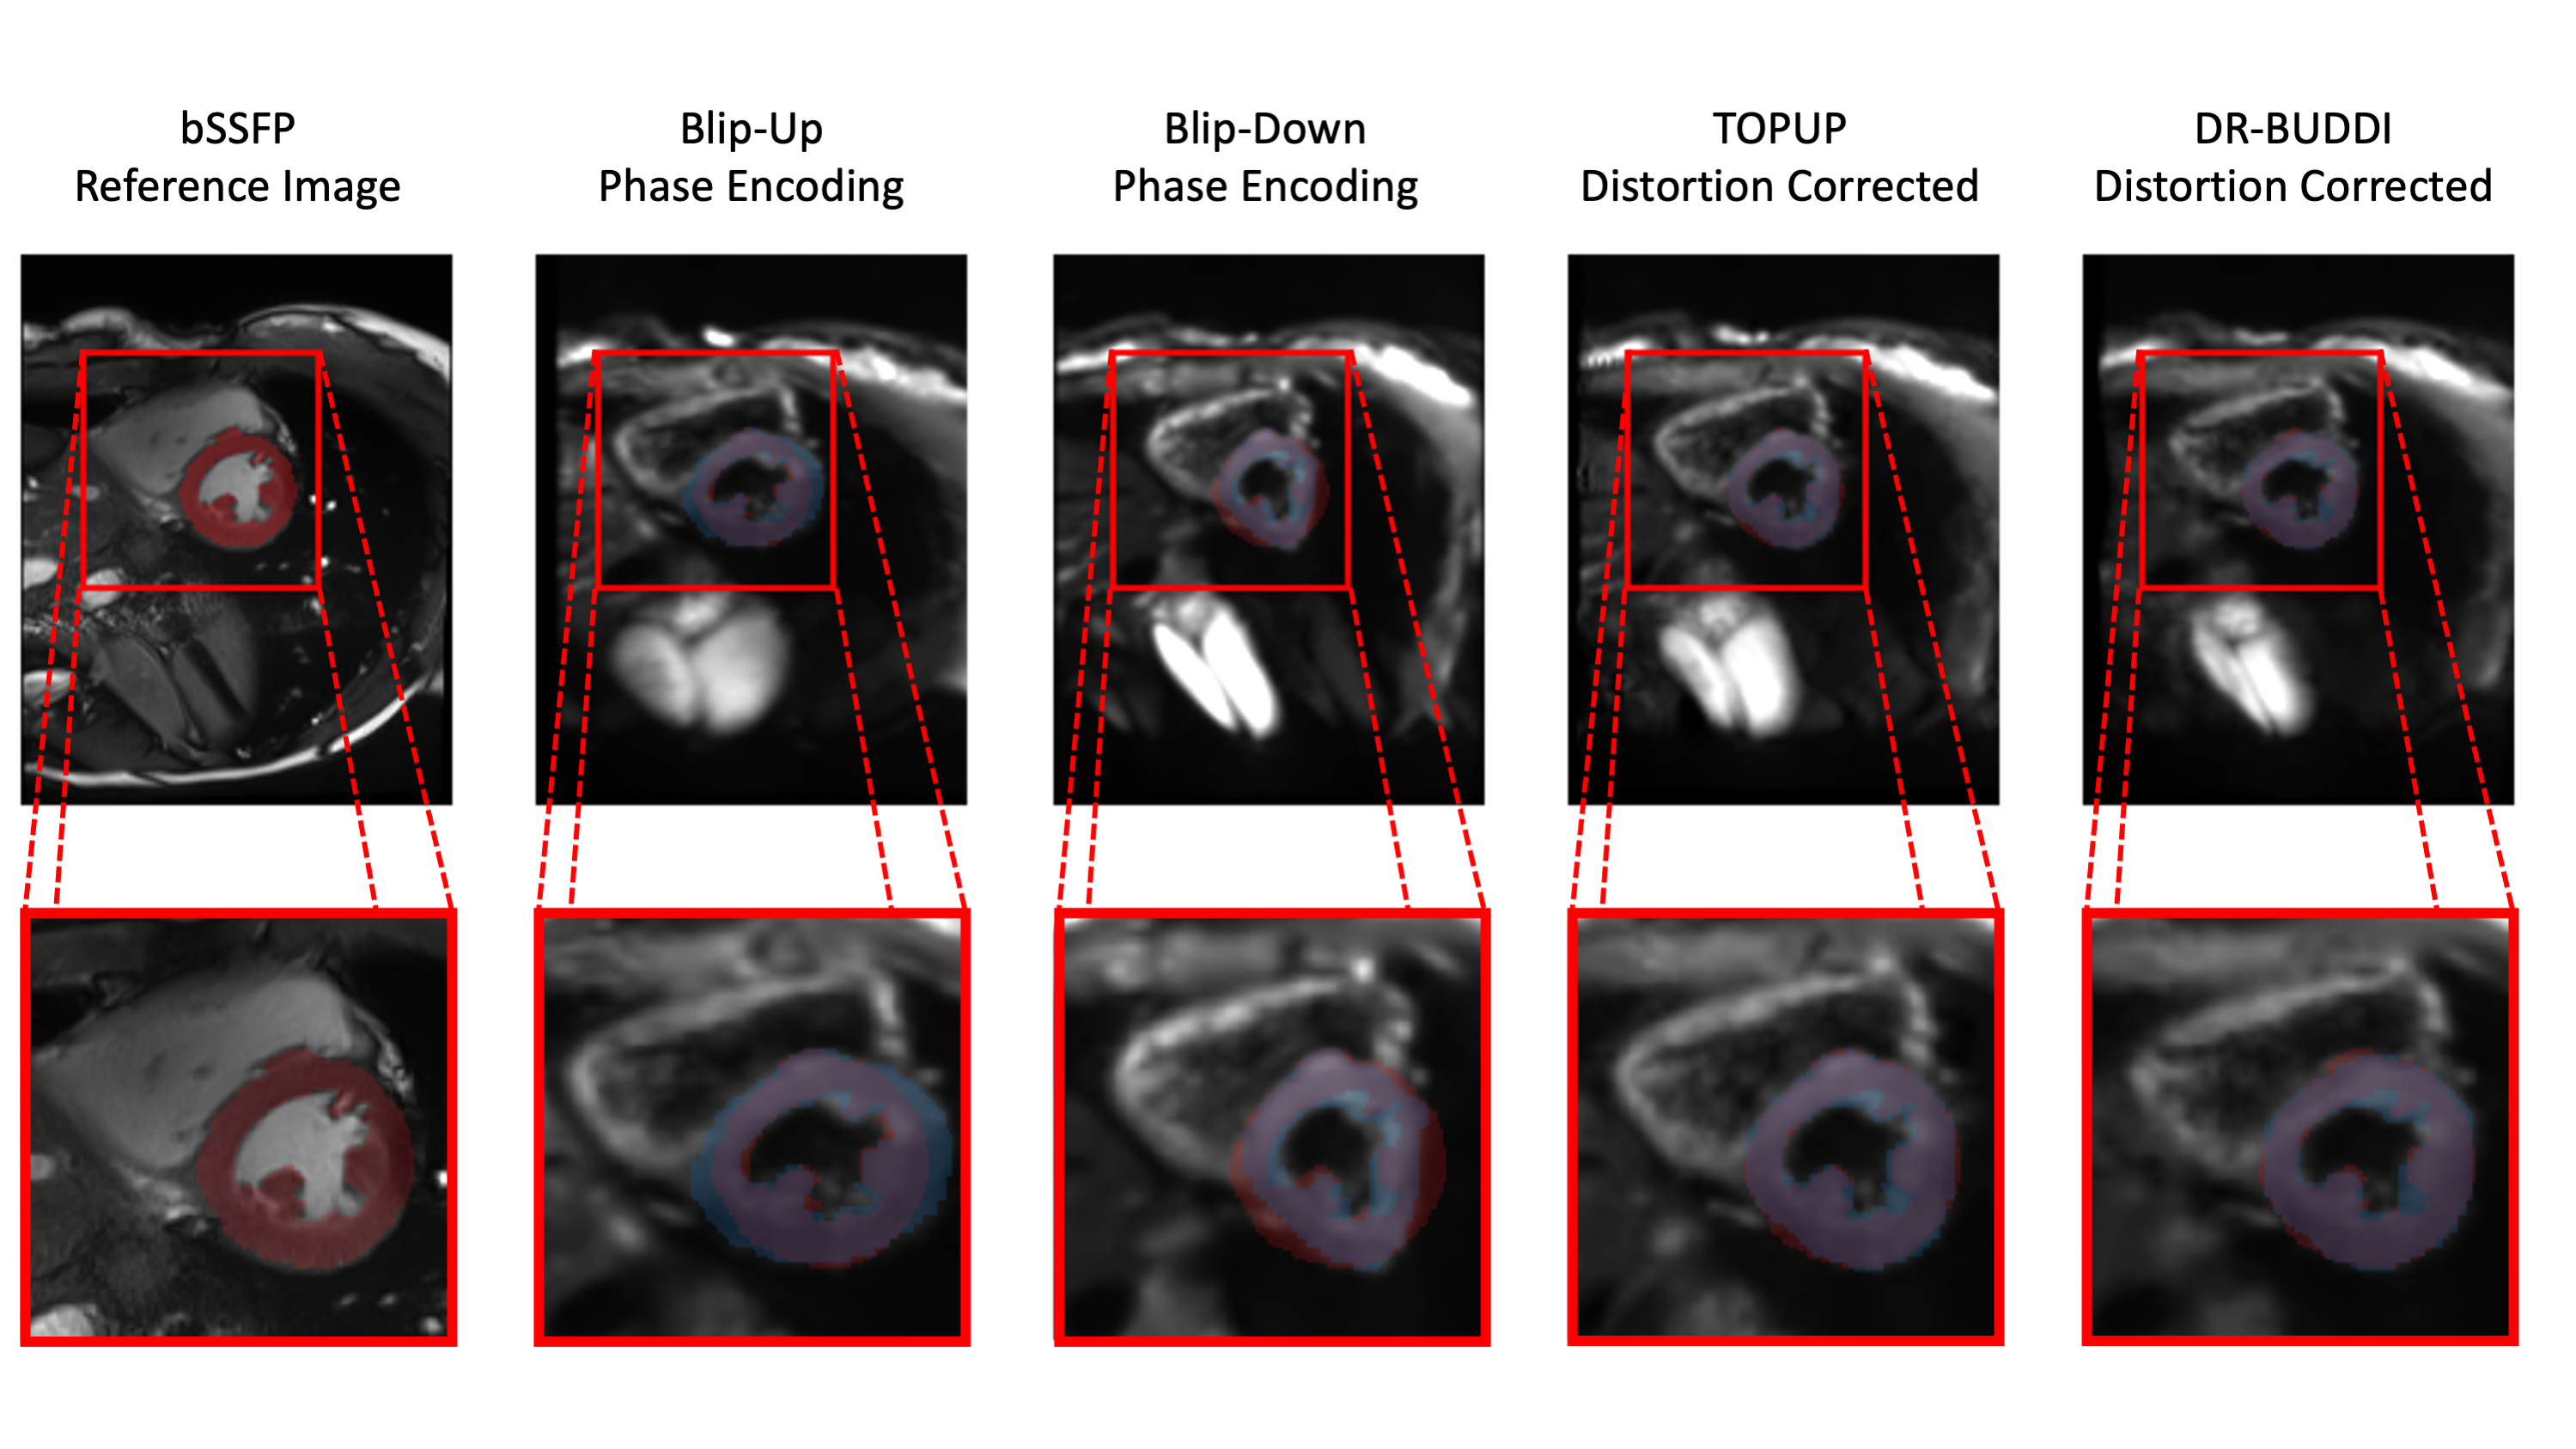
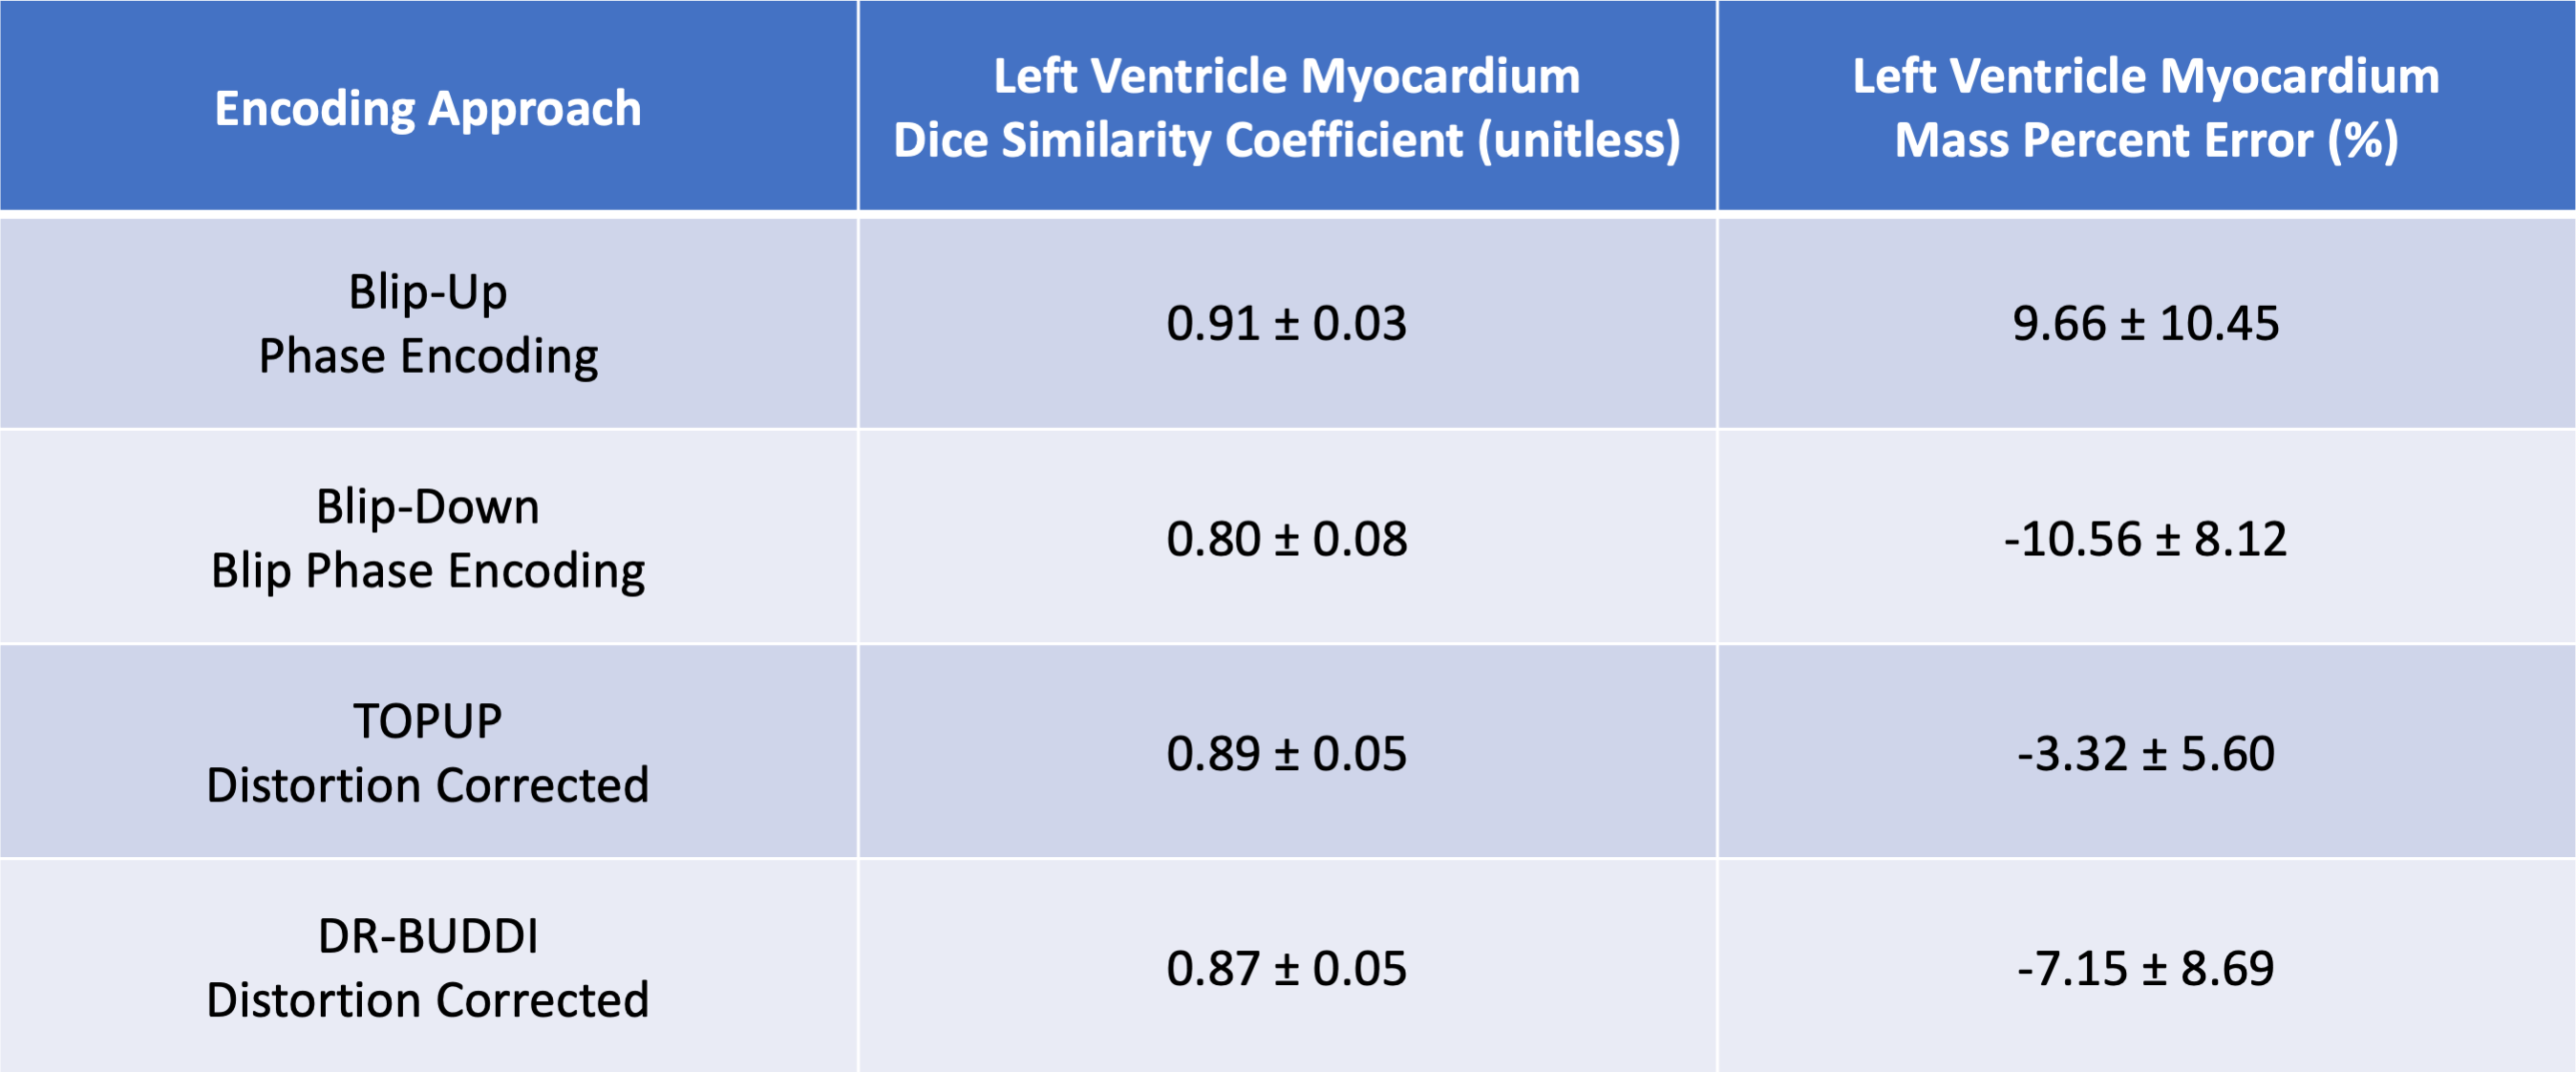
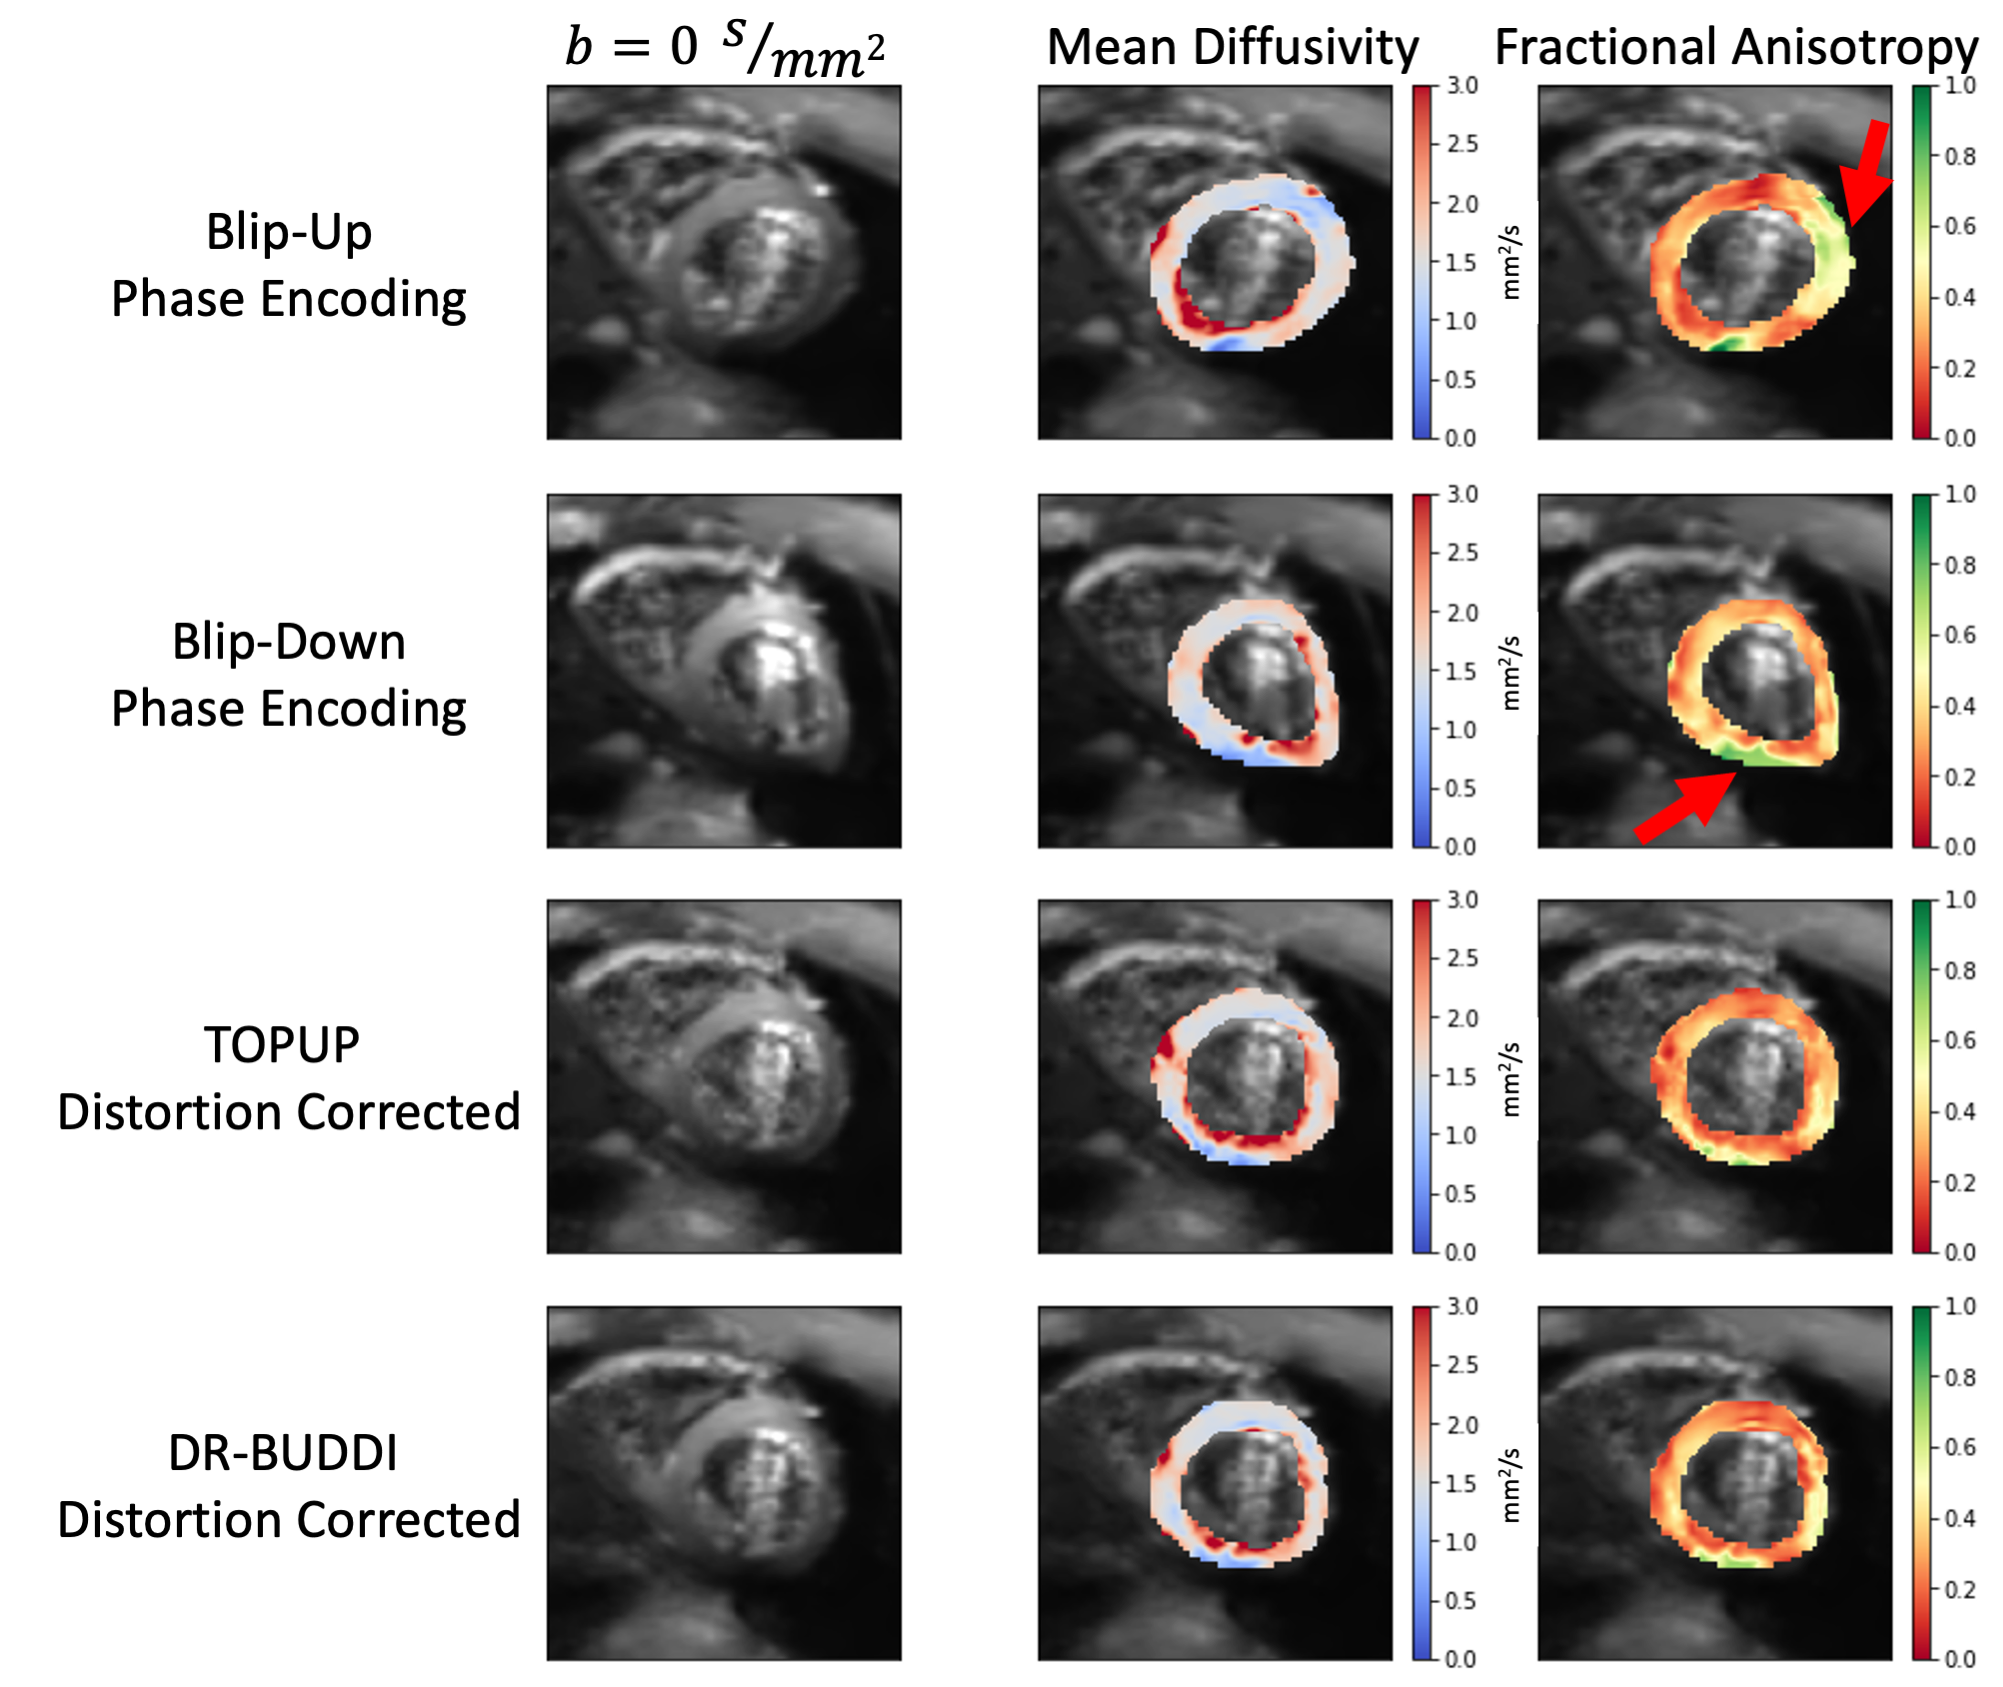
Figure 3. An overview of cardiac Diffusion Tensor (cDTI) b=0 s/mm2 images, mean diffusivity, and fractional anisotropy (FA) for one volunteer at a mid-ventricular slice. Each row displays one of the four unique datasets that were a result of the cDTI post-processing pipeline. Blip-up FA maps show elevated values near the anterior wall (red arrow), while blip-down FA maps show elevated values near the inferior wall (red arrow). TOPUP and DR-BUDDI distortion corrections have more uniform FA values in both these regions while providing a more accurate representation of cardiac geometry.