1558
Investigating the clinical viability of a control system-based slice-following sequence for free-breathing cardiovascular DTI1Division of Biomedical Engineering, Department of Human Biology, University of Cape Town, Cape Town, South Africa, 2Cape Universities Body Imaging Centre (CUBIC), University of Cape Town, Cape Town, South Africa, 3Oxford Centre for Magnetic Resonance Research (OCMR), Radcliffe Department of Medicine, University of Oxford, Oxford, United Kingdom, 4Department of Medicine, University of Cape Town, Cape Town, South Africa
Synopsis
A prospective respiratory motion correction control system, capable of slice-following, was tested on a 3 T clinical MRI scanner. The performance of the control system was compared against the most common respiratory motion compensation technique, namely multiple breath-holds. Both techniques produced similarly consistent results. The control system technique was able to reduce the acquisition time by acquiring data with 100% respiratory efficiency
Introduction
Cardiovascular diffusion tensor imaging (cDTI) has emerged as a technique for investigating the micro-architecture and orientation of the myocardium1. Its clinical utility has been somewhat impeded by long scan times and the common practice of performing cDTI under breath-hold (BH) conditions. To improve the clinical utility of cDTI, a control system (CS) was implemented in a free breathing cDTI sequence to perform in vivo slice tracking with 100% respiratory efficiency2. The sequence was tested on a clinical MRI scanner with standard gradients (45mT/m).Methods
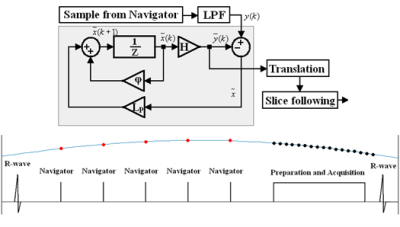
Briefly, the CS method uses a series of 90°-180° crossed-pair navigators to repeatedly measure the position of the diaphragm during non-imaging segments. This is used as an input to a control system, which then predicts the diaphragm position and prospectively corrects the slice position during imaging segments (Figure 1). The slice position is computed assuming a linear factor between diaphragm and heart displacement3.Six healthy volunteers underwent cDTI using a 3 T Skyra (Siemens, Erlangen, Germany). Subjects were scanned using an ECG-gated second-order motion compensated spin echo (M2SE) sequence with two different respiratory motion compensation techniques – multiple BH and free breathing (FB) using the CS. For both techniques, diffusion weighted images (DWI) were acquired using b-values of 50 and 450s/mm2 with 12 diffusion directions and 5 repetitions. The order in which the FB and BH scans, and b-values, were acquired was randomised for each subject. Scan parameters: TR/TE – 1 R-R/86ms; matrix size – 136x50; pixel size – 2.57x2.57mm2 (interpolated: 1.29x1.29mm2); slice thickness – 8mm; bandwidth – 2298Hz/pixel; GRAPPA – 2. Cine imaging was used to position three short axis slices in the basal, mid, and apical regions of the heart and optimise the trigger delay to acquire the DWI in late systole.
All image analysis and diffusion tensor calculations were computed offline using a set of in-house MATLAB tools4 (Mathworks, Natick, USA). Image registration using affine transformations, heart-rate correction, and repetition averaging were performed. The mean diffusivity (MD), fractional anisotropy (FA), helix angle (HA), and secondary eigenvector angle (E2A) were calculated voxelwise from the diffusion tensor for the entire myocardium. All statistical analyses were performed with SPSS v27 using a multifactor ANOVA corrected for repeated measurements.
Results
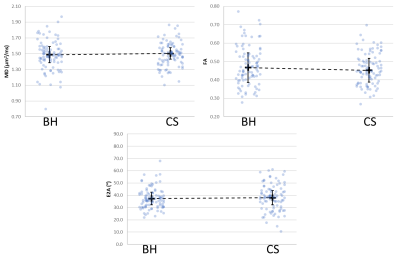
Each set of 12 DWIs were collected in single breath-hold acquisitions of approximately 15 seconds for a total of 30 breath-holds, approximately 20 minutes including short breaks between scans. For the CS, all DWIs were collected in one continuous scan per slice under free-breathing conditions and completed in approximately 15 minutes including pre-training time3.There were no significant differences found between the two respiratory motion compensation techniques for MD, FA, E2A, or HA (Figures 2 and 3).
Discussion and Conclusion
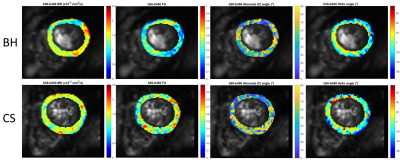
The M2SE cDTI sequence was implemented on a 3 T clinical scanner using a prospective motion correction control system.The results of the diffusion parameters were similar to previously published results. The BH and CS techniques produced very similar results with no significant differences (Figure 4).
These results show that the prospective respiratory motion correction control system technique can play a part in improving the clinical viability of cDTI, allowing for the reduction of exam times, enabling long exams to be performed under free-breathing conditions, as well as opening the door to performing multi-slice acquisitions and increasing the number of diffusion directions.
Acknowledgements
NRF/RCUK Newton Fund collaboration between the University of Oxford and the University of Cape Town
NRF/DST South African Research Chairs Initiative
E.M. Tunnicliffe is funded by the NIHR Oxford Biomedical Research Centre
References
1. Mekkaoui, C., Reese, T. G., et al. (2017). Diffusion MRI in the heart. NMR in Biomedicine, 30(3).
2. Jermy, S. G., Hess, A. T., et al. (2019). Towards robust free-breathing cardiac DTI. Proceedings of the ISMRM, 27, p.228.
3. Burger, I. H., Keegan, J., et al. (2010). Prospective diaphragm position prediction for Cardiac MR using multiple navigators. Proceedings of the ISMRM, 18, p.5013.
4. Tunnicliffe, E. M., Scott, A. D., et al. (2014). Intercentre reproducibility of cardiac apparent diffusion coefficient and fractional anisotropy in healthy volunteers. Journal of Cardiovascular Magnetic Resonance, 16(1), 1–12.
Figures


