1553
Adapting and applying the brain age paradigm for clinical imaging in multiple sclerosis (MS)1Centre for Medical Image Computing, University College London, London, United Kingdom, 2Queen Square Multiple Sclerosis Centre, Department of Neuroinflammation, UCL Queen Square Institute of Neurology, London, United Kingdom, 3Medizinische Hochschule Hannover, Hannover, Germany, 4Movement Disorders, Neurostimulation and Neuroimaging, University Medicine Mainz, Mainz, Germany, 5Departments of Advanced Biomedical Sciences and Electrical Engineering and Information Technology, University of Naples "Federico II", Naples, Italy, 6Department of Neurology, Oslo University Hospital, Oslo, Norway, 7Department of Psychology, University of Oslo, Oslo, Norway, 8Nuffield Department of Clinical Neurosciences, Medical Sciences Division, University of Oxford, Oxford, United Kingdom, 9Department of Medicine, Surgery and Neuroscience, University of Siena, Siena, Italy, 10Hospital Universitari Vall d’Hebron, Barcelona, Spain, 11Neuroimaging Research Unit, Department of Neurology, Medical University of Graz, Graz, Austria, 12Neuroimaging Research Unit, Division of Neuroscience, IRCCS San Raffaele Scientific Institute, Vita-Salute San Raffaele University, Milan, Italy, 13Neurology Unit, Neurorehabilitation Unit, Neurophysiology Service, and Neuroimaging Research Unit, Division of Neuroscience, IRCCS San Raffaele Scientific Institute, Vita-Salute San Raffaele University, Milan, Italy, 14Lysholm Department of Neuroradiology, UCLH National Hospital for Neurology and Neurosurgery, London, United Kingdom, 15Neuroradiological Academic Unit, 15. Neuroradiological Academic Unit, London, United Kingdom, 16E-Health Center, Universitat Oberta de Catalunya, Barcelona, Spain, 17Department of Radiology and Nuclear Medicine, VU Medical Centre, Amsterdam, Netherlands, 18Dementia Research Centre, UCL Queen Square Institute of Neurology, London, United Kingdom
Synopsis
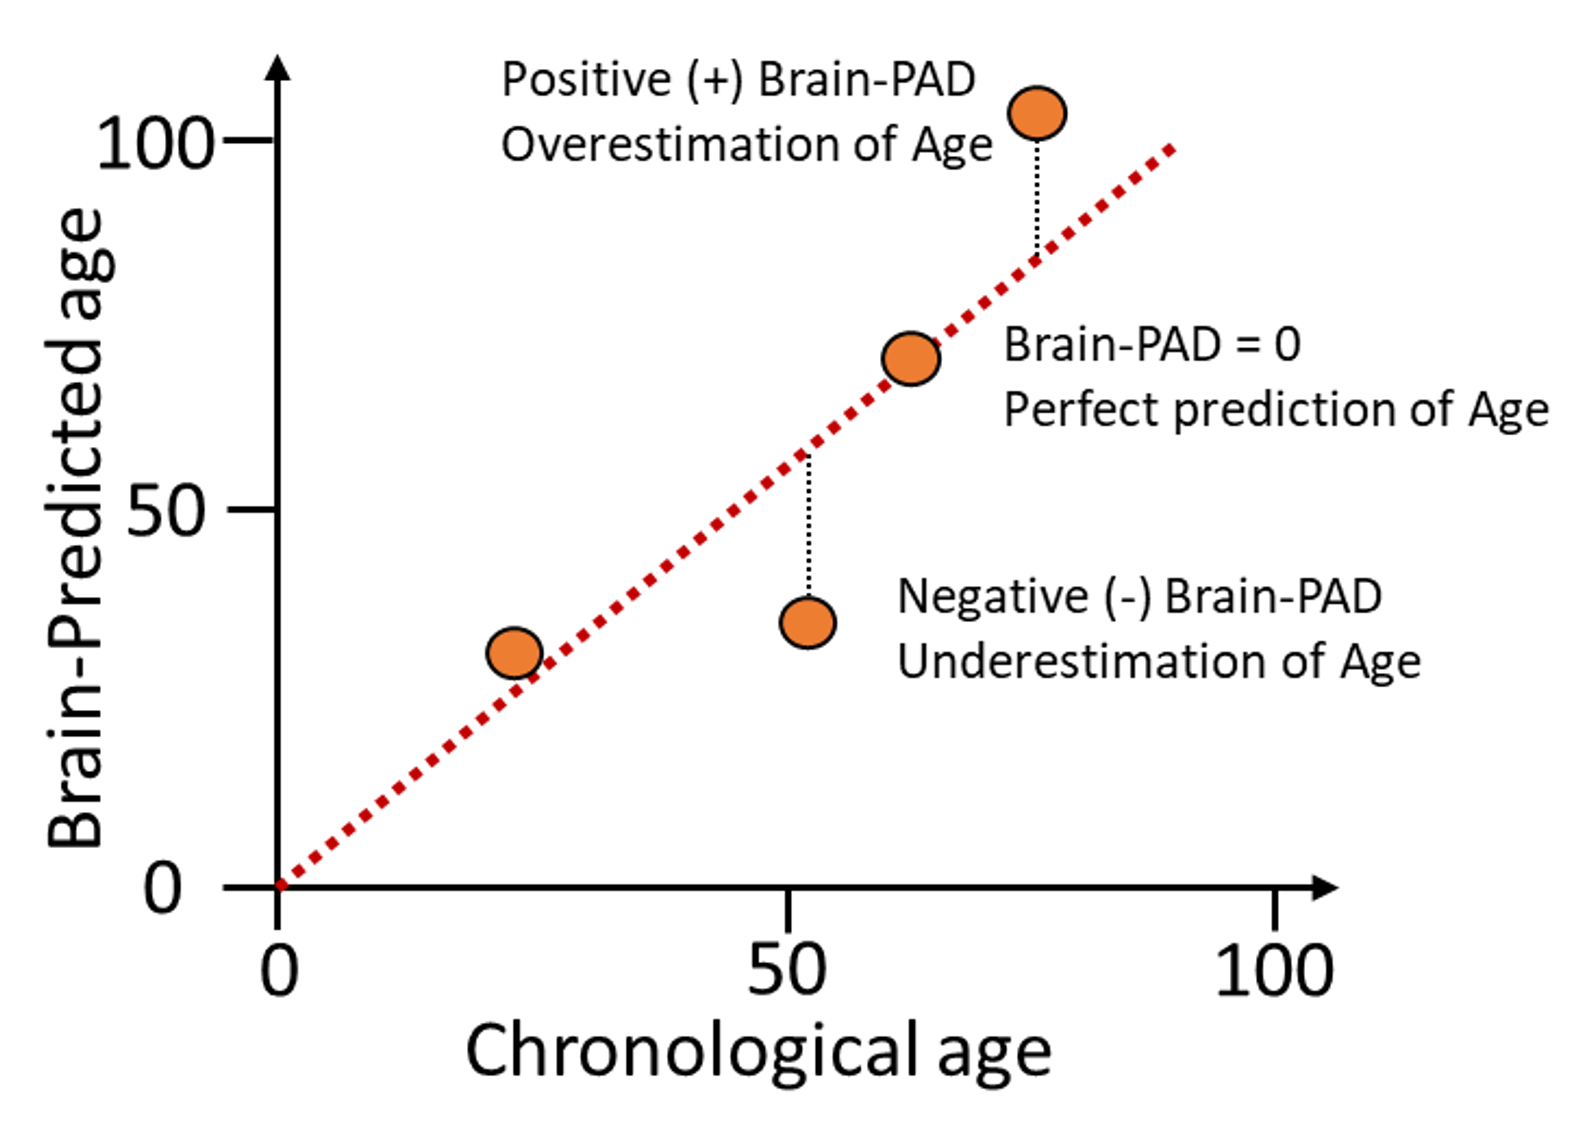
Brain-predicted age difference (brain-PAD; brain-predicted age – chronological age) is a potential biomarker for neurodegenerative diseases, including multiple sclerosis (MS). Previous models generally rely on T1-weighted (T1w) MRI brain scans. Here, we developed a deep-learning brain-age prediction model on FLAIR MRI. Our Inception-ResNet-V2 model was more accurate than a current state-of-the-art architecture and the FLAIR based model is comparable to a T1w MRI model. We used saliency maps, showing that areas such as the thalamus and ventricles are salient for brain-age prediction. We applied the FLAIR model to patients with MS, finding significantly higher brain-PAD compared to healthy controls.
Introduction
MS is an inflammatory and neurodegenerative disease characterised by demyelination and increased cerebral atrophy causing variable neurological symptoms and disability1. Clinically isolated syndrome (CIS) describes a single first episode of MS-like symptoms and may precede the development of MS2. Ageing is associated with greater deterioration and poorer prognosis in MS. Understanding how ageing affects the brain in people with MS may help better predict disease outcomes. Age-related brain changes are well established, including cerebral atrophy and development of white matter (WM) lesions3, features which are similar to MS. The brain-age paradigm postulates that there is variability in how the ageing process affects individuals, beyond that accounted for by their chronological age4. Predicted brain age has been found to be associated with physiological ageing, cognitive decline, and mortality4. This suggests its utility as a quantitative biomarker of age-related health and can be expressed as brain-predicted age difference (brain-PAD; brain-predicted age – chronological age). Three studies have found brain-PAD to be higher in MS than healthy controls using T1w MRI, with one study finding the brain-PAD to be greater in MS than CIS5-7. However, T1w MRI is not routinely available in clinical MS imaging protocols, and T1w MRI is not sensitive to WM lesions, hence calculating brain-PAD using FLAIR may increase the clinical potential of the biomarker.Brain-age models have used an array of different machine-learning approaches. One current state-of-the-art Convolutional neural network (CNN) is the Simple fully convolutional network (SFCN)8. The SFCN is a lightweight network, hence improvements in performance could be achieved using more complex networks, such as the DenseNet and Inception-ResNet-V29,10. In CNNs the prediction calculation is unseen and difficult to interpret. One way to gain insight is with ‘saliency mapping’, which is the process of quantifying the importance of each pixel/voxel for a CNN making a prediction.
Our study aimed to develop a FLAIR MRI brain-age prediction model and explore if the model could detect differences between MS subjects, CIS subjects and healthy controls. We used saliency mapping to evaluate which brain regions were influencing brain-age predictions.
Methods
A 3D Inception-ResNet-V2 network was developed and trained on 1550 healthy people with FLAIR and T1w MRI from 9 Magnetic Resonance Imaging in MS (MAGNIMS) centres and 3 open-source datasets; the Alzheimer’s Disease Neuroimaging Initiative (ADNI), European Prevention of Alzheimer's Consortium (EPAD) and the Longitudinal Frontotemporal Lobar Degeneration Study, NIFD11-14, aged from 18-91 years, leaving 310 random subjects unseen for testing the network. Comparison was made to the DenseNet and SFCN and the model’s accuracy measured with mean absolute error (MAE). Models were trained for 200 epochs using the ADAM optimizer. The model was additionally trained on 950 FLAIR MRIs with or without WM lesions filled using a lesion segmentation and filling algorithm15,16. Saliency maps of the network on each testing MRI was estimated using the SmoothGrad method17 and maps standardised to MNI space and saliency of brain regions quantified using the DKT and ICBM DTI-81 atlas18,19. The final model was applied to a dataset of 27 patients with CIS20 (mean age: 34.7+/-8.84, M:F 0.8:1, mean EDSS: 1.04, time from symptom onset: 2.18 years) and 26 patients with MS (mean age: 33.9+/-7.52, M:F 0.53:1, mean EDSS: 1.04, time from symptom onset: 2.76 years) to obtain a brain-PAD which was compared to healthy controls.Results
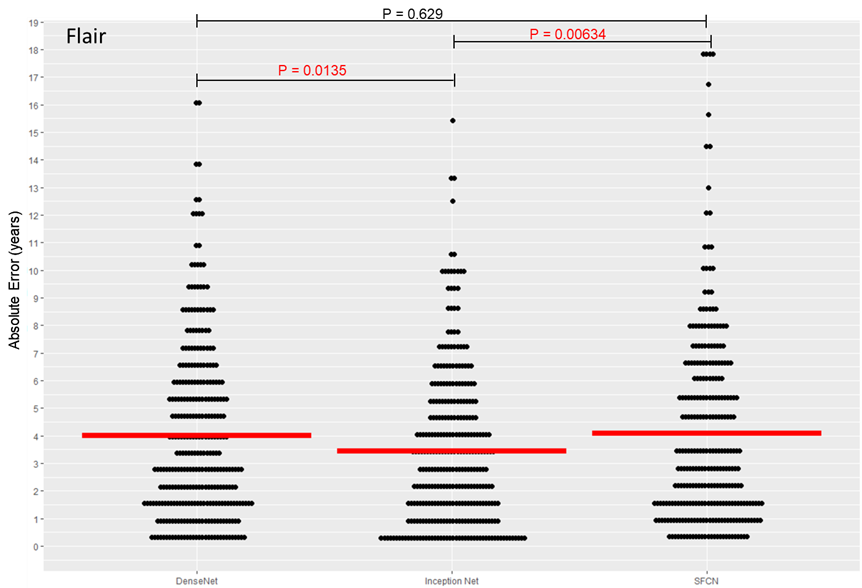
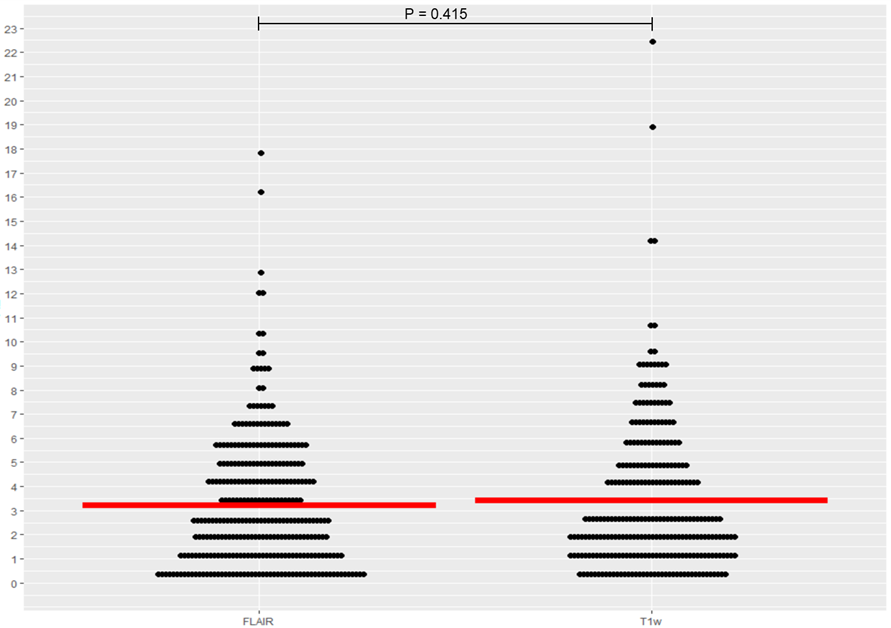
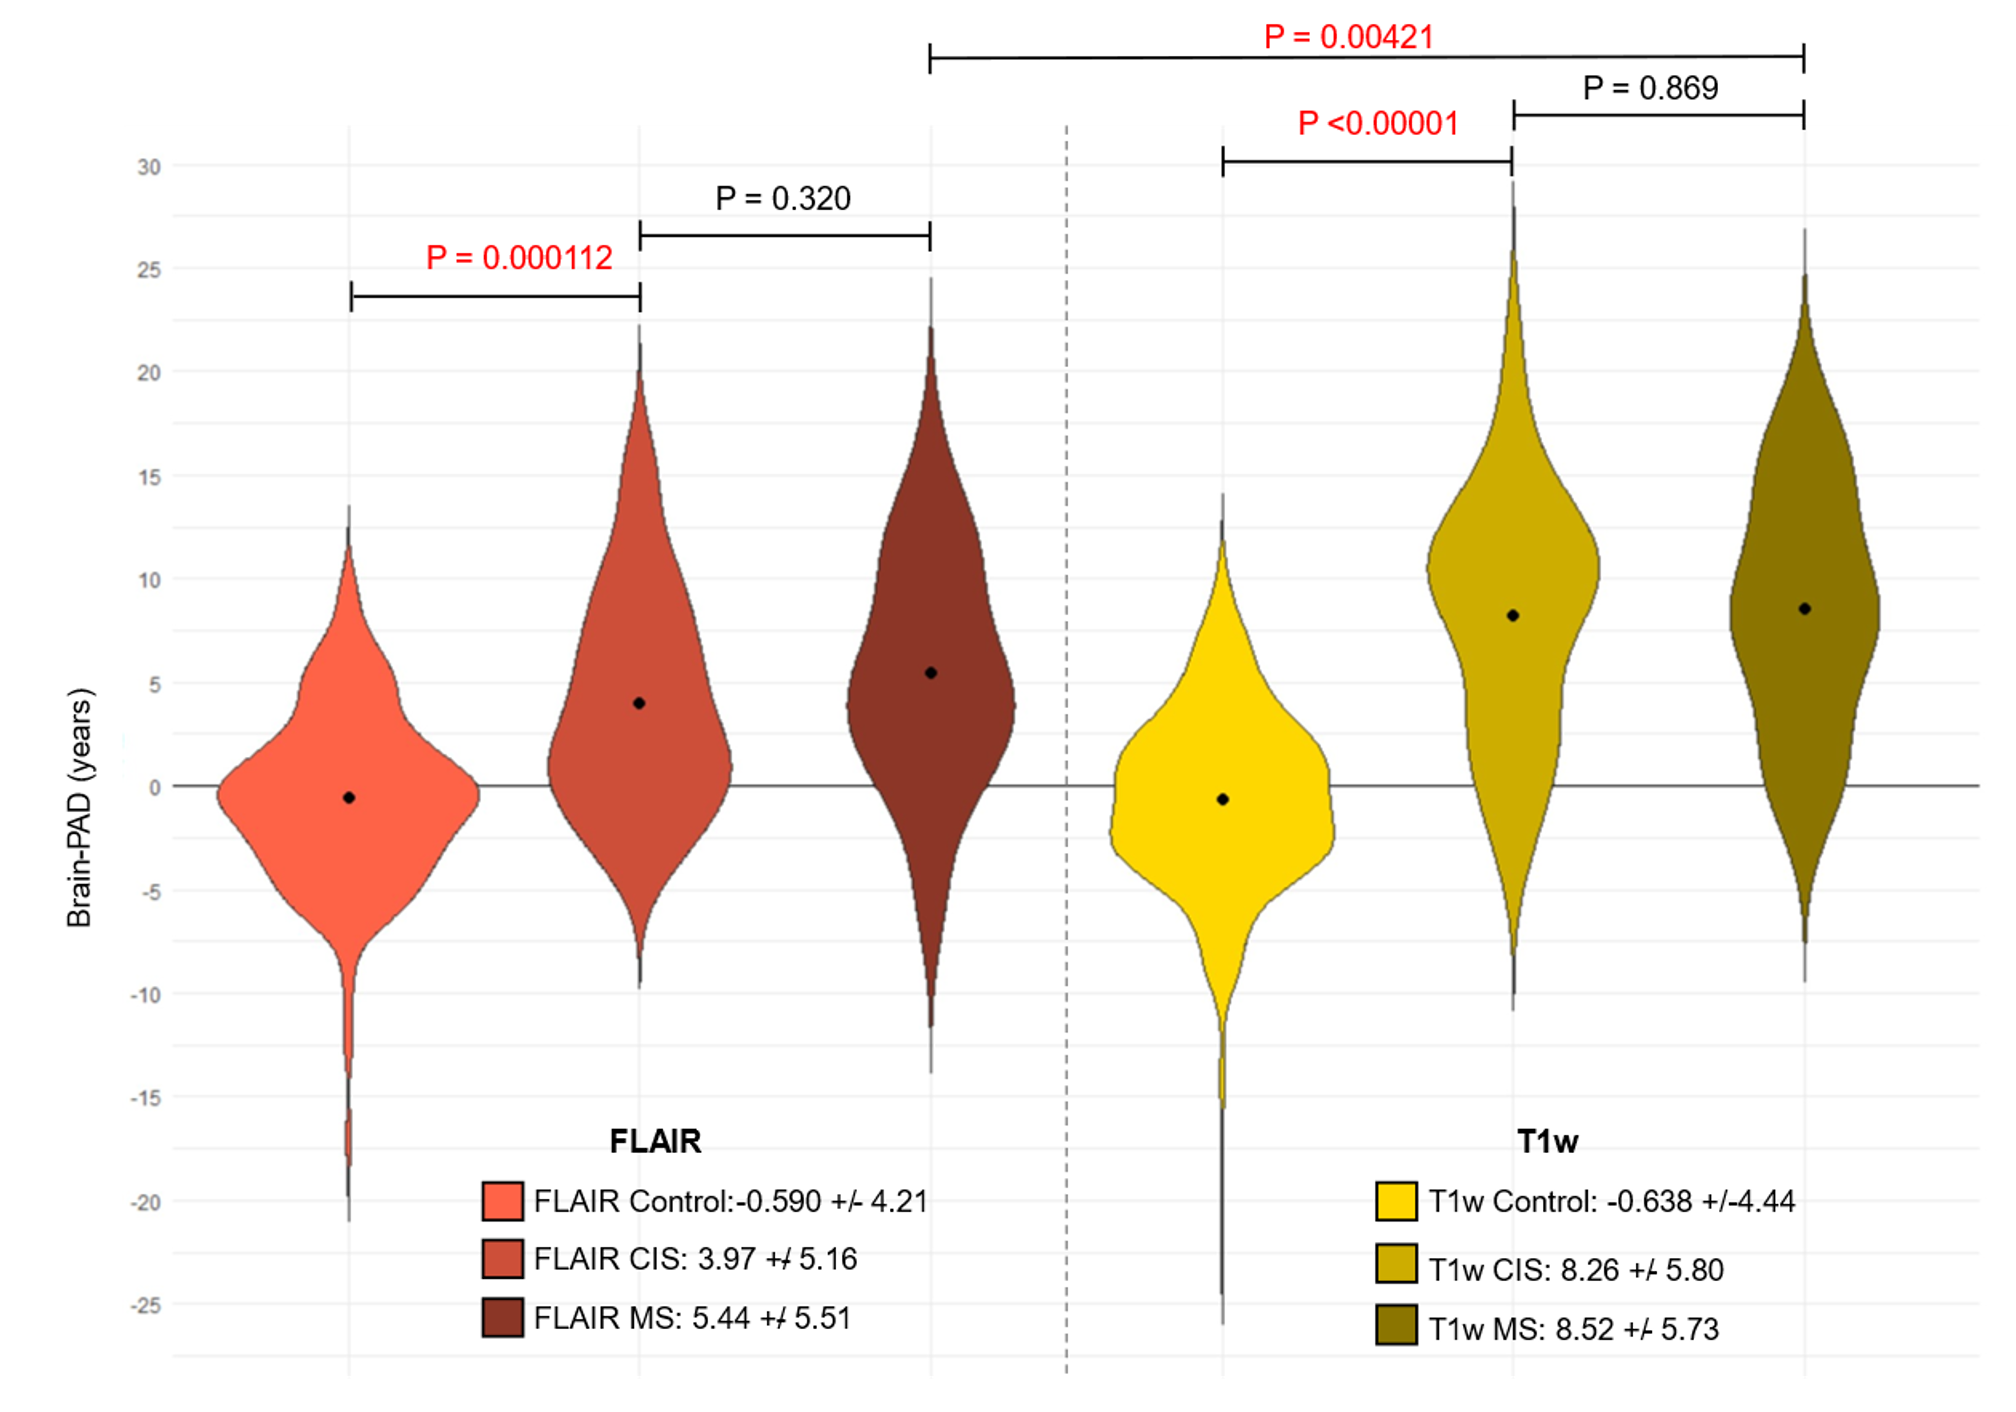
Using FLAIR MRI, the Inception-ResNet-V2 had a significantly lower MAE than the DensNet or SFCN models as shown in figure 2 (3.45 +/-2.73 versus 4.03 +/-3.08 and 4.16 +/-3.65 respectively). Model performance was improved with an ensemble of 5 models with a final MAE of 3.08 years. The FLAIR brain age model was comparable to a T1w model as shown in figure 3 (3.08 +/- 2.68 versus 3.26 +/- 2.89, P=0.42). The model trained on lesion filled FLAIR images was not significantly different to a standard FLAIR model (4.08 +/- 3.32 versus 4.19 +/- 3.87, P=0.78). Saliency maps are displayed in figure 4, highlighting the bilateral thalami, other subcortical structures, and the lateral ventricles. When applied to patients with CIS and MS the FLAIR model found both groups to have significantly higher means brain-PADs than healthy controls (figure 5) (3.97 and 5.44 versus -0.59 years).Discussion
This study developed a FLAIR-based brain-age model and found it to be comparable with a T1w model. We additionally developed the 3D Inception-ResNet-V2 and found it to be more accurate than the current state-of-the-art CNN for FLAIR brain age prediction. The thalamus was found to be highly salient for brain age prediction which may be due to the thalamus being associated with linear volume loss with age3. Additionally, we found that FLAIR WM lesions did not affect the FLAIR brain age predictions. Both MRI modalities found MS and CIS patients to have a greater brain-PAD than healthy controls, showing promise for clinical applications.Conclusion
This work reinforces the potential of brain-PAD as a clinical biomarker for MS and represents one more step towards multi-modality brain-age models that capture MS-related age variability. FLAIR-based brain-PAD could be potentially useful in clinical MS settings which do not routinely perform T1w imaging. We demonstrate as a proof-of-concept that clinical interpretability can be improved using saliency mapping.Acknowledgements
We are very grateful for the collaboration with MAGNIMS and their support.References
1. Rejdak, K., Jackson, S. and Giovannoni, G. (2010) ‘Multiple sclerosis: a practical overview for clinicians’, British Medical Bulletin, 95(1), pp. 79–104. doi: 10.1093/BMB/LDQ017.
2. Kuhle, J., Disanto, G., Dobson, R., Adiutori, R., Bianchi, L., Giovannoni, G., et al. (2015) ‘Conversion from clinically isolated syndrome to multiple sclerosis: A large multicentre study’:, http://dx.doi.org/10.1177/1352458514568827, 21(8), pp. 1013–1024. doi: 10.1177/1352458514568827.
3. Fjell, A. and Walhovd, K. (2010) ‘Structural brain changes in aging: courses, causes and cognitive consequences’, Reviews in the neurosciences, 21(3), pp. 187–221. doi: 10.1515/REVNEURO.2010.21.3.187.
4. Cole, J. H., Ritchie, S. J., Bastin, M. E., Valdés Hernández, M. C., Muñoz Maniega, S., Royle, N., Corley, J., Pattie, A., Harris, S. E., Zhang, Q., Wray, N. R., Redmond, P., Marioni, R. E., Starr, J. M., Cox, S. R., Wardlaw, J. M., Sharp, D. J. and Deary, I. J. (2017) ‘Brain age predicts mortality’, Molecular Psychiatry 2018 23:5, 23(5), pp. 1385–1392. doi: 10.1038/mp.2017.62.
5. Høgestøl EA, Kaufmann T, Nygaard GO, Beyer MK, Sowa P, Nordvik JE, et al. Cross-Sectional and Longitudinal MRI Brain Scans Reveal Accelerated Brain Aging in Multiple Sclerosis. Front Neurol. 2019;0(APR):450.
6. Cole, J. H., Raffel, J., Friede, T., Eshaghi, A., Brownlee, W. J., Chard, D., Stefano, N. De, Enzinger, C., Pirpamer, L., Filippi, M., Gasperini, C., Rocca, M. A., Rovira, A., Ruggieri, S., Sastre-Garriga, J., Stromillo, M. L., Uitdehaag, B. M. J., Vrenken, H., Barkhof, F., Nicholas, R. and Ciccarelli, O. (2020) ‘Longitudinal Assessment of Multiple Sclerosis with the Brain-Age Paradigm’, Annals of Neurology, 88(1), pp. 93–105. doi: 10.1002/ANA.25746.
7. Kaufmann, T., van der Meer, D., Doan, N.T. et al. Common brain disorders are associated with heritable patterns of apparent aging of the brain. Nat Neurosci 22, 1617–1623 (2019). https://doi.org/10.1038/s41593-019-0471-7
8. Gong, W., Beckmann, C. F., Vedaldi, A., Smith, S. M. and Peng, H. (2021) ‘Optimising a Simple Fully Convolutional Network for Accurate Brain Age Prediction in the PAC 2019 Challenge’, Frontiers in Psychiatry, 12, p. 627996. doi: 10.3389/FPSYT.2021.627996.
9. Huang, G., Liu, Z., van der Maaten, L. and Weinberger, K. Q. (2016) ‘Densely Connected Convolutional Networks’, Proceedings - 30th IEEE Conference on Computer Vision and Pattern Recognition, CVPR 2017, 2017-January, pp. 2261–2269. Available at: https://arxiv.org/abs/1608.06993v5 (Accessed: 5 September 2021).
10. Szegedy, C., Ioffe, S., Vanhoucke, V. and Alemi, A. A. (2017) ‘Inception-v4, Inception-ResNet and the Impact of Residual Connections on Learning’, Thirty-First AAAI Conference on Artificial Intelligence. Available at: https://www.aaai.org/ocs/index.php/AAAI/AAAI17/paper/view/14806 (Accessed: 18 July 2021).
11. MAGNIMS (Magnetic Resonance Imaging in MS) Group (2021). Available at: https://www.magnims.eu/ (Accessed: 26 August 2021).
12. ADNI, A. D. N. I. (2017) ADNI-3. Available at: http://adni.loni.usc.edu/adni-3/ (Accessed: 26 August 2021).
13. Solomon, A., Kivipelto, M., Molinuevo, J. L., Tom, B. and Ritchie, C. W. (2018) ‘European Prevention of Alzheimer’s Dementia Longitudinal Cohort Study (EPAD LCS): study protocol’, BMJ Open, 8(12), p. e021017. doi: 10.1136/BMJOPEN-2017-021017.
14. Boeve, B., Boxer, A. and Rosen, H. (2021) ARTFL-LEFFTDS Longitudinal Frontotemporal Lobar Degeneration Study (ALLFTD). Available at: https://memory.ucsf.edu/research-trials/research/allftd (Accessed: 26 August 2021).
15. Valverde, S., Cabezas, M., Roura, E., Gonzálezvilì, S., Pareto, D., Vilanova, J. C., Ramió-Torrentà, L., Rovira, A., Oliver, A. and Lladó, X. (2017) ‘Improving automated multiple sclerosis lesion segmentation with a cascaded 3D convolutional neural network approach’. Available at: https://portal.fli-iam.irisa.fr/msseg-challenge/workshop- (Accessed: 26 August 2021).
16. Prados, F., Cardoso, M. J., Kanber, B., Ciccarelli, O., Kapoor, R., Gandini Wheeler-Kingshott, C. A. M. and Ourselin, S. (2016) ‘A multi-time-point modality-agnostic patch-based method for lesion filling in multiple sclerosis’, NeuroImage, 139, pp. 376–384. doi: 10.1016/J.NEUROIMAGE.2016.06.053.
17. Smilkov, D., Thorat, N., Kim, B., Viégas, F. and Wattenberg, M. (2017) ‘SmoothGrad: removing noise by adding noise’. Available at: https://arxiv.org/abs/1706.03825v1 (Accessed: 31 August 2021).
18. Klein, A. and Tourville, J. (2012) ‘101 labeled brain images and a consistent human cortical labeling protocol’, Frontiers in Neuroscience, (DEC). doi: 10.3389/FNINS.2012.00171.
19. Mori, S., Oishi, K., Jiang, H., Jiang, L., Li, X., Akhter, K., Hua, K., Faria, A. V., Mahmood, A., Woods, R., Toga, A. W., Pike, G. B., Neto, P. R., Evans, A., Zhang, J., Huang, H., Miller, M. I., van Zijl, P. and Mazziotta, J. (2008) ‘Stereotaxic white matter atlas based on diffusion tensor imaging in an ICBM template’, NeuroImage, 40(2), pp. 570–582. doi: 10.1016/J.NEUROIMAGE.2007.12.035
20. Collorone, S., Prados, F., Kanber, B., Cawley, N. M., Tur, C., Grussu, F., Solanky, B. S., Yiannakas, M., Davagnanam, I., Wheeler-Kingshott, C. A. M. G., Barkhof, F., Ciccarelli, O. and Toosy, A. T. (2021) ‘Brain microstructural and metabolic alterations detected in vivo at onset of the first demyelinating event’, Brain, 144(5), p. 1409. doi: 10.1093/BRAIN/AWAB043.
Figures