1552
The association between white matter hyperintensity shape and long-term dementia outcome in community-dwelling older adults
Jasmin A. Keller1, Sigurður Sigurdsson2, Kelly Klaassen1, Eveline Scholte1, Lydiane Hirschler1, Mark A. van Buchem1, Lenore J. Launer3, Matthias J.P. van Osch1, Vilmundor V. Gudnason2, and Jeroen de Bresser1
1Department of Radiology, Leiden University Medical Center, Leiden, Netherlands, 2Icelandic Heart Association, Kopavogur, Iceland, 3Laboratory of Epidemiology and Population Science, National Institute on Aging, Bethesda, MD, United States
1Department of Radiology, Leiden University Medical Center, Leiden, Netherlands, 2Icelandic Heart Association, Kopavogur, Iceland, 3Laboratory of Epidemiology and Population Science, National Institute on Aging, Bethesda, MD, United States
Synopsis
Recently white matter hyperintensity (WMH) shape was introduced as a promising novel marker that may provide a more detailed characterization of WMH than volume alone. We aimed to investigate the association between WMH shape and the occurrence of dementia later in life in community dwelling older adults. WMH shape markers and WMH volumes were determined for periventricular/confluent, and deep WMH. A more complex shape of periventricular/confluent WMH (higher fractal dimension), as well as total and periventricular/confluent WMH volume, were associated with a greater risk of dementia. These results may indicate a prognostic value of WMH shape markers.
Introduction
Cerebral small vessel disease (SVD) is a key contributor to the development of dementia1. White matter hyperintensities (WMH) are a key imaging marker of SVD and become evident as hyperintense lesions on fluid-attenuated inversion recovery (FLAIR) MRI images1. Previous research has shown that WMH volume is related to the occurrence of dementia2. Recently WMH shape was introduced as a promising novel marker that may provide a more detailed characterization of WMH than volume alone. WMH shape has been associated with the occurrence of future stroke and increased mortality in patients with an increased vascular burden3. However, the association of WMH shape and occurrence of dementia later in life remains unknown. Therefore, we aimed to investigate the association between WMH shape and the occurrence of dementia later in life in community dwelling older adults.Methods
Participants & study designThis abstract includes a randomly selected subset (n=350) of the AGES Reykjavik study4. At baseline, FLAIR and T1-weighted brain MRI scans were acquired on a 1.5 Tesla Signa Twinspeed device (General Electric Medical Systems, Waukesha, Wisconsin). Dementia outcome was determined as a binary variable (yes/no) by contacting the nursing homes 10.2 ± 2.4 years after the baseline MRI scan. The inclusion and exclusion of participants from the AGES-Reykjavik study for the current research are illustrated in Figure 1.
WMH markers
WMH were segmented automatically using the registered FLAIR images in the LST toolbox in SPM12. The lateral ventricles were segmented using the T1 scan and subsequently inflated with both 3 and 10 mm. The inflated ventricle masks were used to classify WMH into periventricular, confluent, and deep WMH (see Figure 2). WMH shape markers were calculated based on the WMH segmentation. Convexity, solidity, concavity index, and fractal dimension were determined for periventricular/confluent WMHs5. A lower convexity and solidity, and higher concavity index and fractal dimension indicate more irregularly shaped periventricular or confluent WMH. For deep WMHs, fractal dimension and eccentricity were calculated5. In the case of multiple deep WMHs, the mean eccentricity value across all deep WMHs per participant was determined5. A higher eccentricity and fractal dimension indicate a more complex shape of deep WMH. We also calculated the volumes of periventricular/confluent, deep, and total WMH. WMHs consisting of less than 5 voxels were not further analysed, since WMH shape markers cannot be calculated accurately on small volume WMH6.
Statistical analysis
Cox regression was performed for z-scores of WMH shape markers, controlled for age and sex. Solidity and WMH volumes were natural log-transformed due to non-normal distribution. For WMH volumes, regression models were additionally controlled for intracranial volume.
Results
Baseline characteristics of the study sample can be found in Table 1. A higher fractal dimension of periventricular/confluent WMH was associated with a greater risk of developing dementia later in life (HR 1.50, 95% CI (1.09–2.07); p=0.013). A higher fractal dimension indicates a more complex shape. No significant associations were found for the other WMH shape markers (Table 2). Total WMH volume (HR 1.88, 95% CI (1.21–2.70); p=0.001) and volume of periventricular/confluent WMH (HR 1.80, 95% CI (1.28–2.54); p=0.001) were associated with a greater risk of developing dementia later in life (Table 3). No association was found for deep WMH volume.Discussion
We found that a more complex shape of periventricular/confluent WMH as measured by the fractal dimension was associated with a higher risk of dementia later in life in community-dwelling older adults. Moreover, total WMH volume, as well as the volume of periventricular/confluent WMH, were associated with dementia status at follow-up, which is in line with previous studies2. Due to a heterogeneous aetiology of WMH in SVD, the MRI phenotypes associated with different underlying pathophysiological processes may appear as distinguishable WMH shape patterns7. The shape of periventricular/confluent WMH, for instance, may depend on the macrostructure of the small vessels surrounding the lateral ventricles. Determination of WMH shape may aid prognostic differentiation, which is currently only possible in a limited way with WMH volume or count alone7. We are the first to study the association between WMH shape markers and dementia outcome. It should be noted that these are preliminary results on a smaller subset of our dataset. The results may differ when the whole dataset is considered. Therefore, a final conclusion can be drawn when the ongoing analysis has been completed.Acknowledgements
This work was funded by an Alzheimer Nederland grant (WE.03-2019-08).
References
- Wardlaw JM, Smith C, Dichgans M. Mechanisms of sporadic cerebral small vessel disease: Insights from neuroimaging. Lancet Neurol. 2013;12(5):483-497. doi:10.1016/S1474-4422(13)70060-7
- Bos D, Wolters FJ, Darweesh SKL, et al. Cerebral small vessel disease and the risk of dementia: A systematic review and meta-analysis of population-based evidence. Alzheimer’s Dement. 2018;14(11):1482-1492. doi:10.1016/j.jalz.2018.04.007
- Ghaznawi R, Geerlings MI, Jaarsma-Coes M, et al. Association of White Matter Hyperintensity Markers on MRI and Long-term Risk of Mortality and Ischemic Stroke. Neurology. 2021;96(17):e2172-e2183. doi:10.1212/WNL.0000000000011827
- Harris TB, Launer LJ, Eiriksdottir G, et al. Age, gene/environment susceptibility-reykjavik study: Multidisciplinary applied phenomics. Am J Epidemiol. 2007;165(9):1076-1087. doi:10.1093/aje/kwk1155.
- Ghaznawi R, Geerlings MI, Jaarsma-Coes MG, et al. The association between lacunes and white matter hyperintensity features on MRI: The SMART-MR study. J Cereb Blood Flow Metab. 2019;39(12):2486-2496. doi:10.1177/0271678X18800463
- De Bresser J, Kuijf HJ, Zaanen K, et al. White matter hyperintensity shape and location feature analysis on brain MRI; Proof of principle study in patients with diabetes. Sci Rep. 2018;8(1):1-10. doi:10.1038/s41598-018-20084-y
- Alber J, Alladi S, Bae H, et al. White matter hyperintensities in vascular contributions to cognitive impairment and dementia (VCID): Knowledge gaps and opportunities. Alzheimer’s Dement Transl Res Clin Interv. 2019;5(1):107-117. doi:10.1016/j.trci.2019.02.001
Figures
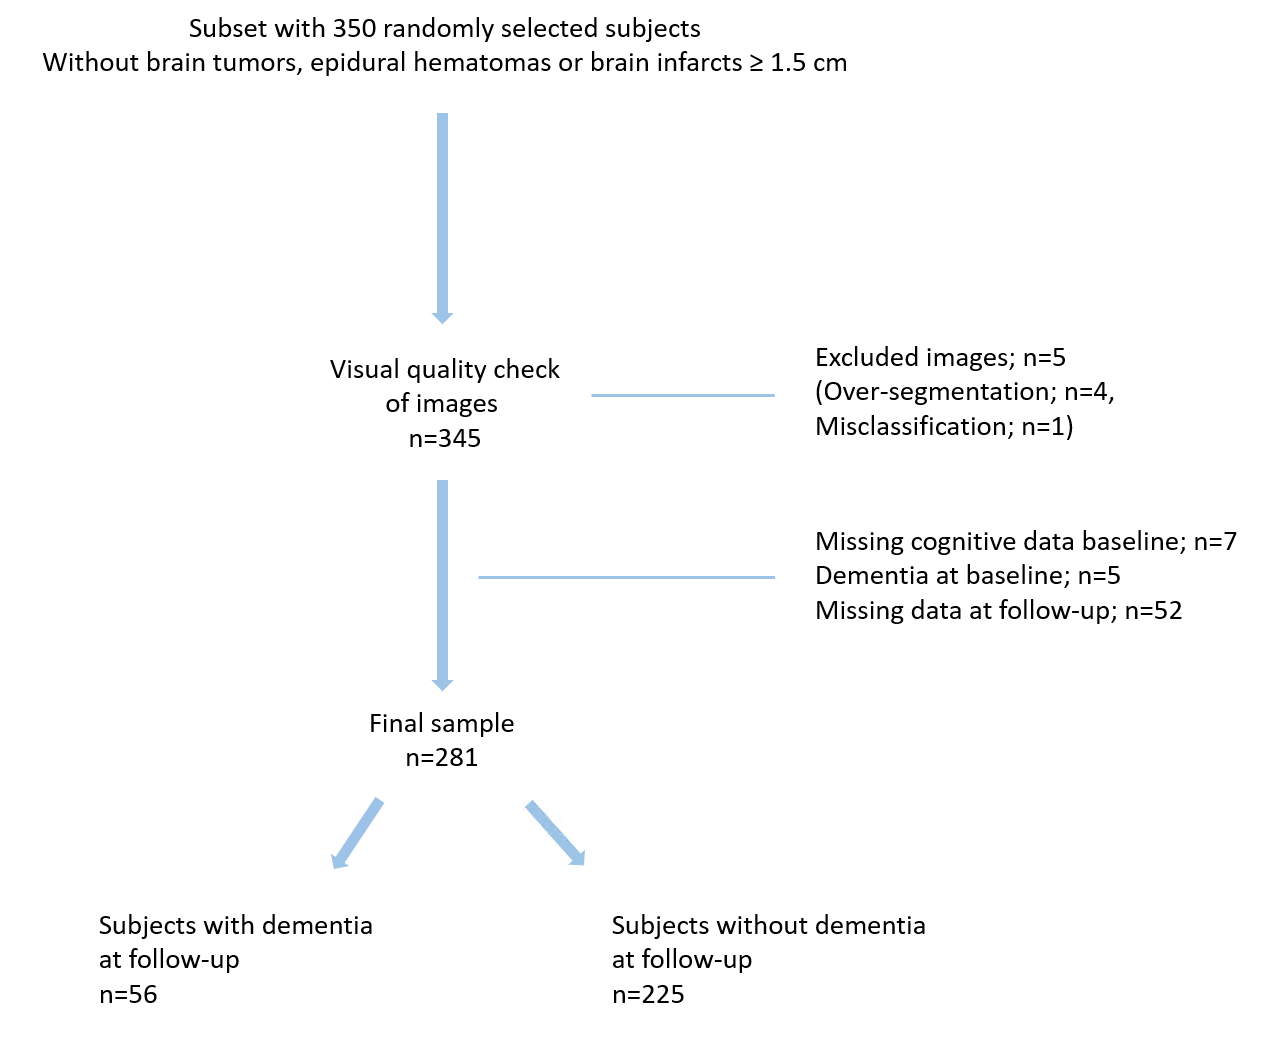
Figure 1. Flowchart illustrating the inclusion and exclusion of participants.
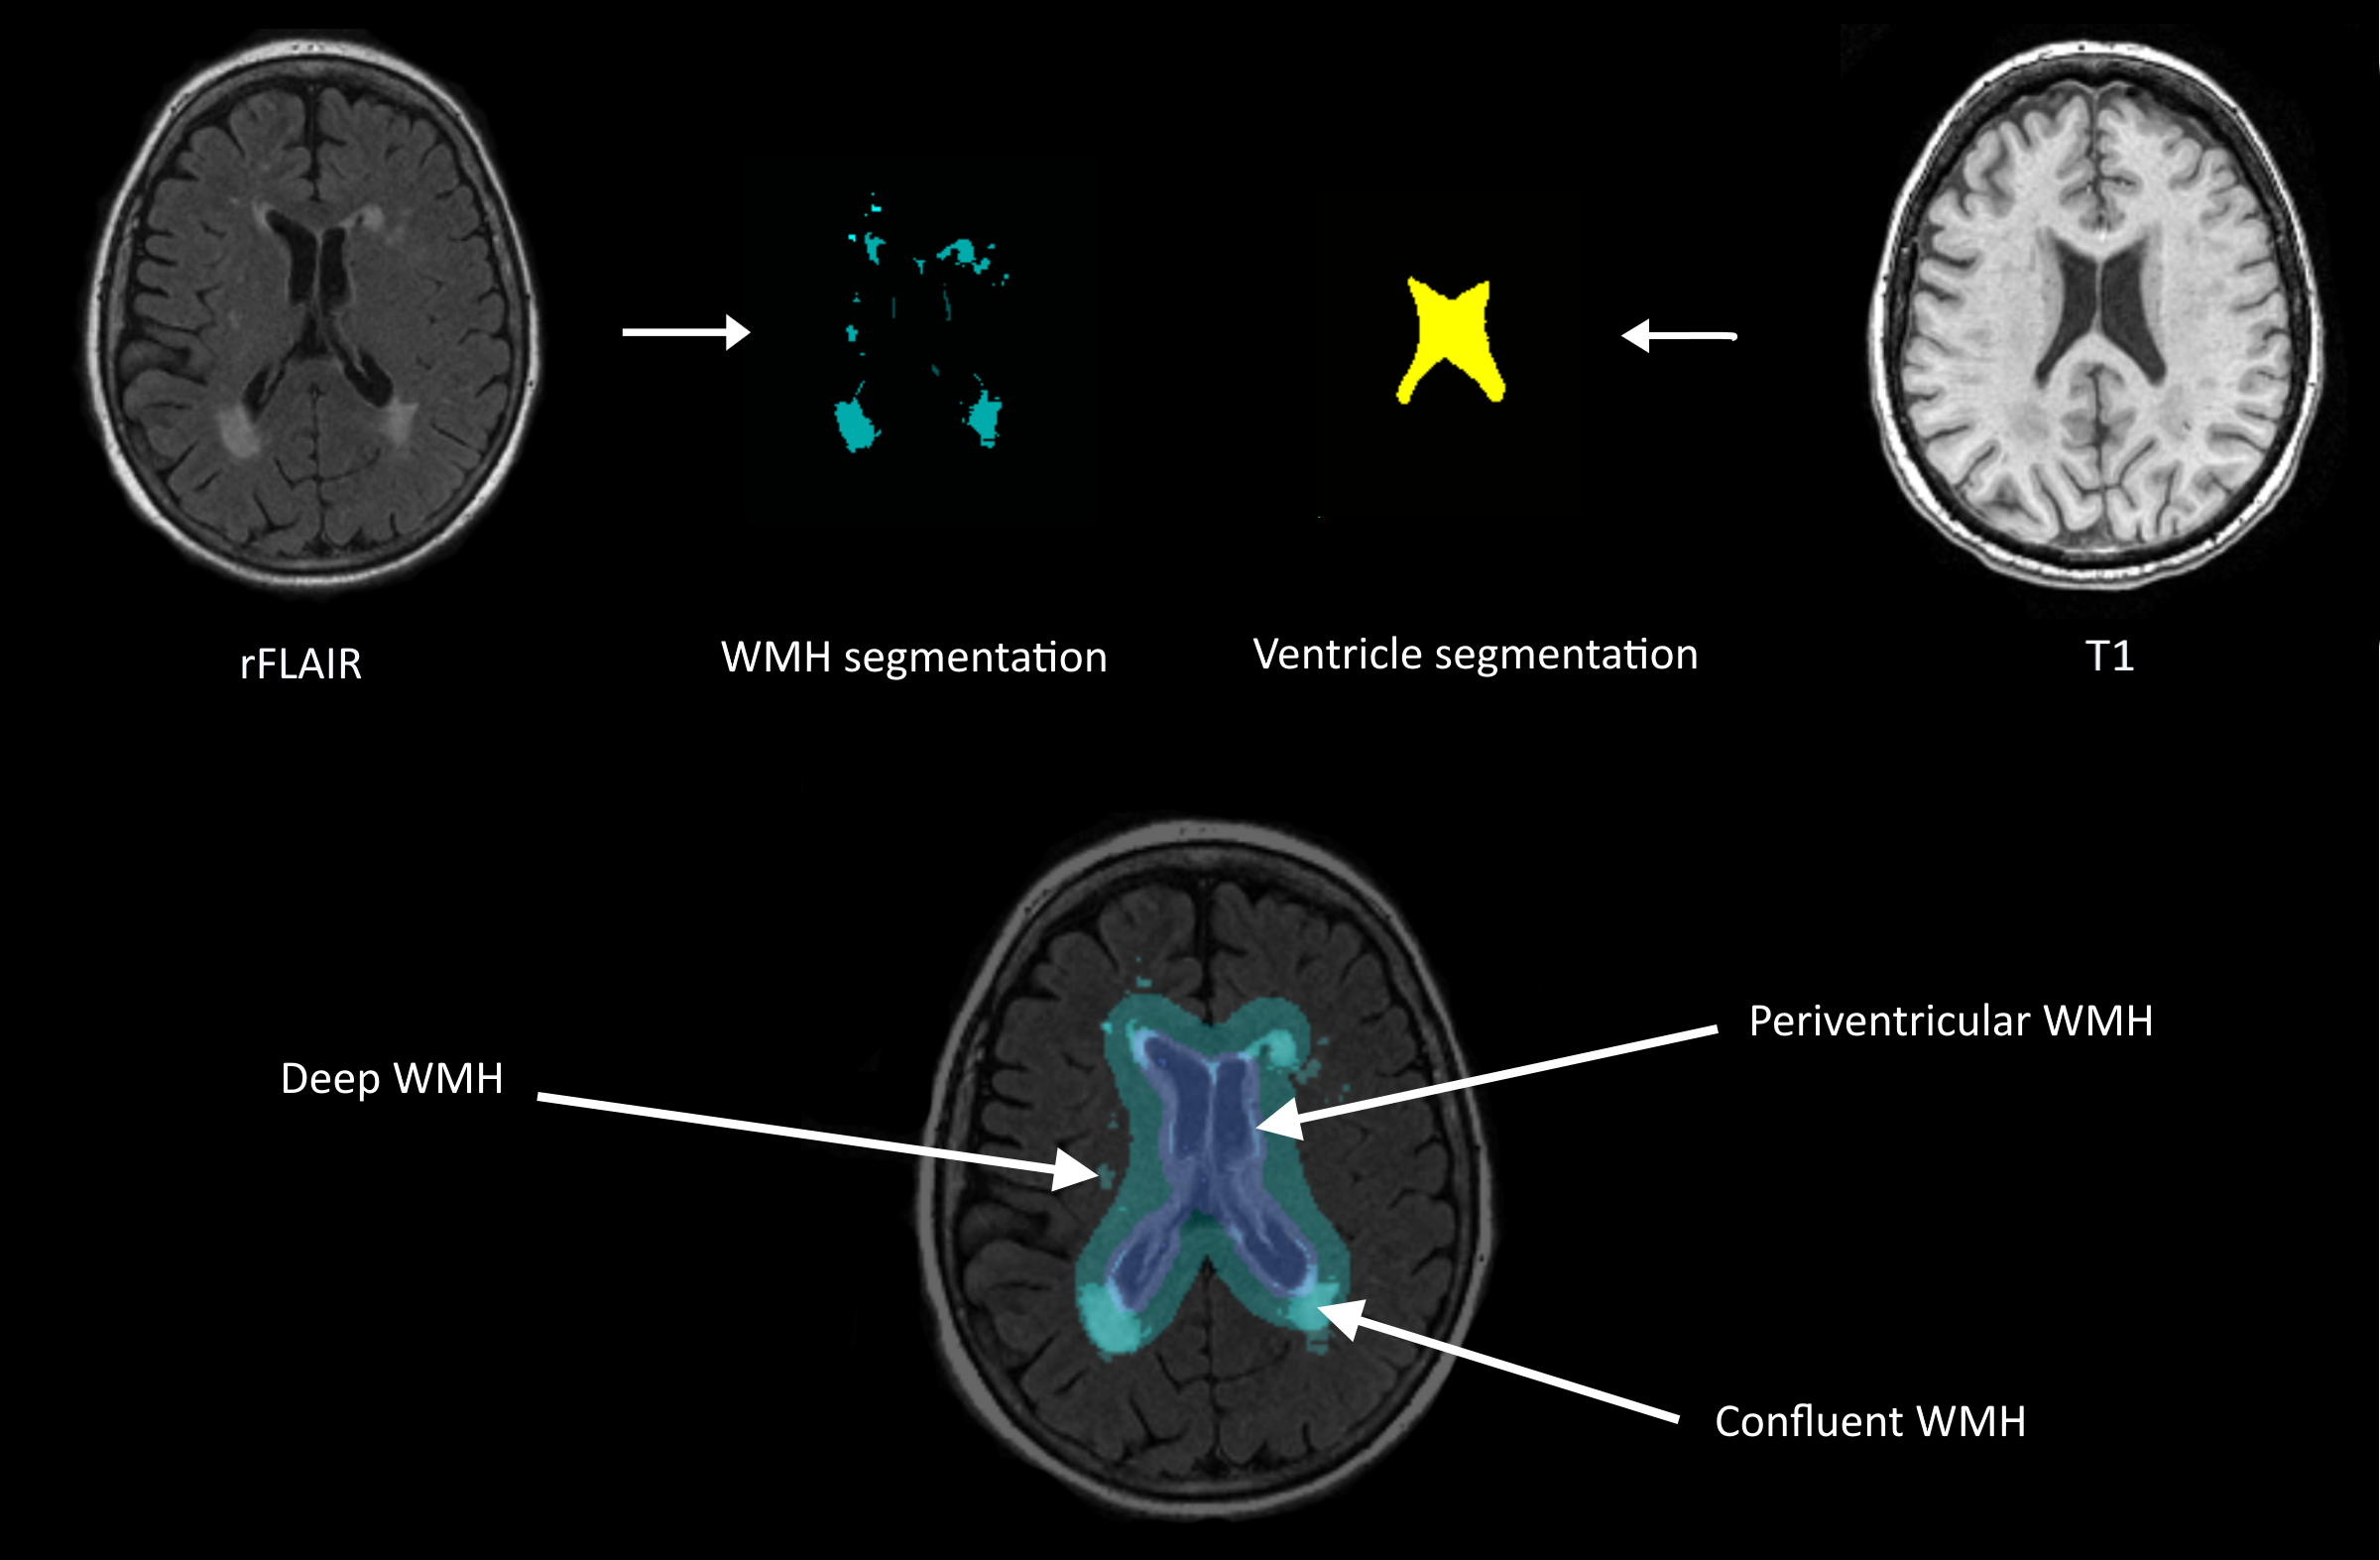
Figure 2. Illustration of the image processing pipeline. Lateral ventricles were segmented using T1-weighted MRI images. WMH segmentation was performed on the registered FLAIR (rFLAIR) images. Using two different inflated ventricle masks, WMH were classified into three types (deep, periventricular and confluent). Based on the resulting WMH type, different WMH shape markers were calculated.
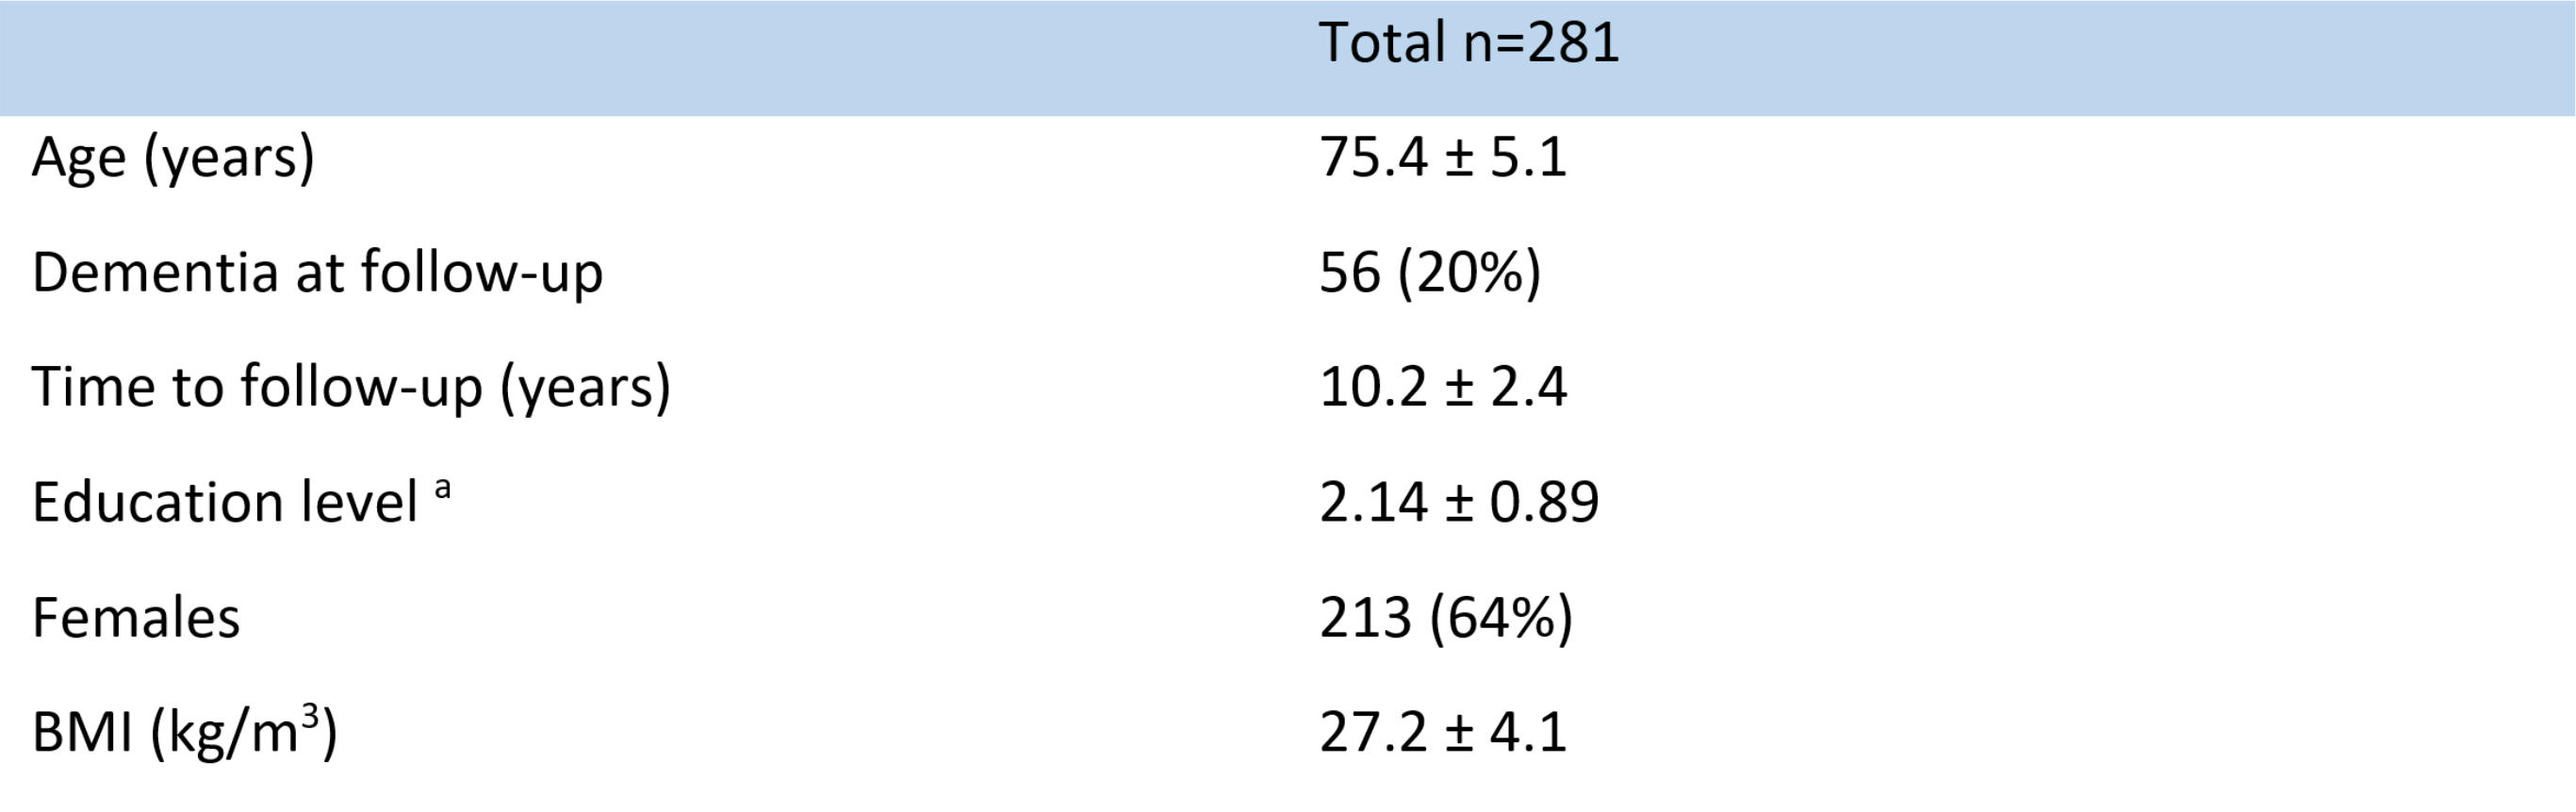
Table 1. Baseline characteristics of the study sample. Data are indicated as mean ± standard deviation or n (percentage). a Education level is the highest level of education that has been completed, where 1 = primary school, 2 = secondary school, 3 = college, and 4 = university. BMI: Body mass index.
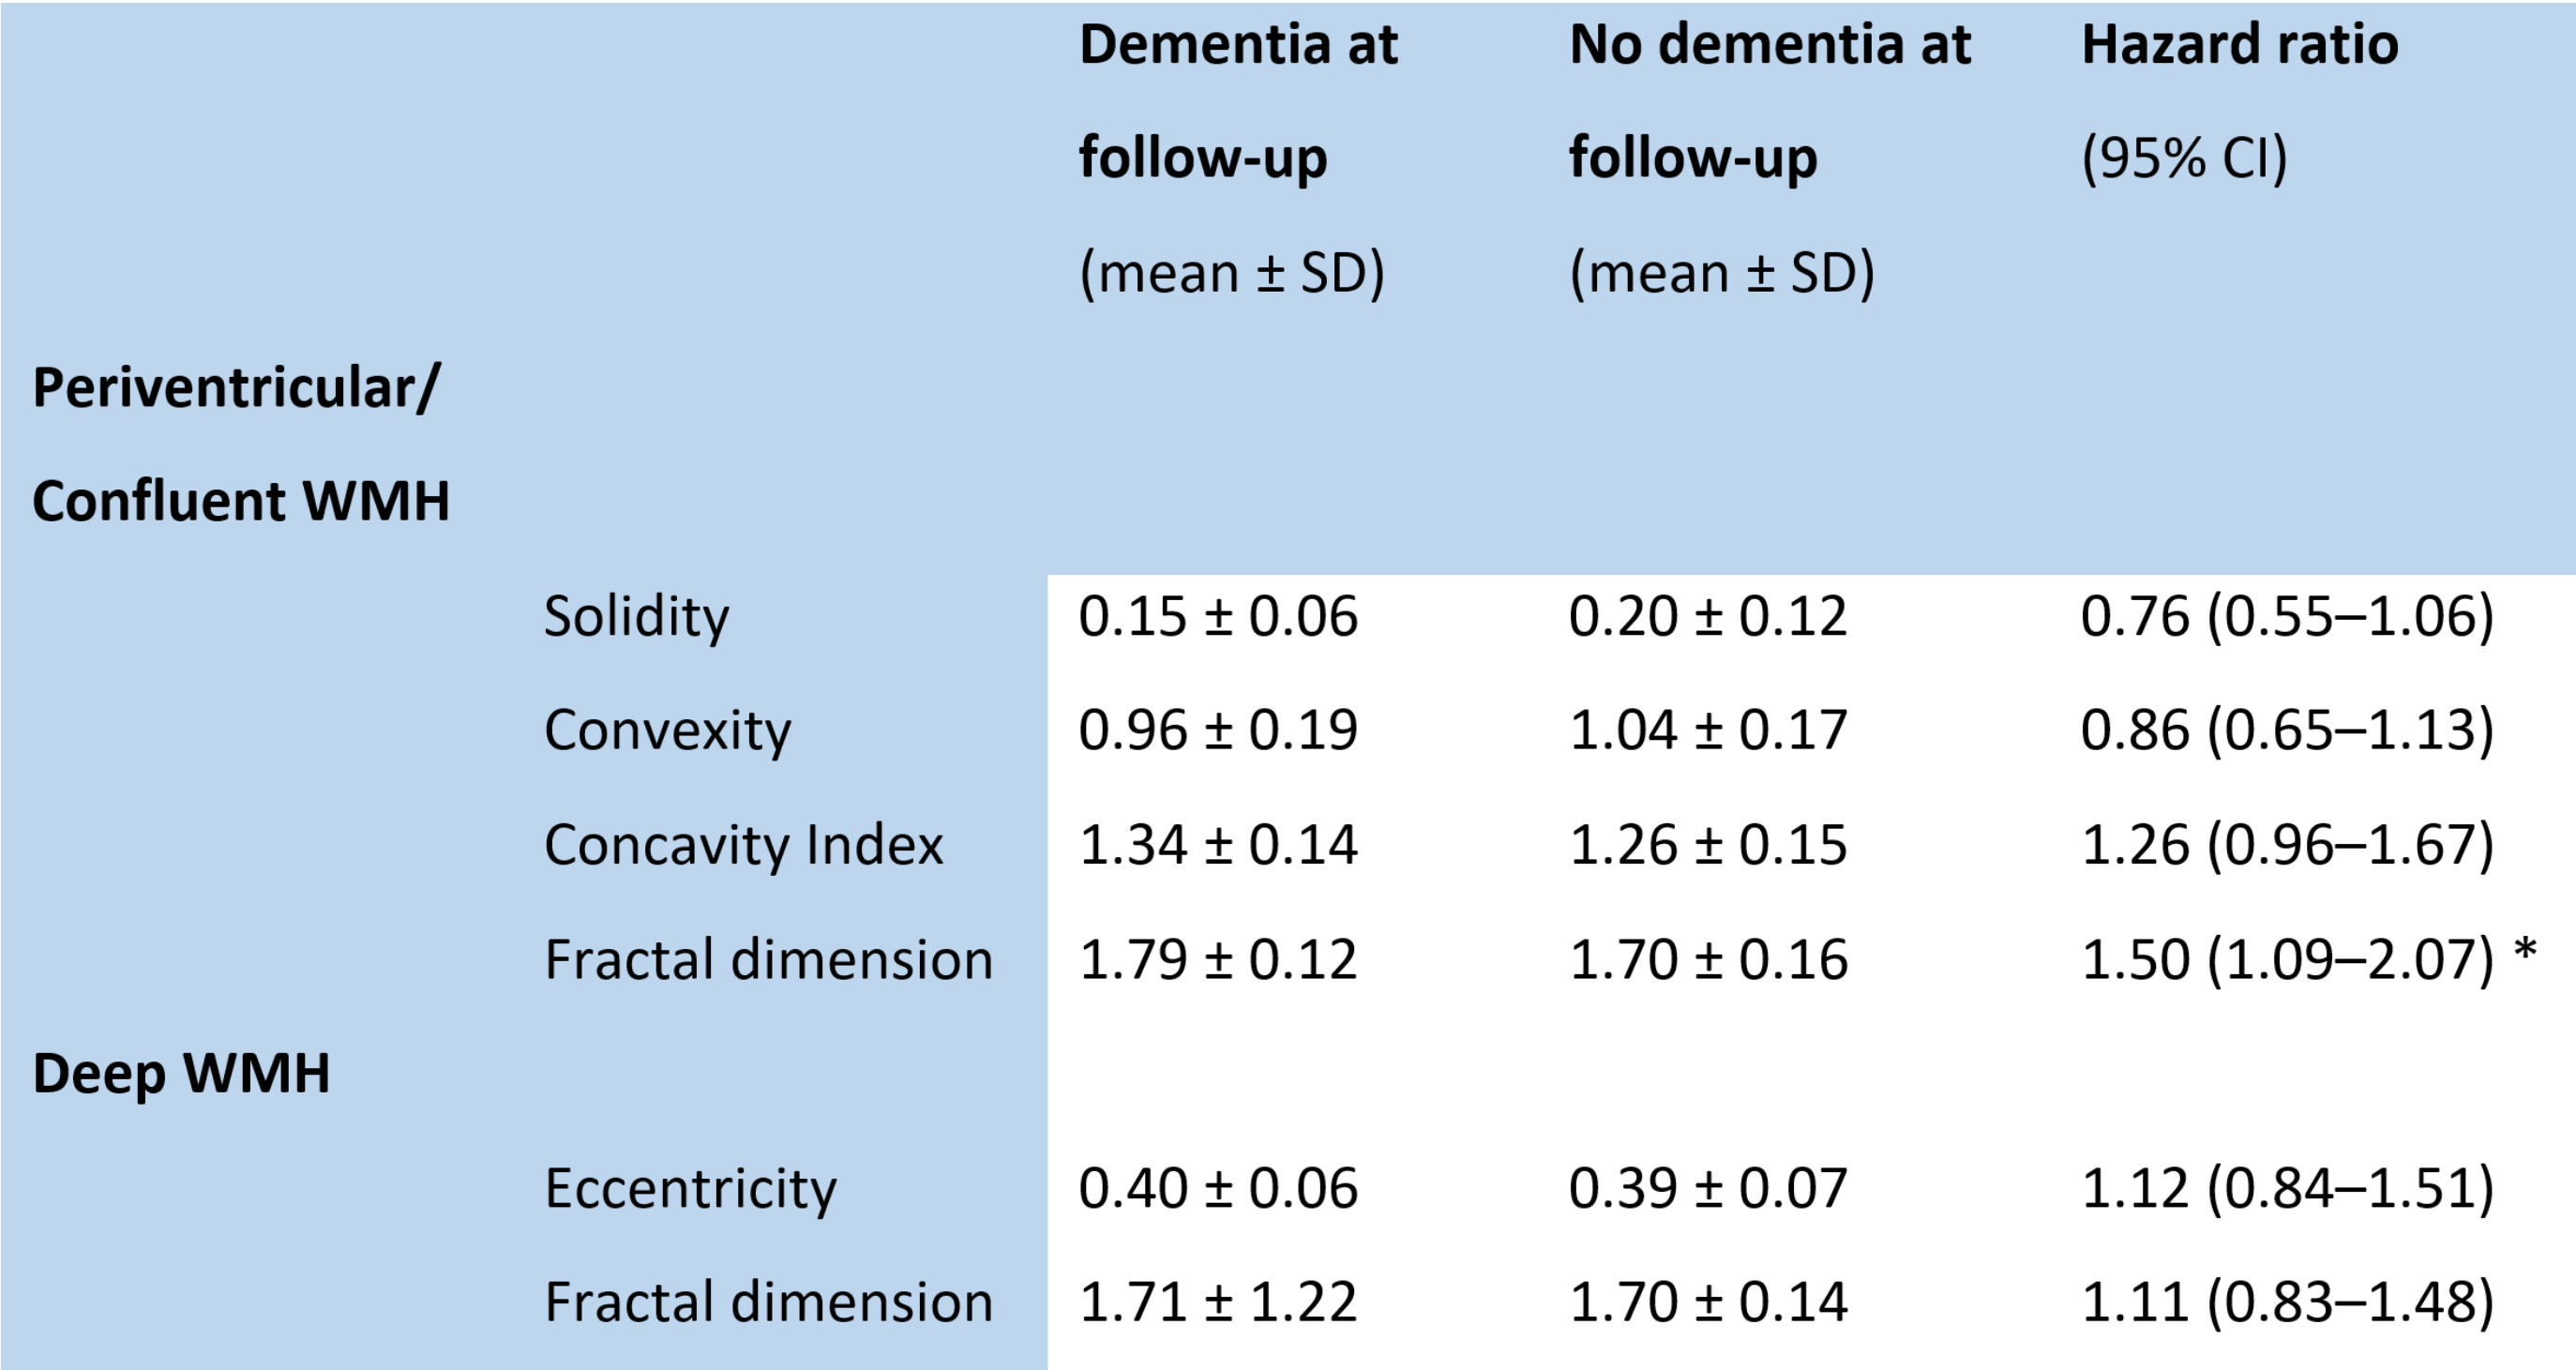
Table 2. Cox regression results of WMH shape markers. * p<0.05
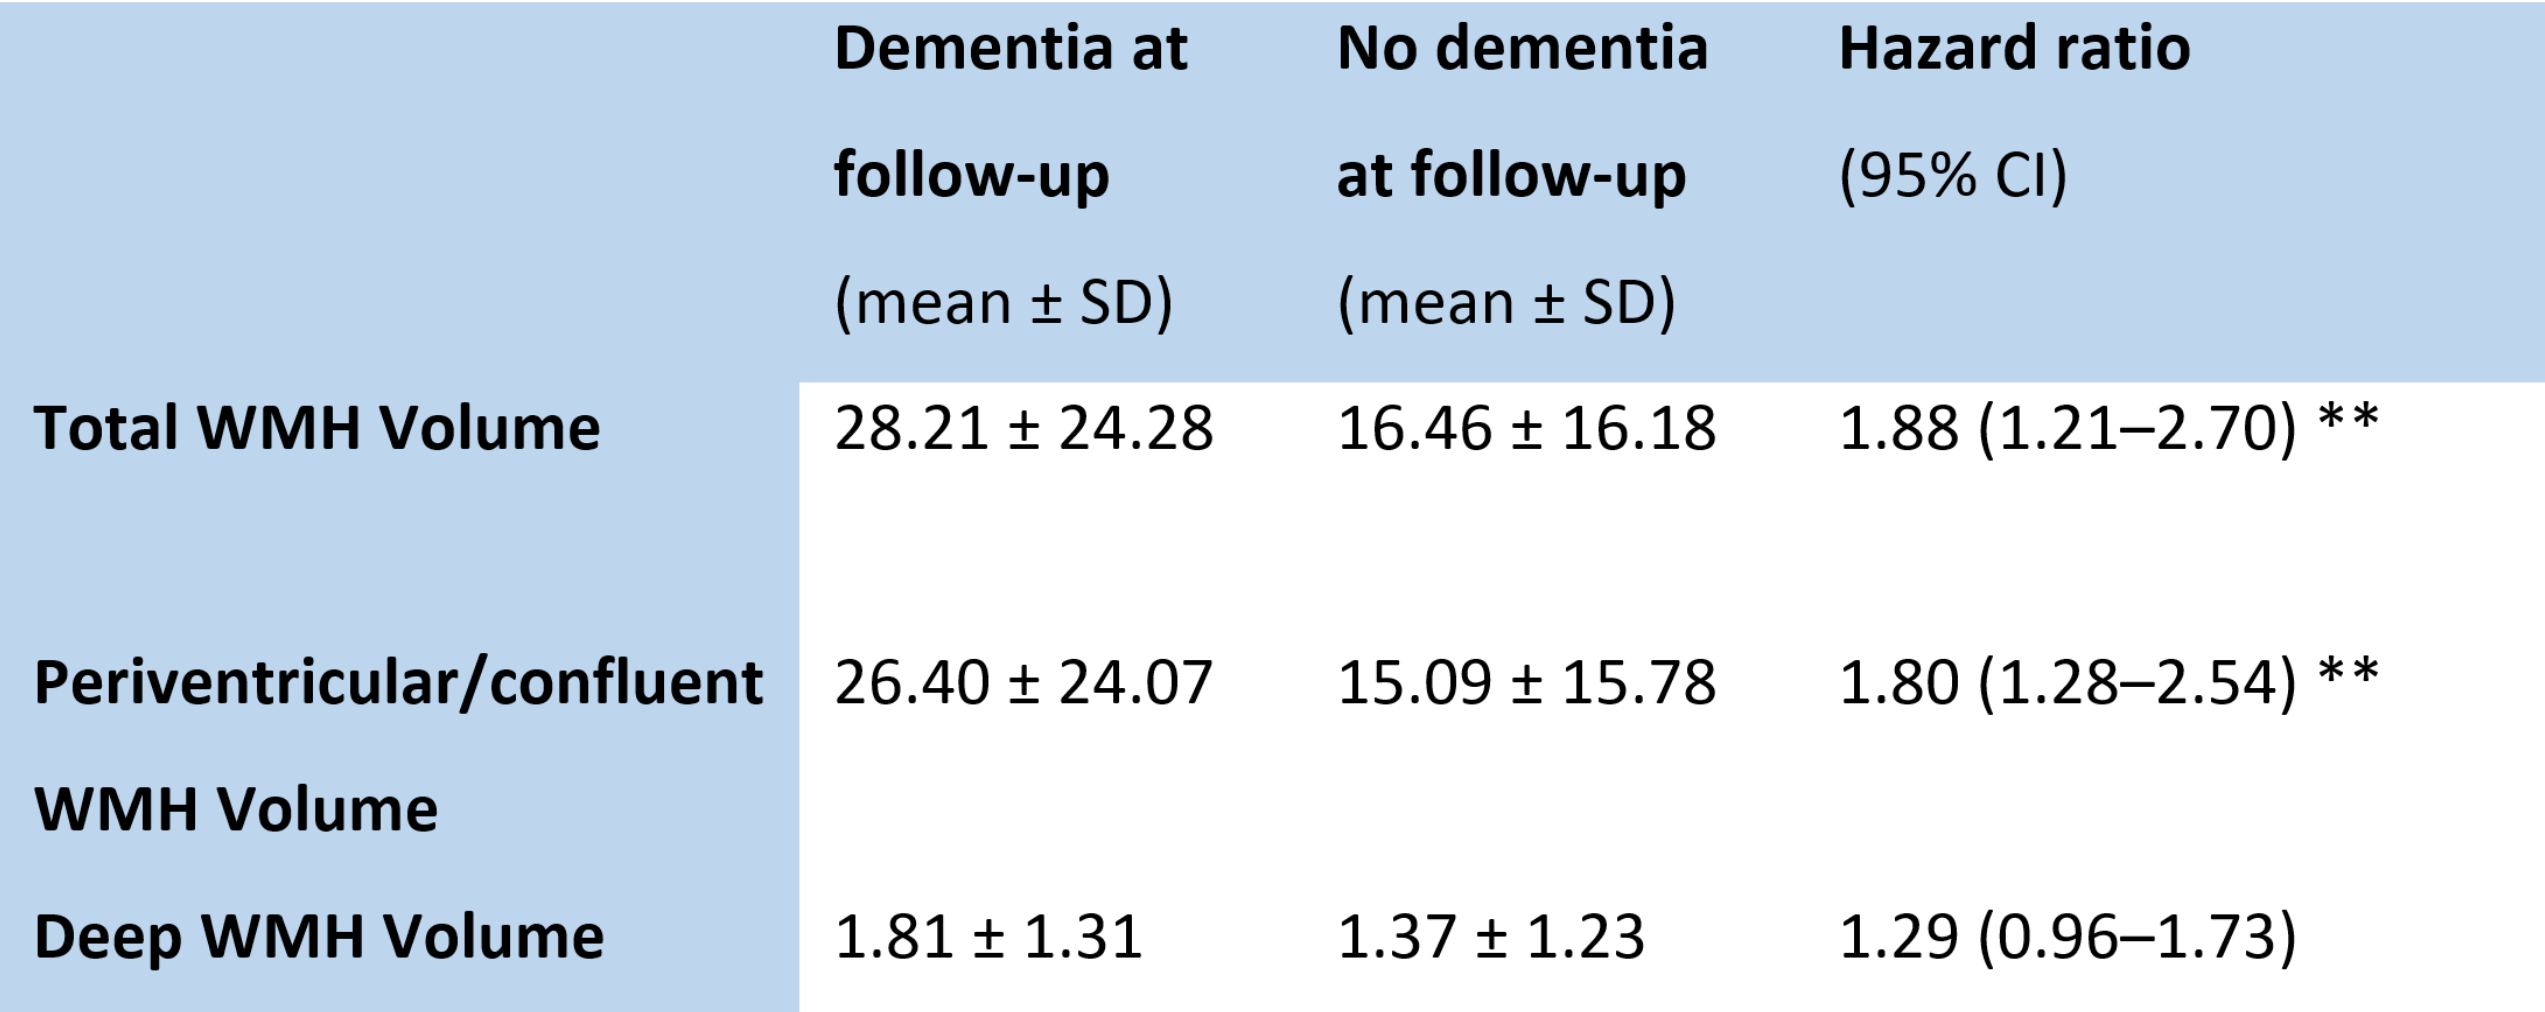
Table 3. Cox regression results of WMH volumes. Volumes are given in millilitres. ** p<0.01
DOI: https://doi.org/10.58530/2022/1552