1551
Multivariate quantification of brain differences in individuals with family history of Alzheimer's disease and APOE4 genetic risk1Physics, Concordia University, Montreal, QC, Canada, 2Montreal Heart Institute, Montreal, QC, Canada, 3Laboratory of Brain and Cognition, Montreal Neurological Institute, Department of Neurology and Neurosurgery, McGill University, Montreal, QC, Canada, 4McConnell Brain Imaging Centre, Montreal Neurological Institute, McGill University, Montreal, QC, Canada, 5Departments of Psychiatry and Psychology, McGill University, Montreal, QC, Canada, 6Electrical and Computer Engineering, Concordia University, Montreal, QC, Canada, 7Biomedical Engineering, McGill University, Montreal, QC, Canada, 8McConnell Brain Imaging Centre, Montreal Neurological Institute and Hospital, Montreal, QC, Canada, 9Neurology and Neurosurgery, McGill University, Montreal, QC, Canada, 10StoP-AD Centre, Douglas Mental Health Institute Research Centre, Montreal, QC, Canada, 11McGill University, Montreal, QC, Canada, 12StoP-AD Centre, Douglas Mental Health Institute, Montreal, QC, Canada, 13McGill Centre for Integrative Neuroscience, Montreal Neurological Institute, McGill University, Montreal, QC, Canada, 14McConnell Brain Imaging Center, Montreal Neurological Institute, McGill University, Montreal, QC, Canada, 15CRIUGM - Université de Montreal, Montreal, QC, Canada, 16Biospective Inc., Montreal, QC, Canada, 17Ludmer Centre for NeuroInformatics and Mental Health, Montreal, QC, Canada, 18Psychology, Concordia University, Montreal, QC, Canada, 19Neurology, Max Planck Institute for Human Cognitive and Brain Sciences, Leipzig, Germany
Synopsis
Although the APOE4 genotype is known to increase the risk of developing Alzheimer’s disease (AD), the mechanisms through which this occurs are not fully understood. Here, we used a voxel-wise multivariate approach, the Mahalanobis distance (MhD), to quantify the extent to which the white matter microstructure of individuals with the APOE4 genotype differ from those without the E4 allele. The MhD of individuals with the E4 allele deviated significantly from our reference group in several regions, including tracts projecting to the hippocampus, a region known for its involvement in AD. Future work will investigate links with cognition and lifestyle factors.
Introduction
Alzheimer’s disease (AD) is the most common form of dementia, affecting about 35 million individuals worldwide (WHO). It is associated with several environmental, genetic and lifestyle risk factors1. The pathological mechanisms underlying AD are still debated but growing evidence suggests AD develops from a complex cascade of events which can vary from individual to individual2–4. Traditionally, more attention has been given to grey matter (GM) abnormalities, especially loss of whole-brain and hippocampal GM volume5,6. However, recent studies have reported widespread WM alterations in AD patients and it has been suggested that changes in WM microstructure may precede GM changes and symptom onset5,7,8. The E4 allele of the apolipoprotein ε (ApoE) gene is known to increase an individual’s risk of developing AD, suggesting these individuals may present with brain abnormalities that predispose them to the disease8,9.Multivariate approaches have the potential to capture the complexity and heterogeneity of biological processes underlying behavior in health and disease in a more holistic manner compared to traditional univariate approaches10-12. Integrating multiple physiological measures in order to accurately characterize the interaction between these processes and the extent to which each contributes to the pathogenesis of a particular disease is a challenging endeavour, but it could have important implications for disease prevention and treatment. In this study, we quantified multivariate voxel-wise differences in WM microstructure in a group of individuals with the E4 allele of the ApoE gene (APOE4+) from a reference group (APOE4-) using the Mahalanobis distance (MhD), in order to identify potential areas of abnormalities in the brain of these individuals.
Methods
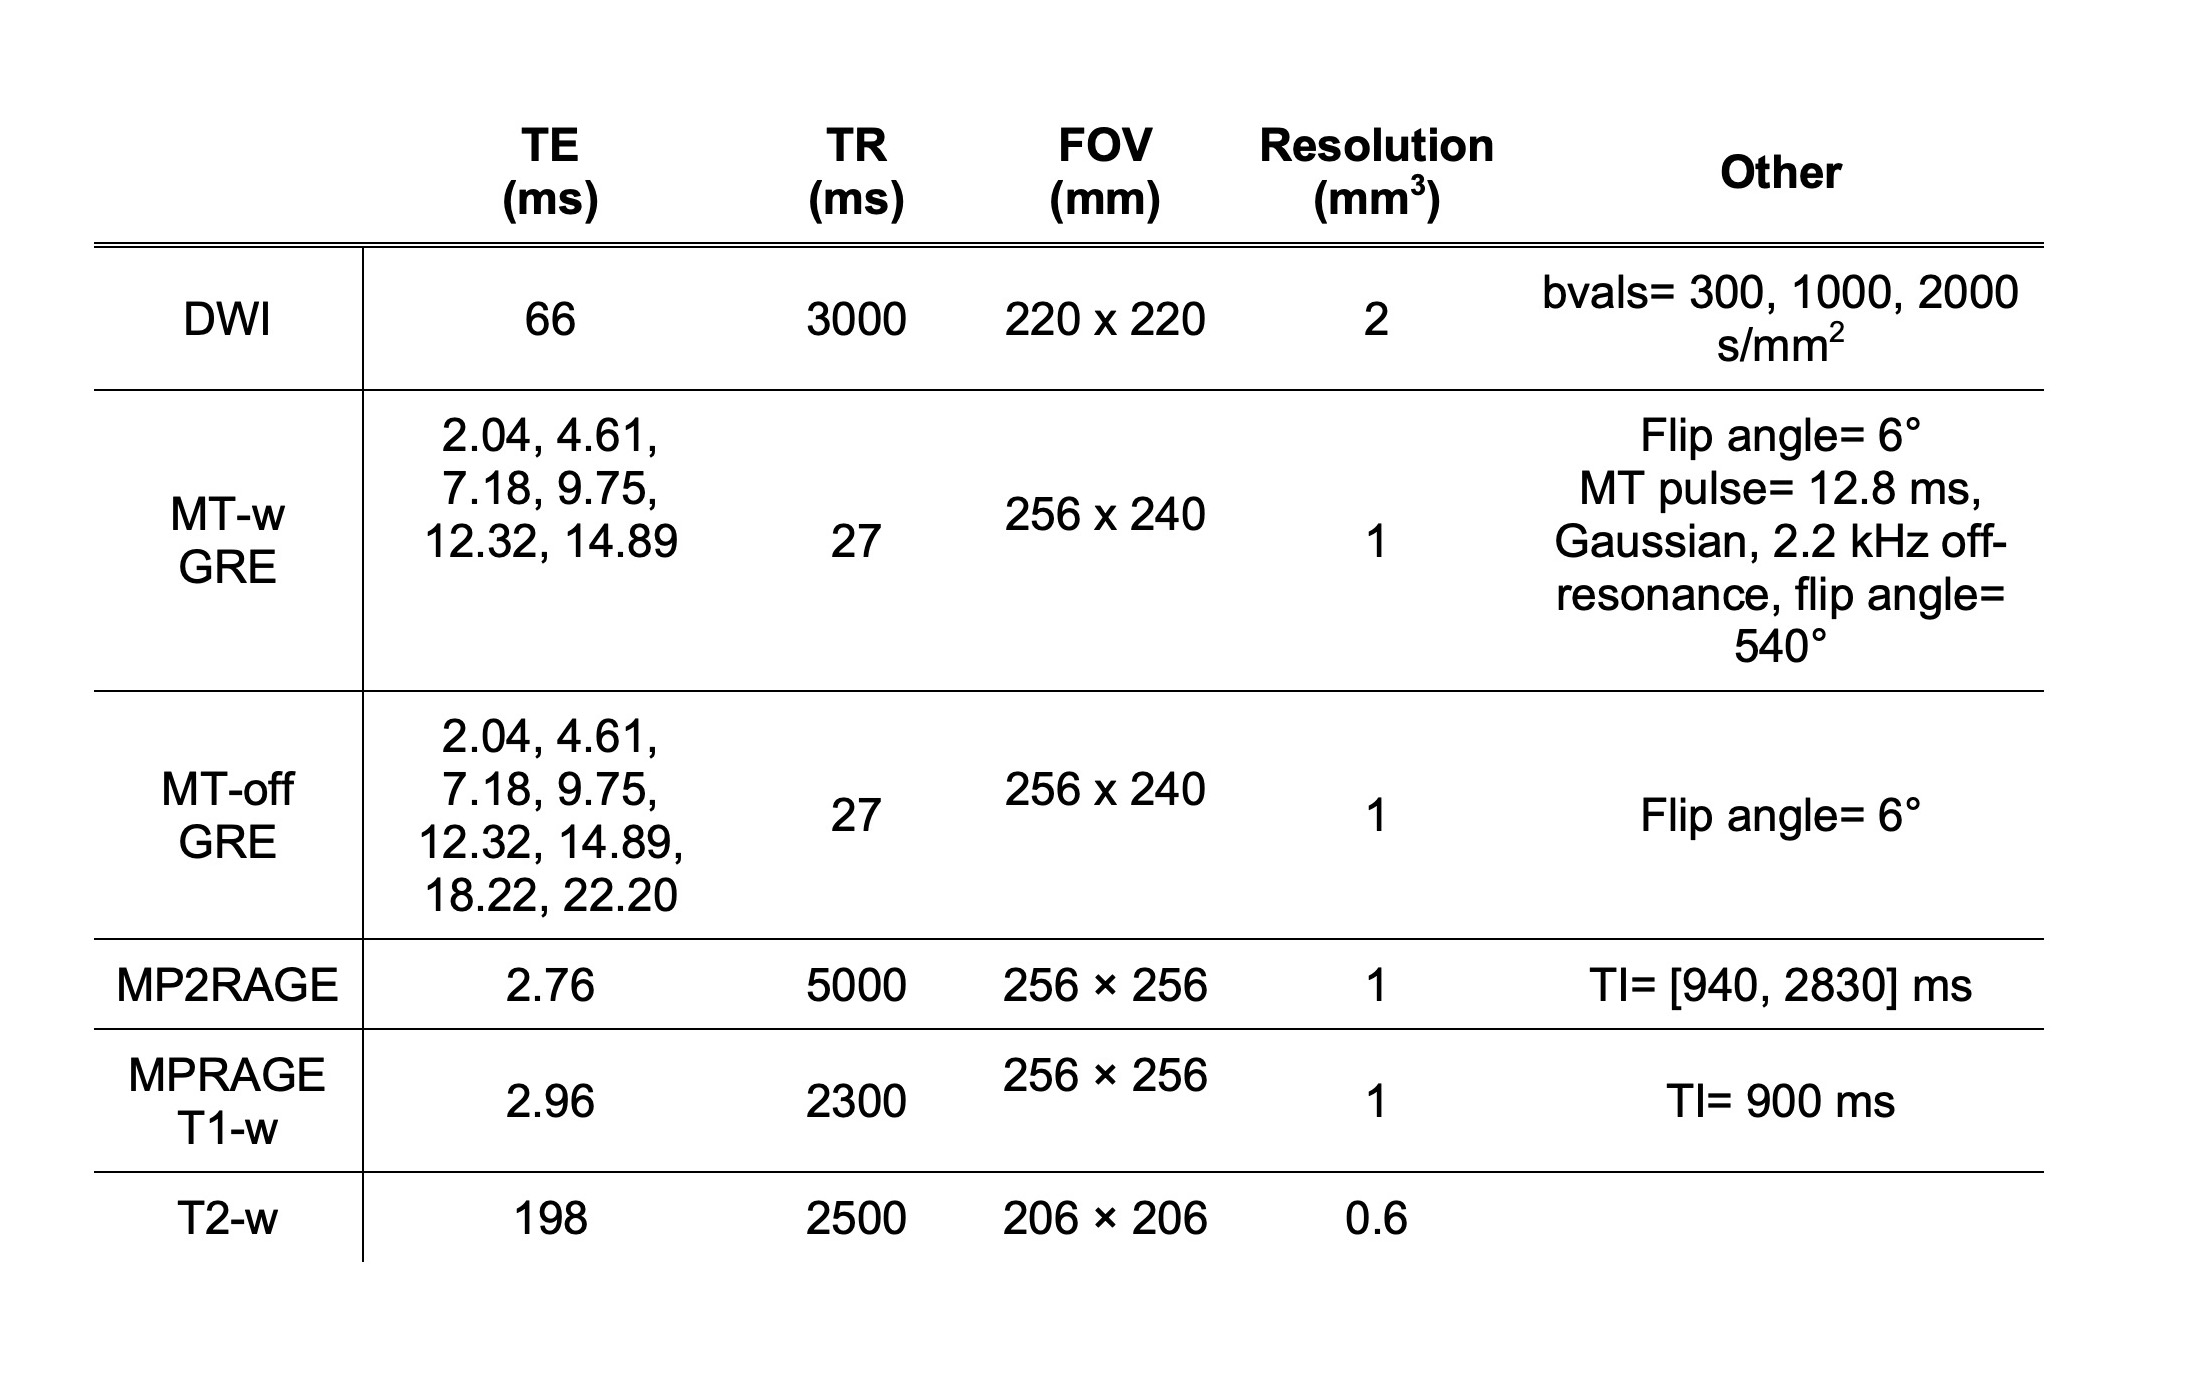
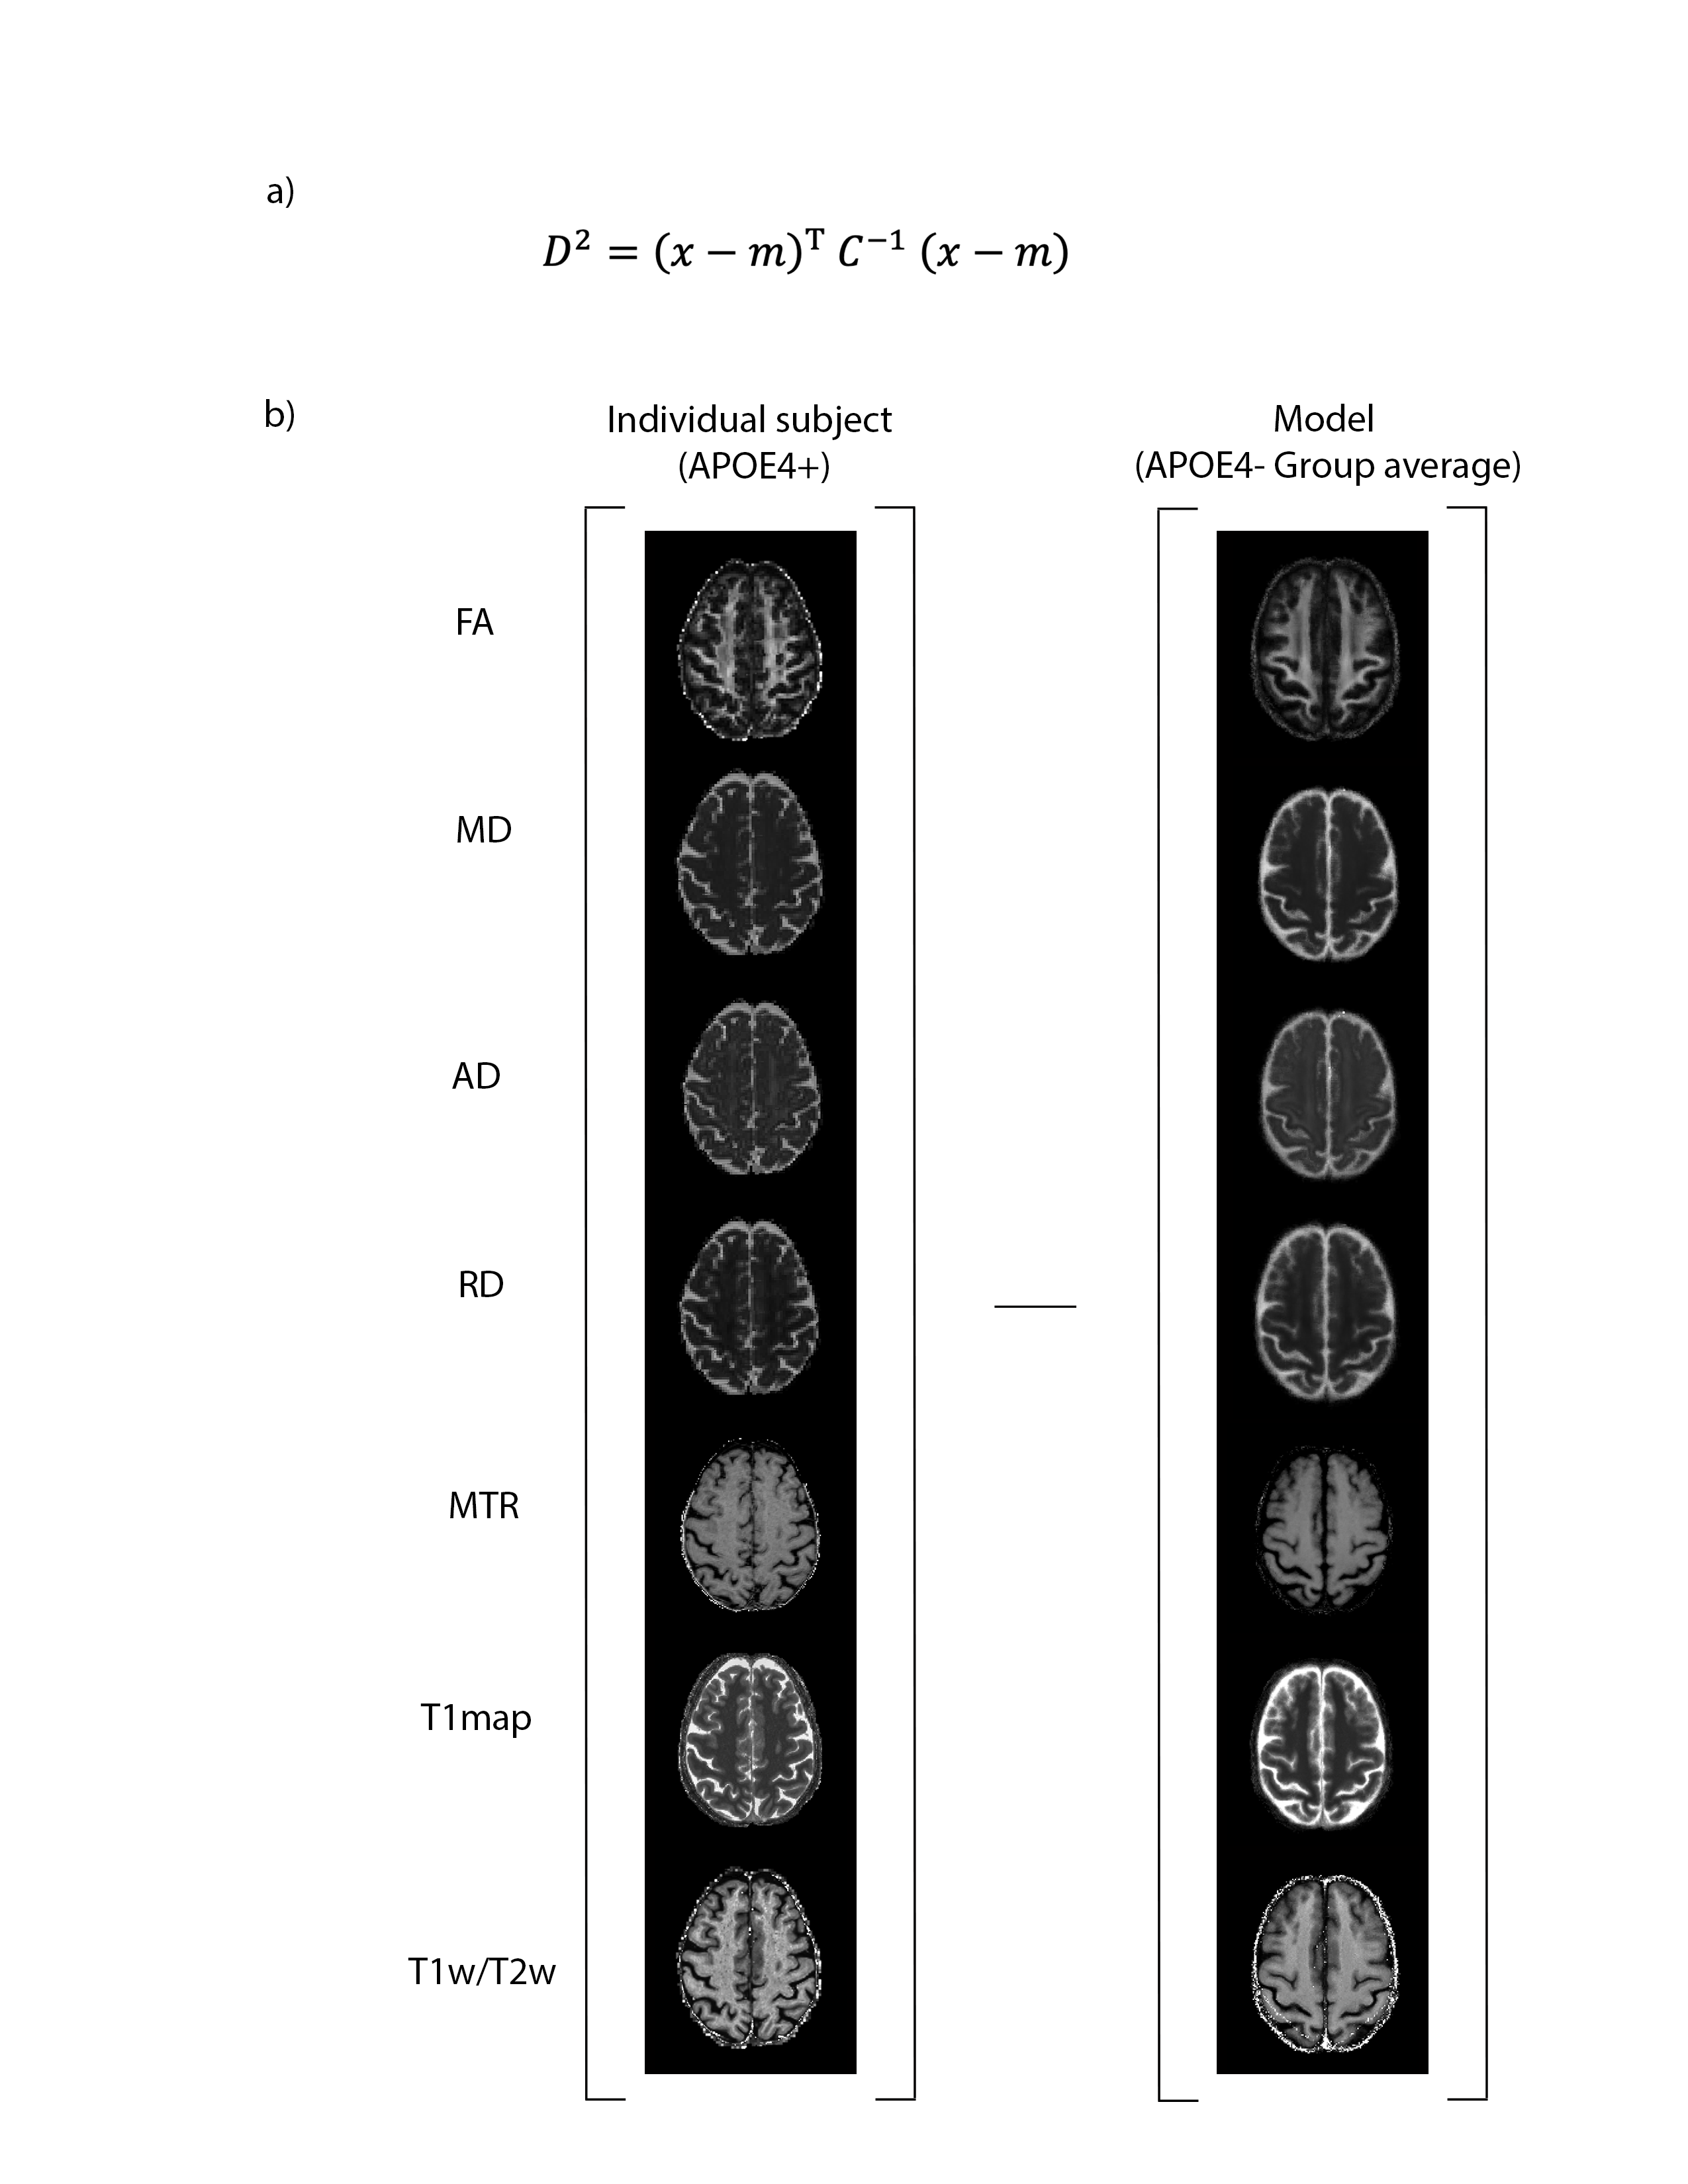
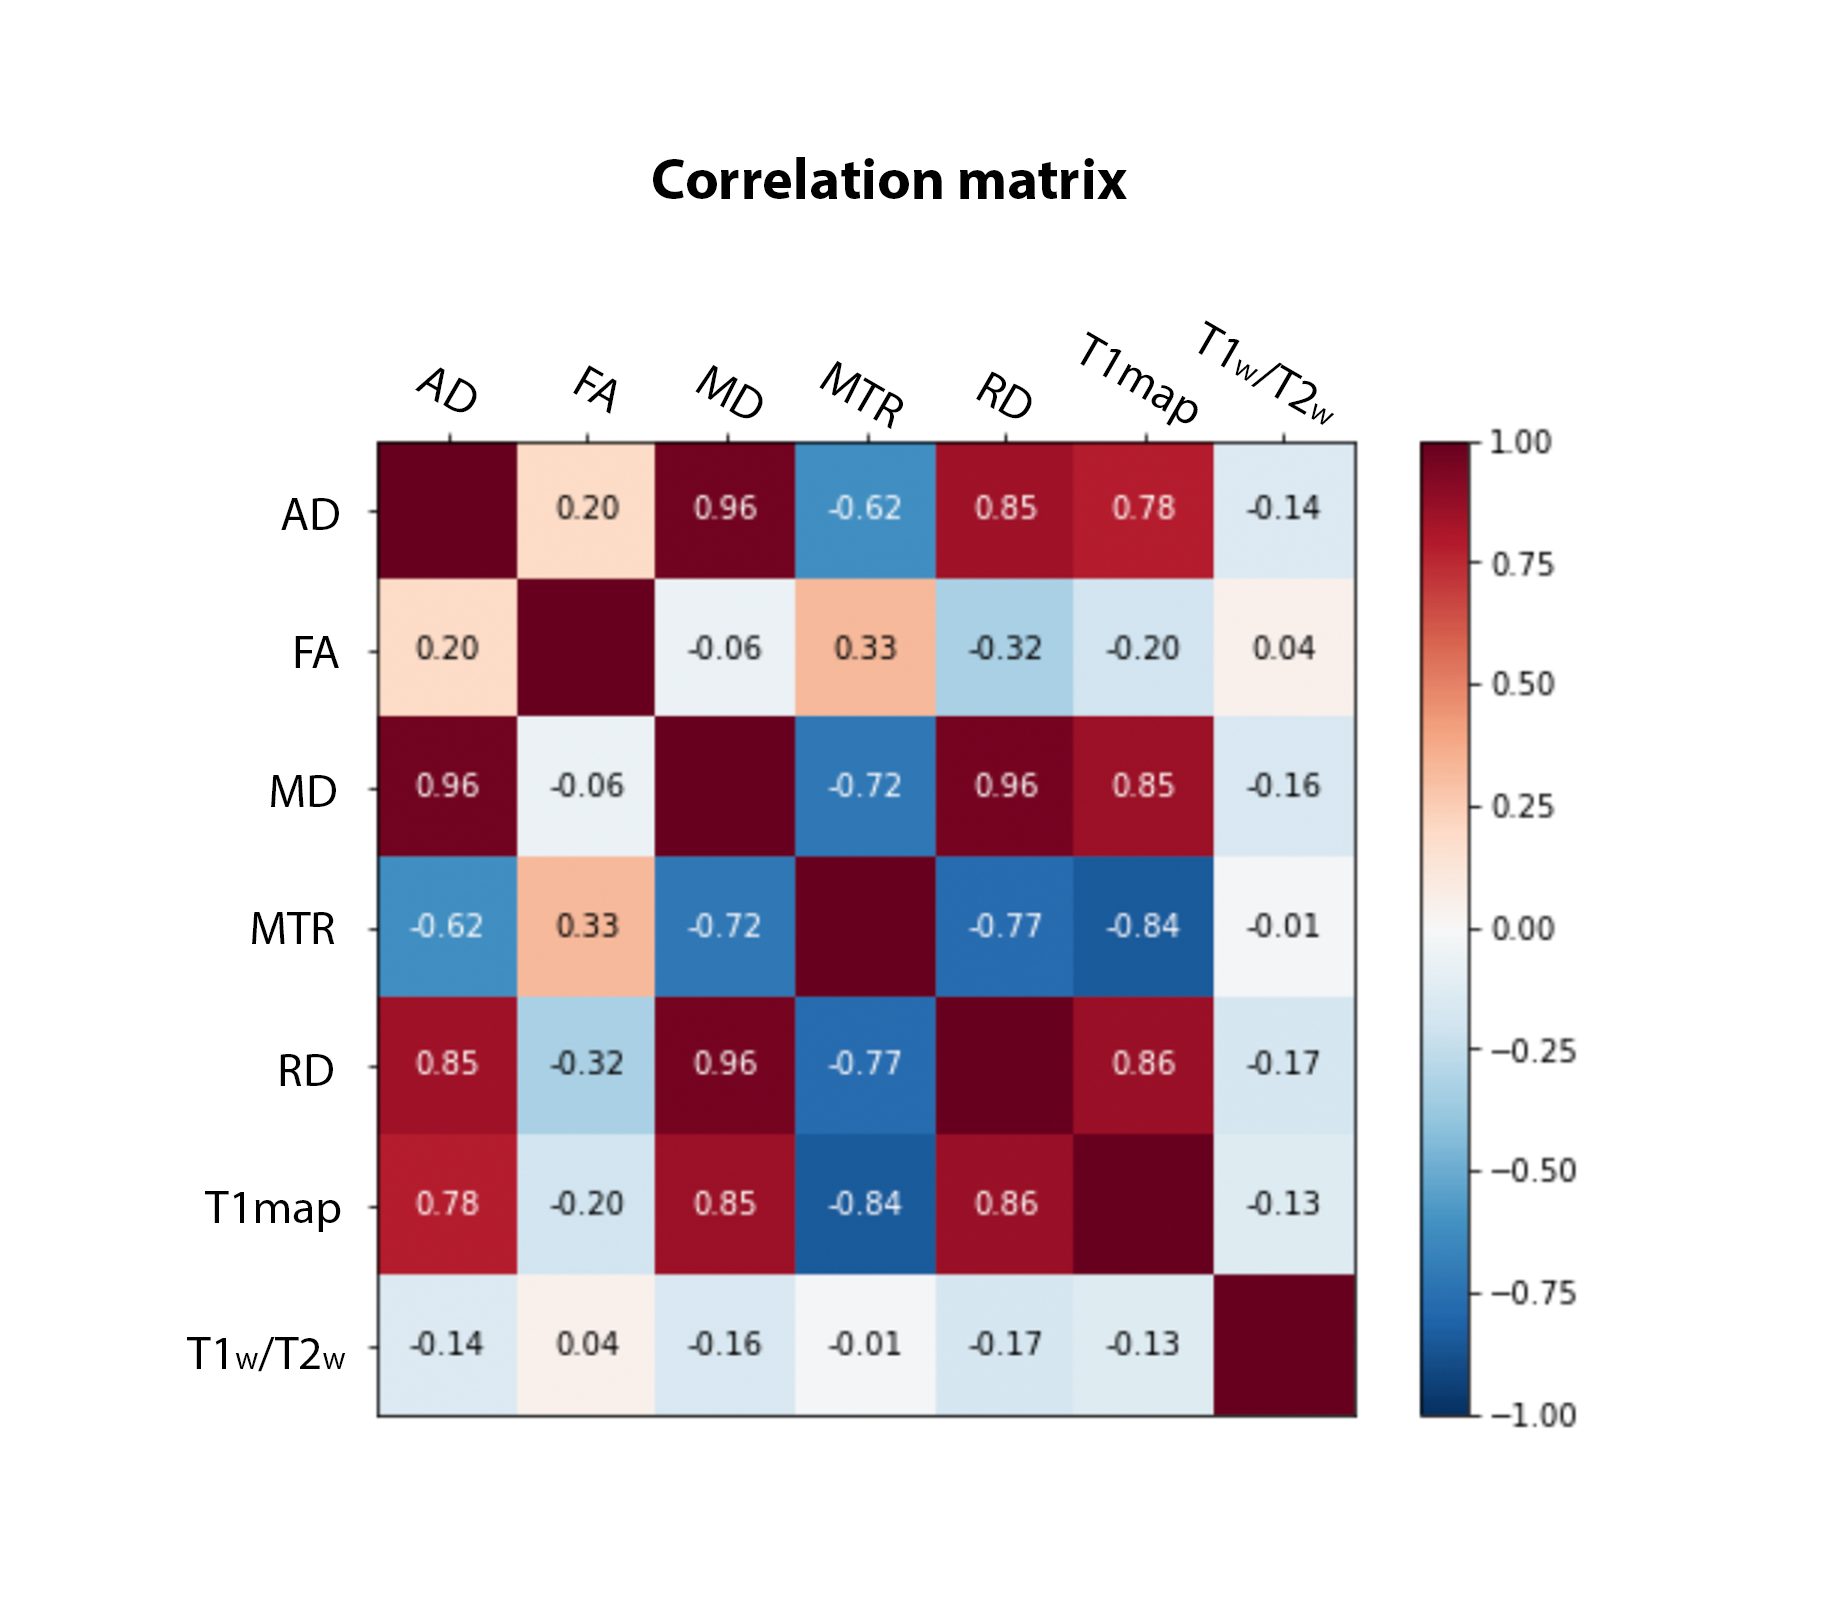
The MRI data of 35 cognitively unimpaired older adults with a family history of AD from the PREVENT-AD dataset were analysed in this study. Seventeen of these subjects had at least one E4 allele of the APOE gene (APOE4+ group: 10 females, age: 66.8 ± 3.7) and 18 subjects did not have the E4 allele (APOE4- group: 10 females, age: 66.9 ± 3.7). Diffusion-weighted imaging, multi-echo magnetization transfer imaging, MP2RAGE, MPRAGE T1-w, and T2-weighted data acquired on a 3T Prisma-Fit Siemens scanner with a 32-channel receive coil were used. DWI data were preprocessed and then fitted to a tensor model (DTI) to compute maps of fractional anisotropy (FA), mean, axial and radial diffusivities (MD, AD and RD)13–15. MT-off images were registered to MT-w images and the MT ratio (MTR) was calculated according to: MTR= (MToff - MTw )/ MToff, using the mean of the 6 first echoes of each series of images16,17. DTI metrics, MTR, T1 map from MP2RAGE, and T2w images were registered to the MPRAGE T1w image (rigid, within-subject). The T1w/T2w ratio was then calculated for each subject18. The T1w images were co-registered across subjects and the warps generated were then applied to all maps (i.e., FA, MD, AD, RD, MTR, T1 map and T1w/T2w) using ANTs19.A feature matrix of size [voxels in white matter] x 7 features was created for each subject of the APOE4+ group. Group average maps were then computed from the APOE4- group, which served as a reference. The covariance matrix was computed from the samples of the reference group (Fig 2), and the voxel-wise MhD between each subject of the APOE4+ group and the model (i.e., group average of the APOE4- group) was calculated using the equation shown in Fig 1a. Fig 1b illustrates part of the process for calculating the MhD at each voxel: subtracting a vector of mean values from the vector of values at a given voxel (each of size 1 x 7). Lastly, a one-sample t-test was conducted to determine whether there were brain regions where the MhD of participants of the APOE4+ group were significantly different from zero.
Results
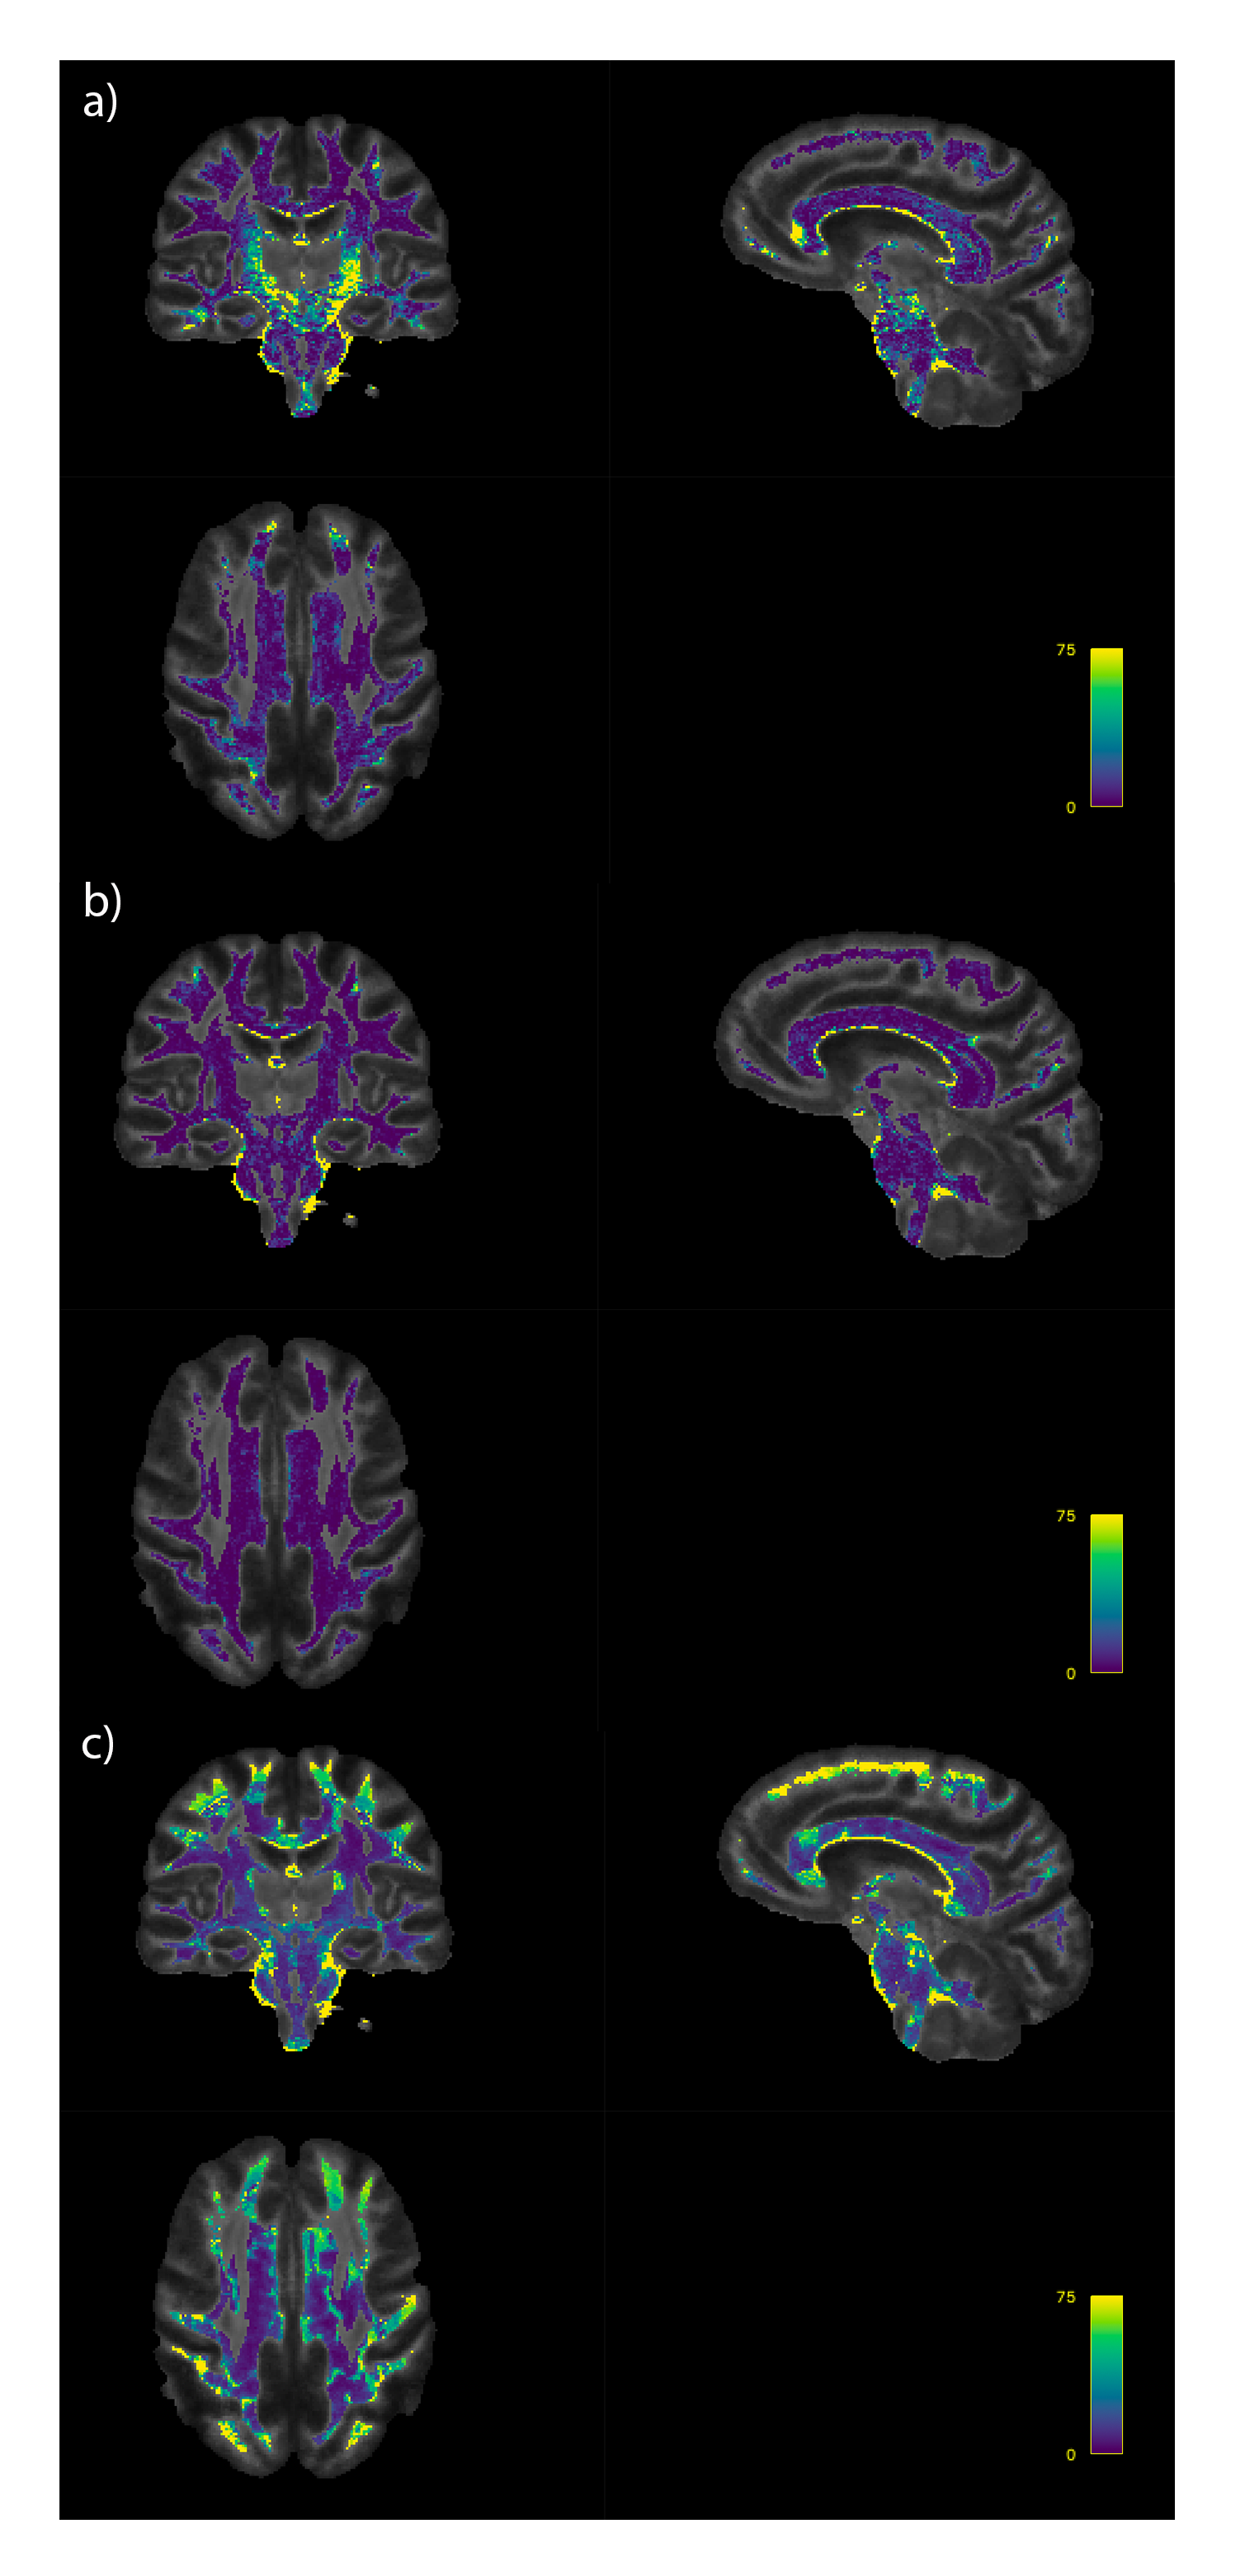
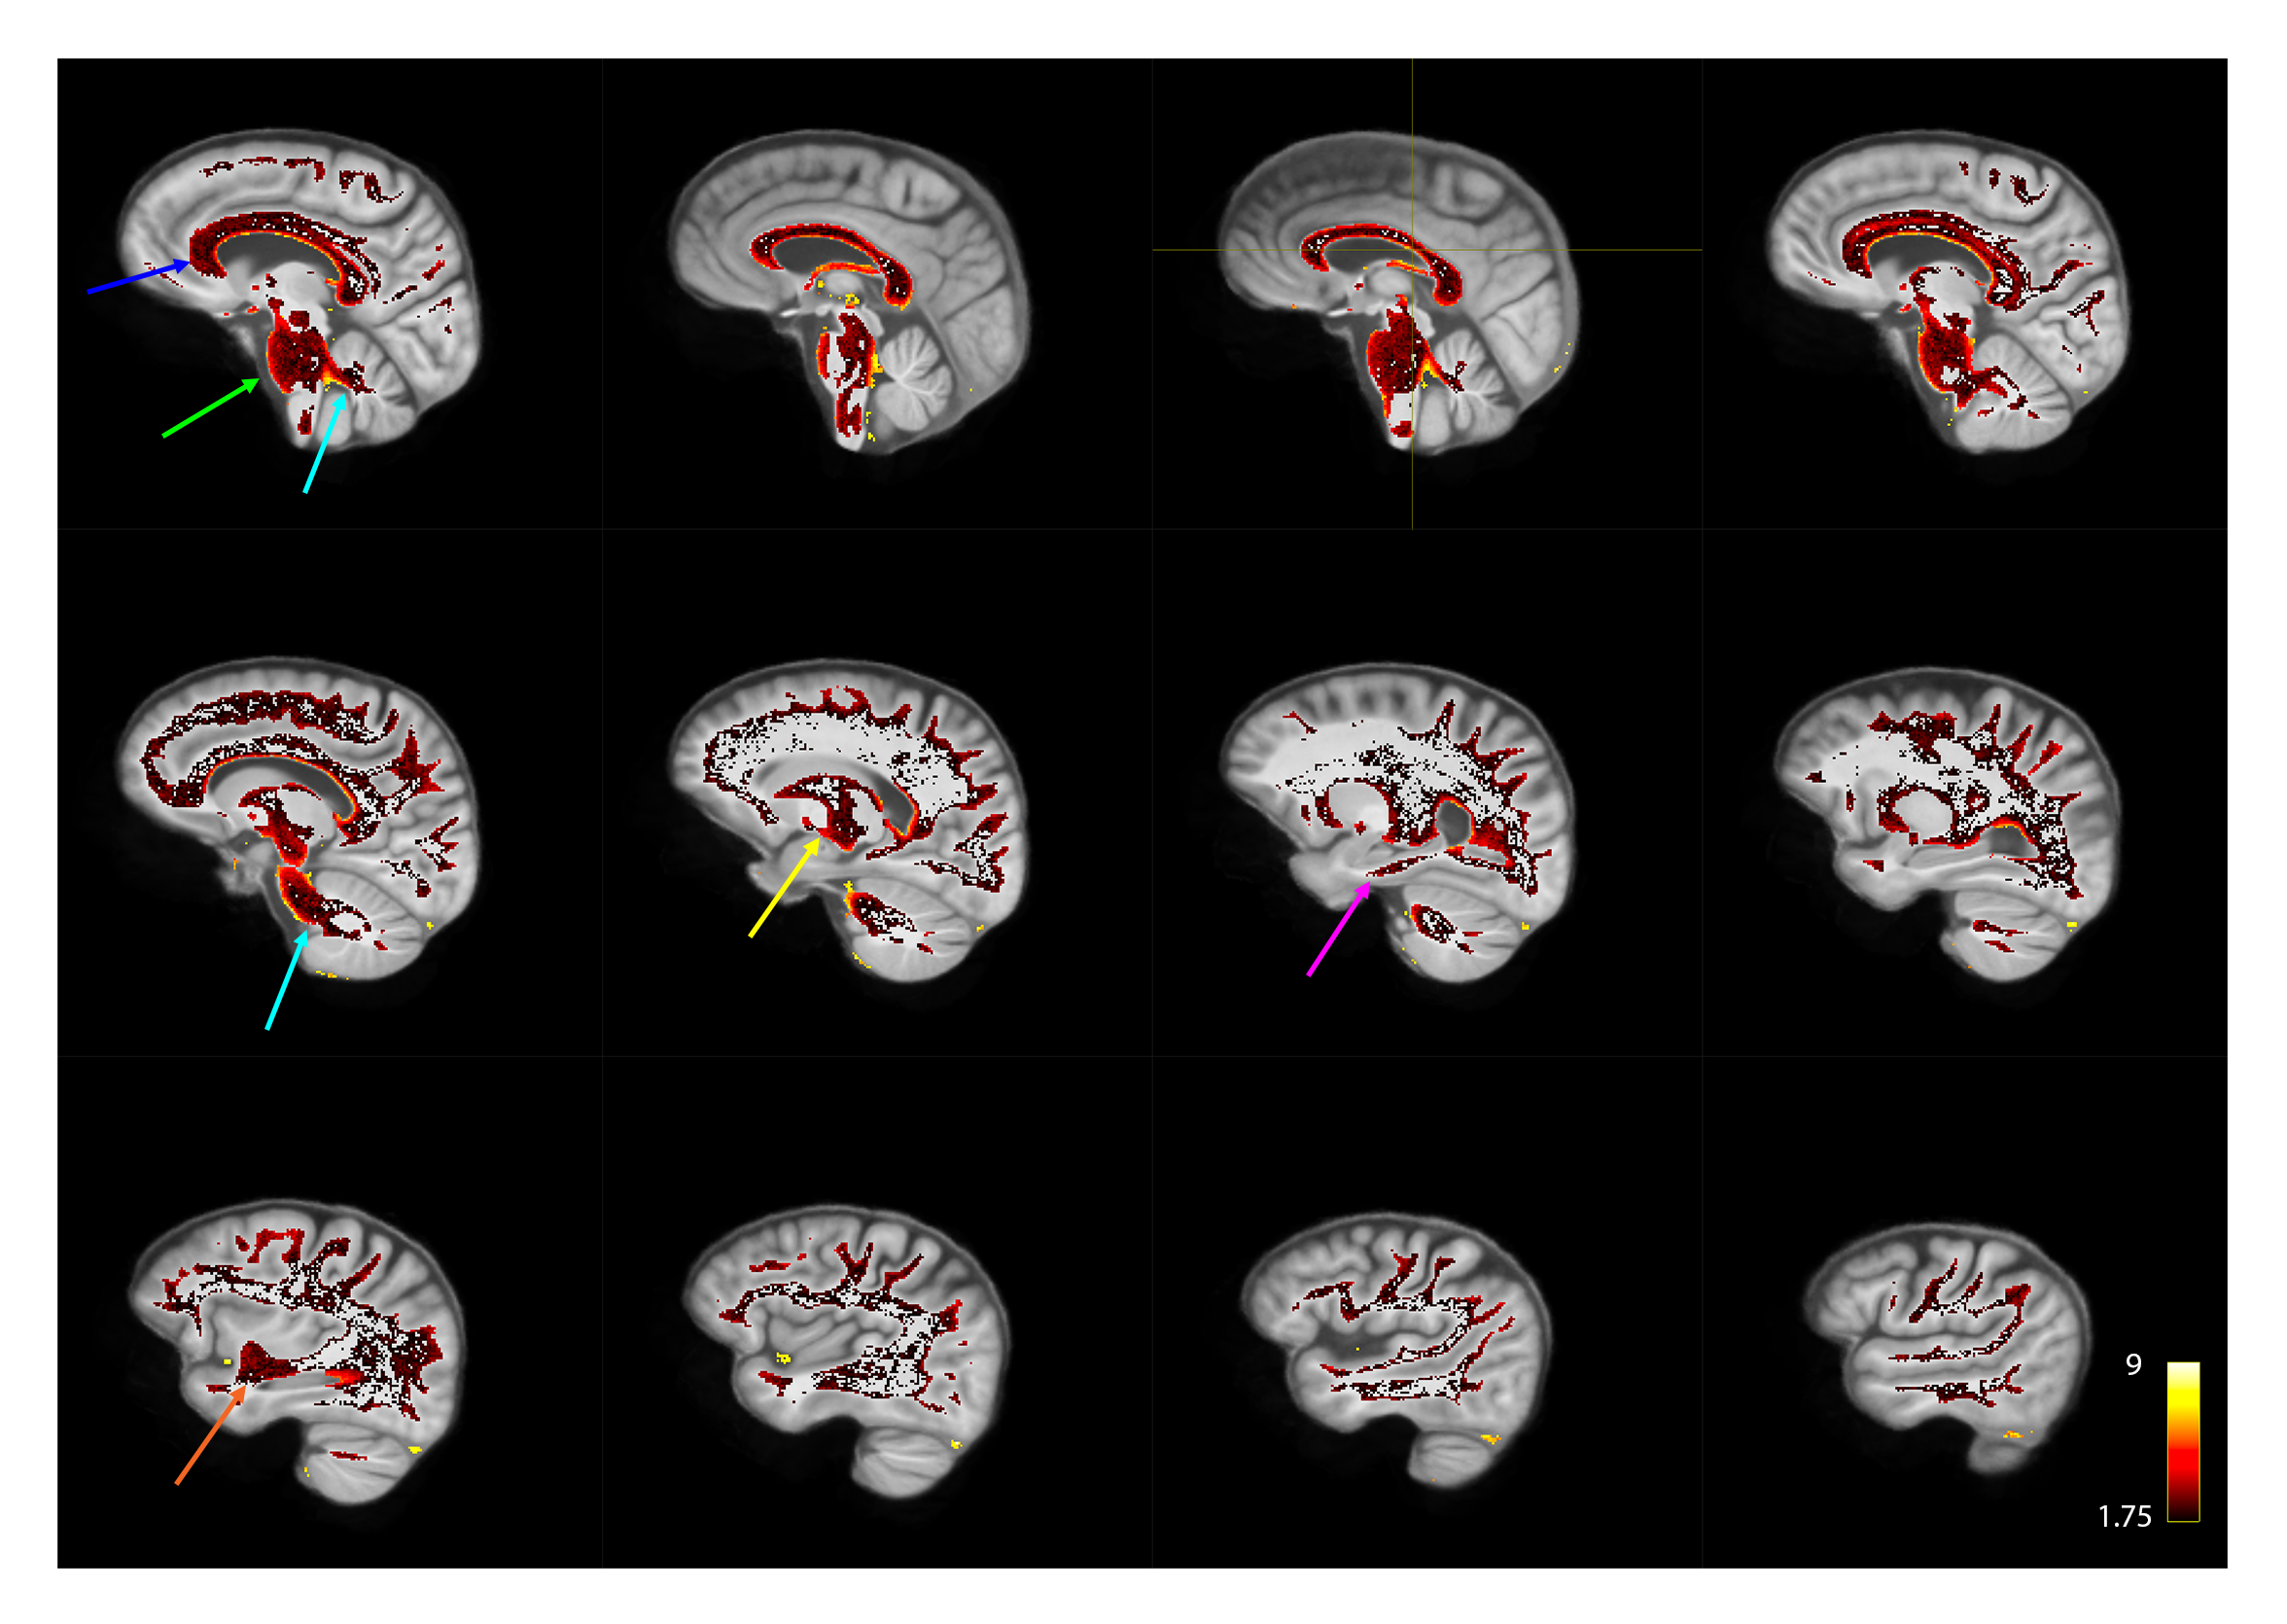
Fig 3 shows example distance maps in two subjects of the APOE4+ group. We can see, for instance, that the first subject (Fig 3a) has overall greater distance values relative to the mean model than the second subject (Fig 3b), suggesting a greater level of deviation from the APOE4- group. High distance values were located in the cortico-spinal tracts and in the genu of the corpus callosum in this subject (Fig 3a). The MhD in the APOE4+ group was significantly different from zero in large areas of the pons, cerebellar tracts, corpus callosum and parahippocampal cingulum (Fig 4; uncorrected p<0.05).Conclusion
In this study, we identified several regions where the MhD of individuals with the E4 allele deviated significantly from the group of individuals without the APOE4 genotype. This suggests the presence of WM microstructural abnormalities in several major WM tracts in these cognitively normal individuals with a genetic risk for developing AD, including tracts projecting to the hippocampus, a region known to be affected in AD patients6,20,21. In future work, we will validate these findings in a larger sample by comparing the MhD of the APOE4+ group to those of the APOE4- group, computed using the leave-one-out approach22. Relationships with lifestyle factors and behavioral outcomes will also be investigated. A more comprehensive characterization of brain alterations in individuals at risk of developing AD could contribute to improving diagnosis accuracy, which could lead to earlier detection, and in developing personalized prevention and treatment strategies.Acknowledgements
SAT was supported by the Canadian Institutes of Health Research (CIHR: FBD 175862).
JH was supported by the Natural Science and Engineering Research Council (NSERC RGPIN-2015-04665).
CJS was supported by the Max Planck Society, the Natural Science and Engineering Research Council (NSERC: RGPIN-2020-06812, DGECR-2020-00146), the Heart and Stroke Foundation of Canada New Investigator Award, and the Canadian Institutes of Health Research (HNC 170723).
CJG was supported by the Heart and Stroke Foundation New Investigator Award and J.M. Barnett fellowhip, and the Michal and Renata Hornstein Chair in Cardiovascular Imaging and the Heart and Stroke Foundation Grant-in-Aid G-17-0018336.
YI-M and CJS were supported by the BIC-Concordia Collaboration Program.
Data used in preparation of this abstract were obtained from the Pre-symptomatic Evaluation of Novel or Experimental Treatments for Alzheimer’s Disease (PREVENT-AD) program (https://douglas.research.mcgill.ca/stop-ad-centre), data release 6.0 (2020). A complete listing of PREVENT-AD Research Group can be found in the PREVENT-AD database: https://preventad.loris.ca/acknowledgements/acknowledgements.php?date=[2019-06-03]. The investigators of the PREVENT-AD program contributed to the design and implementation of PREVENT-AD and/or provided data but did not participate in analysis or writing of this report.
References
1. Livingston G, Huntley J, Sommerlad A, et al. Dementia prevention, intervention, and care: 2020 report of the Lancet Commission. The Lancet. 2020;396(10248):413-446. doi:10.1016/S0140-6736(20)30367-6
2. Iturria-Medina Y, Sotero RC, Toussaint PJ, Mateos-Pérez JM, Evans AC. Early role of vascular dysregulation on late-onset Alzheimer’s disease based on multifactorial data-driven analysis. Nat Commun. 2016;7(1):11934. doi:10.1038/ncomms11934
3. Iturria-Medina Y, Carbonell FM, Sotero RC, Chouinard-Decorte F, Evans AC. Multifactorial causal model of brain (dis)organization and therapeutic intervention: Application to Alzheimer’s disease. NeuroImage. 2017;152:60-77. doi:10.1016/j.neuroimage.2017.02.058
4. Lam B, Masellis M, Freedman M, Stuss DT, Black SE. Clinical, imaging, and pathological heterogeneity of the Alzheimer’s disease syndrome. Alzheimers Res Ther. 2013;5(1):1. doi:10.1186/alzrt155
5. Yin RH, Tan L, Liu Y, et al. Multimodal Voxel-Based Meta-Analysis of White Matter Abnormalities in Alzheimer’s Disease. J Alzheimers Dis. 2015;47(2):495-507. doi:10.3233/JAD-150139
6. Wang WY, Yu JT, Liu Y, et al. Voxel-based meta-analysis of grey matter changes in Alzheimer’s disease. Transl Neurodegener. 2015;4(1):6. doi:10.1186/s40035-015-0027-z
7. Araque Caballero MÁ, Suárez-Calvet M, Duering M, et al. White matter diffusion alterations precede symptom onset in autosomal dominant Alzheimer’s disease. Brain. 2018;141(10):3065-3080. doi:10.1093/brain/awy229
8. Adluru N, Destiche DJ, Lu SYF, et al. White matter microstructure in late middle-age: Effects of apolipoprotein E4 and parental family history of Alzheimer’s disease. NeuroImage Clin. 2014;4:730-742. doi:10.1016/j.nicl.2014.04.008
9. Bonnar O, Shaw K, Grijseels DM, et al. APOE4 Genotype Increases Neuronal Calcium Signals and Decreases Pial Arteriole Responsivity and Vasomotion in Visual Cortex of Awake Mice. Neuroscience; 2021. doi:10.1101/2021.05.26.445731
10. Tardif CL, Gauthier CJ, Steele CJ, et al. Advanced MRI techniques to improve our understanding of experience-induced neuroplasticity. Neuroimage. 2016;131:55-72.
11. Owen TW, de Tisi J, Vos SB, et al. Multivariate white matter alterations are associated with epilepsy duration. Eur J Neurosci. 2021;53(8):2788-2803. doi:10.1111/ejn.15055
12. Taylor PN, Silva NM da, Blamire A, Wang Y, Forsyth R. Early deviation from normal structural connectivity: A novel intrinsic severity score for mild TBI. Neurology. 2020;94(10):e1021-e1026. doi:10.1212/WNL.0000000000008902
13. Tustison NJ, Avants BB, Cook PA, et al. N4ITK: Improved N3 Bias Correction. IEEE Trans Med Imaging. 2010;29(6):1310-1320. doi:10.1109/TMI.2010.2046908
14. Andersson JL, Sotiropoulos SN. An integrated approach to correction for off-resonance effects and subject movement in diffusion MR imaging. Neuroimage. 2016;125:1063-1078.
15. Tournier JD, Smith R, Raffelt D, et al. MRtrix3: A fast, flexible and open software framework for medical image processing and visualisation. NeuroImage. Published online 2019:116137.
16. Weiskopf N, Suckling J, Williams G, et al. Quantitative multi-parameter mapping of R1, PD*, MT, and R2* at 3T: a multi-center validation. Front Neurosci. 2013;7:95. doi:10.3389/fnins.2013.00095
17. Helms G, Dechent P. Increased SNR and reduced distortions by averaging multiple gradient echo signals in 3D FLASH imaging of the human brain at 3T. J Magn Reson Imaging JMRI. 2009;29(1):198-204. doi:10.1002/jmri.21629
18. Glasser MF, Essen DCV. Mapping Human Cortical Areas In Vivo Based on Myelin Content as Revealed by T1- and T2-Weighted MRI. J Neurosci. 2011;31(32):11597-11616. doi:10.1523/JNEUROSCI.2180-11.2011
19. Avants BB, Tustison N, Song G. Advanced normalization tools (ANTS). Insight J. 2009;2(365):1-35.
20. Jacobs HIL, Hedden T, Schultz AP, et al. Structural tract alterations predict downstream tau accumulation in amyloid-positive older individuals. Nat Neurosci. 2018;21(3):424-431. doi:10.1038/s41593-018-0070-z
21. Zhang Y, Schuff N, Du AT, et al. White matter damage in frontotemporal dementia and Alzheimer’s disease measured by diffusion MRI. Brain. 2009;132(9):2579-2592. doi:10.1093/brain/awp071
22. Dean DC, Lange N, Travers BG, et al. Multivariate characterization of white matter heterogeneity in autism spectrum disorder. NeuroImage Clin. 2017;14:54-66. doi:10.1016/j.nicl.2017.01.002
Figures